Indonesian Journal of Biotechnology
VOLUME 22(1), 2017, 22–30 | RESEARCH ARTICLE
Assessment of gene c diversity among surian
Toona sinensis
Roem in
progenies test using random amplified polymorphic DNA markers
Jayusman1,2,∗, Muhammad Na’iem2, Sapto Indrioko2, Eko Bhak Hardiyanto2, and ILG Nurcahyaningsih1
1Centre for Forest Biotechnology and Tree Improvement Research and Development, Jalan Palagan Tentara Pelajar Km. 15,
Purwobinangun, Pakem, Sleman, Yogyakarta 55582, Indonesia
2Faculty of Forestry, Universitas Gadjah Mada, Jalan Agro No. 1, Bulaksumur, Yogyakarta 55281, Indonesia
∗Corresponding author:[email protected]
ABSTRACTSurianToona sinensisRoem is one of the most widely planted species in Indonesia. This study aimed to es -mate the gene c diversity between a number of surian popula ons in a progeny test using RAPD markers, with the goal of proposing management strategies for a surian breeding program. Ninety-six individual trees from 8 popula ons of surian were chosen as samples for analysis. Eleven polymorphic primers (OP-B3, OP-B4, OP-B10, OP-H3, OP-Y6, OP-Y7, OP-Y8, OP-Y10, OP-Y11, OP-Y14, and OP-06) producing reproducible bands were analyzed for the 96 trees, with six trees per family sampled. Data were analyzed using GenAlEx 6.3, NTSYS 2.02. The observed percentage of polymorphic loci ranged from 18.2% to 50%. The mean level of gene c diversity among the surian popula ons was considered to be moderate (He 0.304). Cluster analysis grouped the genotypes into two main clusters, at similarity levels of 0.68 and 0.46. The first two axes of the PCoA explained 46.16% and 25.54% of the total varia on, respec vely. The grouping of samples into clusters and subclusters did not correspond with family and their distances, but the grouping was in line with the gene c distances of the samples.
KEYWORDSgene c diversity; progeny test; RAPD;Toona sinensis
1. Introduc on
SurianToona sinensisRoem (family Meliaceae) is widely distributed and cultivated in Southeast Asia including In-dia, Nepal, Thailand, Malaysia, Australia, the Philippines, and Indonesia (Pennington and Styles 1975;Edmonds and Staniforth 1998). In Indonesia this species can be found in several islands in agricultural lands owned by commu-nity forests (Pramono et al. 2008). Surian is a valuable and fast growing timber species whose wood is reddish, hard, and shiny with a beautiful grain. Its timber is excellent in construction, interior decoration, furniture, musical instru-ments, shipbuilding and other fields. Its bark fiber can be used to make paper. Its bark, flower, leaf and oil from seed extracted have been used in traditional medicine. Com-pared with other species, it is more conducive to plant all around, and can be used as the main tree species in green and farm land all around in agroforestry (Zhou et al. 2010). These domesticated resources are important and valuable germplasm for surian breeding (Xing et al. 2016).
In most forest tree improvement programs around the world, progeny tests are used to estimate breeding values of selections (Zobel and Talbert 1984). The establishment of a progeny trial is complex. It is a challenge to maintain
pseudoacacia(Liesebach et al. 2004).
Genetic breeding of perennial plant species, such as forest essences, depends on the efficient selection of the best individuals to be used to obtain new plants with de-sirable traits. As such, it is important to adopt precise methods of selection. Progeny testing is essential to as-sessing genetic diversity, which is a prerequisite in any breeding program. The status of genetic diversity can be determined using several methods such as isozyme and other DNA based markers. In recent decades many molec-ular markers have been used to detect the genetic diver-sity within and among plant populations (Bharmauria et al. 2009). Molecular markers such as d RAPD (Random Am-plified Polymorphic DNA) provide useful information re-lated to evolution and population genetics (Kimura et al. 2009) and research genetic diversity between individual trees (Zarek 2009). Among molecular markers, RAPD markers have generally been used for the detection of ge-netic variation within and among populations in several plant species and populations without the need for detailed knowledge of DNA (Zarek 2009).
In particular, RAPD offers a cheap and simple DNA based marker alternative, considering the advantages of small amount of DNA, radioactivity-free procedure, ease and speed of the assay and lack of requirement for DNA sequence information of a species (Williams et al. 1990;
Tingey et al. 1994;Ye et al. 1996;Martin et al. 1997). Al-though RAPD is of dominant marker, several strategies have been put forward to minimize the dominance effects on genetic variation analyses (Lynch and Milligan 1994). In occasional cases RAPD is poor in reproducibility, but this can usually be solved by the optimization of reaction conditions (Weising et al. 1994). In general, RAPD can provide valuable data about genetic variations within and among populations of a species, given that data (Collignon et al. 2002). This technique has been applied for detect-ing population genetic diversity ofToona sinensis(Wang et al. 2008; Hidayat and Siregar 2011), Toona australis (Tavares et al. 2012),Toona ciliata(Liu et al. 2014;Li et al. 2015),Melia azedarach(Yulianti 2011),Melia volkeensii (Runo et al. 2004),Lathyrus sativus(Nosrati et al. 2012),
Gmelina arborea(Wee et al. 2012),Quercussp. (Dering and Chybicki 2012),Pinus nigra(Çengel et al. 2012), and Lansium domesticum(Song 2000).
There is an urgent need to initiate a program of genetic improvement, especially to develop seed orchard consid-ering the increasing areas of surian plantation. Therefore, this experiment was carried out with aims at determining the patterns of individual genetic diversities of surian in progeny test based on RAPD marker, to support the im-provement program of surian breeding strategy.
2. Materials and methods
2.1. Sample collec on
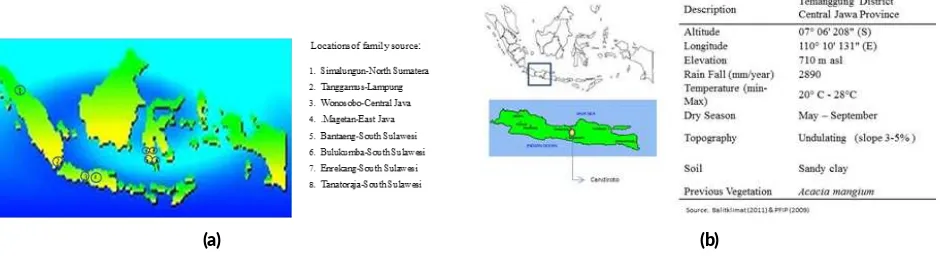
Ninety-nine of T. sinensis samples were collected from progeny test. Origin of geographical location and mate-rials used in this research has been established on progeny test of half-sib of surian in Candiroto, Central Java, In-donesia (Figure1).
2.2. DNA isola on
Genomic DNA of 96 genotypes was extracted from 50-60 g dry individual surian leaves with CTAB (Cetyl Trimethyl Ammonioum Bromide) method modification (Shiraishi and Watanabe 1995).
2.3. DNA purifica on
DNA purification was performed using the Gene Clean III Kit. The principle of this method is to use of silica (glassmilk). The extraction result was then centrifugated and added 25 uL psdH2O. After being vortexed, 300 uL NAI was then added. Purification of the pellet was dried with a desiccator, then added psdH2O and vortexed. The obtanined DNA solution then stored in 1.5 mL microtube.
2.4. DNA Quan fica on
After purification, DNA was quantified by the GeneQuant (Parmacia). In GeneQuant, suitably diluted DNA in dis-tilled water was read at A230, A260, A280 and A320 nm. GeneQuant Method of 1.8–2.0 to indicate a good DNA preparation. A 260 of 1 corresponds to 50 μg/mL of DNA
(a) (b)
in a 1 cm quartz cuvette. The unknown DNA concentra-tion can then be calculated.
2.5. Dilu on
DNA dilution was intended to facilitate the use of quanti-fied DNA solutions. The dilution of the purification vol-ume was carried out based on the concentration of the quantified result by the addition of psdH2O according to the DNA concentration.
2.6. PCR amplifica on
PCR amplification were carried out in a thermal cycler in a final volume of 10 μL, containing 4.0 uL template DNA, 0.8 μL of each of the four deoxynucleotide triphosphate, 0.5 uL of primer, 1.2 mM MgCl2, 10x Tag stofel buffer (10 mM Tris HCl pH 9.0, 50 mM KCl) and 0.5 U Taq DNA polymerase. The samples were further subjected for initial denaturation for 5 min at 94°C, followed by 39 cy-cles of 1 min at 94°C, 1 min at 39°C and 1 min at 72°C with a final extension of 7 min at 72°C. 10 μL of ampli-fied PCR product was separated through gel electrophore-sis on 1.5% agarose gel stained with ethidium bromide and photographed with gel documentation system (Sambrook et al. 1989).
2.7. RAPD profiling
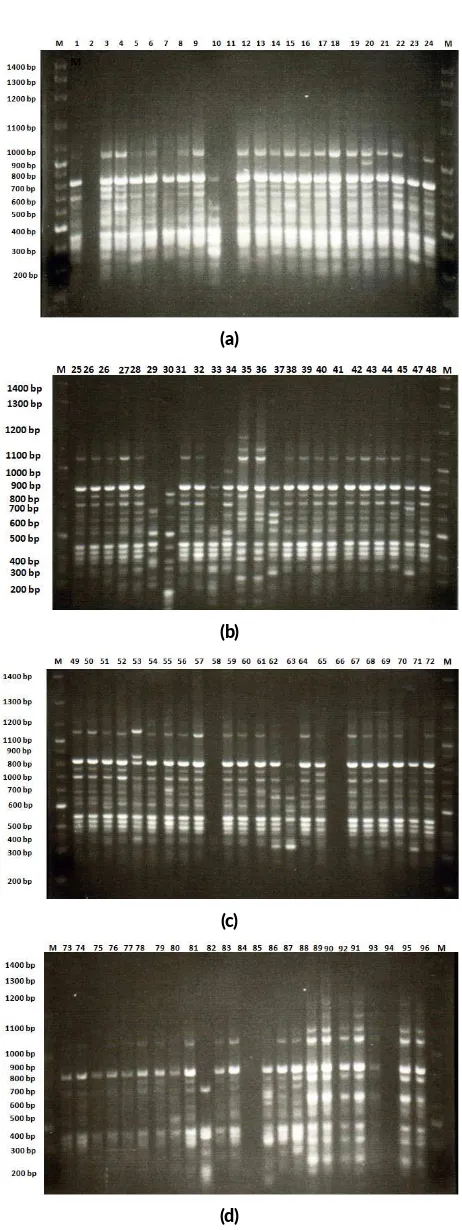
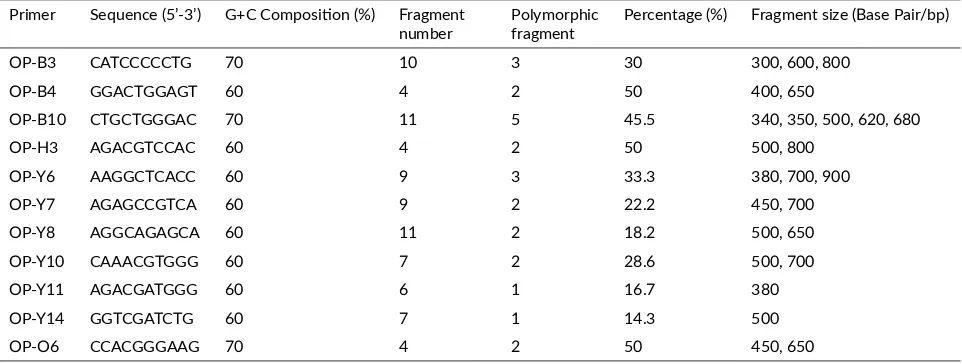
The samples which showed the amplification with the selected primers were selected further for RAPD profil-ing. DNA fragment size on agarose gel was estimated by comparing with 1kb DNA ladder. In this study, primers producing the total amount of polymorphic DNA bands were primers of OP-B3 (10 DNA bands), OP-B4 (4 DNA bands), OP-B10 (11 DNA bands), OP-H3 (4 DNA bands), OP-Y6 (9 DNA bands), OP-Y7 (9 DNA bands), OP-Y8 (11 DNA bands), OP-Y10 (7 DNA bands), OP-Y11 (6 DNA bands), OP-Y14 (7 DNA bands) and OP-O6 (4 DNA bands). In general, result of the amplification of eleven primers produced level of DNA band polymorphism for 30.5% (25 polymorphic DNA bands). The polymorphic DNA bands were mostly produced in primers of OP-B10 and OP-Y8 (11 DNA bands with the polymorphism level of 50.0 and 18.2%) and the least was produced in primers of OP-B4 and OP-O6 (4 DNA bands with the polymor-phism level of 50%). RAPD profile form DNA patterns of surian are shown in Figure2.
2.8. Data scoring and analysis
Amplified bands generated from RAPD and RPCR am-plification were scored based on the presence (1) or ab-sence (0) of bands for each primer and were used to cal-culate a similarity matrix (SM) using NTSYS-pc version 2.02 (Rohlf 2000). SM were compiled for all pairs of indi-vidual using SM similarity coefficients, using SIMQUAL, and then cluster analysis was done using unweighted pair-group method with arithmetic mean using the SAHN pro-gram. The cophenetic correlation was calculated to find
(a)
(b)
(c)
(d)
FIGURE 2RAPD profile from primer OPB-10 (a) genotypes number 1-24, (b) genotypes number 25-48, (c) genotypes number 49-72 and (d) genotypes number 73-96.
per-formed by GenAlex 6.3 to identify any genetic association among the genotypes and visualize the genetic distance between individual in two hierarchies as two steps. First, a primary PCoA was conducted at individual and family level. Second PCoA was then conducted for each cluster obtained from the primary PCoA. In addition, Unweighted Pair Group Method with Arithmetic Mean (UPGMA) clus-tering were performed with the program NTSYS-pc ver-sion 2.02 (Rohlf 2000), based on pairwise Nei’s unbi-ased genetic identity (Nei 1972) calculated between family with GenAlEx (Peakall and Smouse 2006).
3. Results and discussion
3.1. RAPD fragment
The amplification of PCR-RAPD with eleven primers pro-duced 82 patterns of DNA bands (Table 1). The high-est diversity in DNA band patterns was resulted from primers of OPB-10 (5 polymorphic) and OPB-03 (3 poly-morphic), OPY-06 (3 polymorphic) patterns, respectively, while lowest diversity in DNA band patterns was resulted from primer of OPY-11 and OPY-14 (1 polymorphic) pat-terns respectively. RAPD used differences in the pattern of PCR amplification generated form differences in its at-taching position of primers at genome DNA from the dif-ferent individuals. The difference in DNA band pattern was because of the amplification of DNA sequence at cer-tain positions (Weeden et al. 1992). Differences in base pairs (bp) in the DNA sequence cause amplification not to be performed due to incompatibility between the primer and complementary DNA sequences.
RAPD analysis can be used to determine and recog-nize the characteristics of genetic diversity between plant genotypes, and the genetic diversity can be seen in DNA polymorphism (Wang et al. 2010). The mean genetic di-versity between surian progeny (He) was categorized as moderate (0.304). This level of variation was corroborated by other variables such as percentage of polymorphic loci
(PPL), ranging 18.2–50% with an average of 30.5%. The PPL value in this study was higher than previous RAPD studies of T. sinensisin West Java (Hidayat and Siregar 2011) andToona ciliatain China (Li et al. 2015), but lower than one ofT. sinensisin China (Wang et al. 2008).
Among the 96 individual being tested there are several factors that affect the level of genetic diversity of a species within a population source, such as effective size of pop-ulation, mutation, genetic drift, migration, mating system, selection and production of flower and pollen (Lemes et al. 2003;Finkeldey and Hattemer 2005). The moderate level of genetic diversity of T. sinensis at progeny test could be as a consequence of a small population size, this situa-tion have been proved byT. sinensis(Hidayat and Siregar 2011),T. ciliata(Wang et al. 2008) andMelia azedarach (Yulianti 2011). The small population size also can in-crease the possibility of genetic drift, which will reduce the genetic diversity as a result of bottlenecking and in-breeding (Lorenz 2012). Other genetic parameter being measured was value of expected heterozygosity (He) with the value of Hewas 0.304. This He value in this study was similar to those of T. ciliatain China (He 0.305 in Liu et al.(2014); He 0.378 inLi et al.(2015)),T. sinensisin West Java (He 0.240) andT. sinensisin China (He 0,333 inWang et al.(2008)).
3.2. Gene c rela onship and clustering analysis
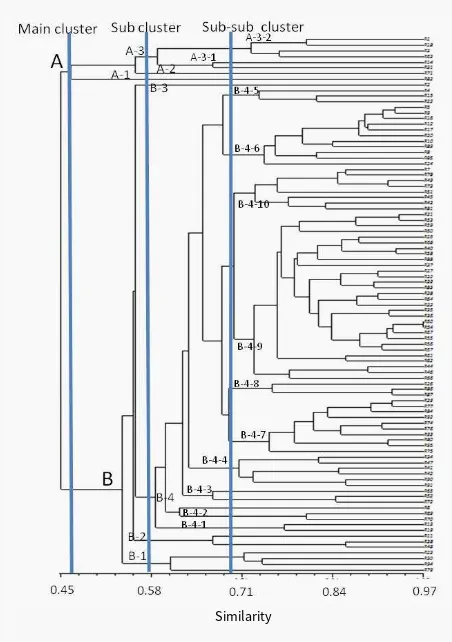
A dendrogram based on the similarity index values was generated using UPGMA. As Figure 3shows, the resul-tant dendrogram was separated into 2-main clusters at ge-netic similarity coefficient of 0.46 and 7-sub clusters at genetic similarity coefficient of 0.56. Sub cluster III/A-3 was separated into two sub-sub clusters at genetic simi-larity coefficient of 0.580 with sub-sub cluster III/A-3-1 (consisted of 2 family) and III/B-3-2 (consisted of 4 in-dividuals). Sub cluster V was separated into two sub-sub clusters at genetic similarity coefficient of 0,592 with sub-sub cluster 1 (consisted of 2 family),
V/B-2-TABLE 1Number of RAPD fragment, fragment size, and number of polymorphic fragment from each primer to be used. Primer Sequence (5’-3’) G+C Composi on (%) Fragment
number Polymorphicfragment Percentage (%) Fragment size (Base Pair/bp)
OP-B3 CATCCCCCTG 70 10 3 30 300, 600, 800
OP-B4 GGACTGGAGT 60 4 2 50 400, 650
OP-B10 CTGCTGGGAC 70 11 5 45.5 340, 350, 500, 620, 680
OP-H3 AGACGTCCAC 60 4 2 50 500, 800
OP-Y6 AAGGCTCACC 60 9 3 33.3 380, 700, 900
OP-Y7 AGAGCCGTCA 60 9 2 22.2 450, 700
OP-Y8 AGGCAGAGCA 60 11 2 18.2 500, 650
OP-Y10 CAAACGTGGG 60 7 2 28.6 500, 700
OP-Y11 AGACGATGGG 60 6 1 16.7 380
OP-Y14 GGTCGATCTG 60 7 1 14.3 500
Similarity
FIGURE 3 UPGMA-dendogram of gene c similarity among 96 Toona sinensisindividuals of progeny test base on RAPD Data.
2 (consisted of 3 individuals from 3 family). Sub clus-ter VII/B-4 consisted of 10 sub-subclusclus-ters are VII/B-4-1 (consisted of 3 individuals), VII/B-4-2 (consisted of 3 indi-viduals), VII/B-4-3 (consisted of 6 indiindi-viduals), VII/B-4-4 (consisted of 30 individuals), VII/B-4-5 (consisted of 8 in-dividuals), 4-6 (consisted of 3 inin-dividuals), VII/B-4-7 (consisted of 11 individuals), VII/B-4-8 (consisted of 10 individuals), VII/B-4-9 (consisted of 3 individuals) and Sub clusterVII/B-4-10 (consisted of 2 individuals).
Based on the dendrogram (Figure 3), the grouping was not in accordance with family and population. The group-ing of several individual trees did not indicates that fam-ily distance is closer, but more to its genetic similarity. It shows genetic diversity in the individual of surian, being possibly caused by the recombination of genes. Accord-ing toÇengel et al.(2012), the grouping based on the ge-ographic positions taken place because the RAPD marker indicates DNA variation, both in coding and non-coding regions. Moreover, RAPD property was not reproducible to get an accurate grouping. The same result was shown from previous study on some family of surian in West Java (Hidayat and Siregar 2011), where the formed pattern of grouping did not show the grouping based on the region of origin (sampling location). In this study indicates that there are several individual trees originating form the same family do not form single group but are scattered in
sev-eral group. its was different with data reported bySong
(2000), indicating that the grouping was generally appro-priate with its geographic region of origin. Result of the analysis on the genetic relatedness of individual progeny test of surian and the RAPD approach showed that mix in-dividual from a were grouped as several sub cluster and sub-sub cluster.
In this study showed that there is no spesific allel, num-ber of different alleles observed (na = 1.725), numnum-ber of effective alleles (ne = 1.533), Shannon’s information in-dex (I = 0.449), expected heterozygosity (He = 0.304), and unbiased expected heterozygosity (UHe = 0.318). Genetic distance (Nei 1972) showed 0.002 to 0.161 with the aver-age value was 0.069. The value of similarity showed 0.998 to 0.847 with average value 0.935. The value genetic dis-tance of among surian in progeny test was lowest than genetic distance of T. sinensis(Meliaceae) in West Java (0.440 in (Hidayat and Siregar 2011) andM. azedarach (Meliaceae) in West Java (0.192 inYulianti(2011)).
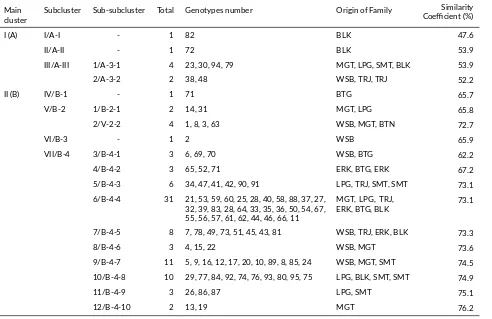
Based on Table2, there were 7 sub clusters and 14 sub-sub clusters which has the biggest sub-sub cluster VII have the number 79 individual. Sub-sub clusters 6/B-4-4 have 31 individuals, followed by sub-sub cluster 9/B-4-7 with 11 individuals and sub-sub cluster 10/B-4-8 with 10 individ-uals, which all individuals that compose is a cross family. Selection is based on sub-sub cluster is quite important to be considered for individual which are distributed in sub-sub clusters have a genetic similarity.
3.3. Gene c relatedness based on RAPD
The use of Jaccard’s similarity coefficient to estimate ge-netic relatedness among accessions gave similarity value ranging from 0.43 to 0.97 that mean genetic similarity between the major clusters ofToona sinensisindividual ranged from 43% to 97%, as shown in Figure 4. This coef-ficient genetic similarity in this study was similar to those of Pinus sylvestrisprogeny range 0.69 to 0.94 (Cipriano et al. 2013). For comparison study on Melia azedarach in community forest founded that the similarity index values of 0.02-0.65, indicating a small genetic variation among the family (Yulianti 2011).
The high level of similarity among the individuals of surian was because the plants of surian individual origi-nated from small population scattered in the community forest. Other possibility was the event of cross-pollination because the plants of surian were annual plants whose exis-tence was still in community forest. Principle components analysis was used to identify the most significant variable in the data set. The result indicated that the first compo-nent explain about 45.16% of the total variability observed, where by the second accounted for 25.54%.
TABLE 2Cluster membership of variousToona sinensisprogeny test.
Main
cluster Subcluster Sub-subcluster Total Genotypes number Origin of Family
Similarity Coefficient (%)
I (A) I/A-I - 1 82 BLK 47.6
II/A-II - 1 72 BLK 53.9
III/A-III 1/A-3-1 4 23, 30, 94, 79 MGT, LPG, SMT, BLK 53.9
2/A-3-2 2 38, 48 WSB, TRJ, TRJ 52.2
II (B) IV/B-1 - 1 71 BTG 65.7
V/B-2 1/B-2-1 2 14, 31 MGT, LPG 65.8
2/V-2-2 4 1, 8, 3, 63 WSB, MGT, BTN 72.7
VI/B-3 - 1 2 WSB 65.9
VII/B-4 3/B-4-1 3 6, 69, 70 WSB, BTG 62.2
4/B-4-2 3 65, 52, 71 ERK, BTG, ERK 67.2
5/B-4-3 6 34, 47, 41, 42, 90, 91 LPG, TRJ, SMT, SMT 73.1
6/B-4-4 31 21, 53, 59, 60, 25, 28, 40, 58, 88, 37, 27, 32, 39, 83, 28, 64, 33, 35, 36, 50, 54, 67, 55, 56, 57, 61, 62, 44, 46, 66, 11
MGT, LPG, TRJ,
ERK, BTG, BLK 73.1
7/B-4-5 8 7, 78, 49, 73, 51, 45, 43, 81 WSB, TRJ, ERK, BLK 73.3
8/B-4-6 3 4, 15, 22 WSB, MGT 73.6
9/B-4-7 11 5, 9, 16, 12, 17, 20, 10, 89, 8, 85, 24 WSB, MGT, SMT 74.5 10/B-4-8 10 29, 77, 84, 92, 74, 76, 93, 80, 95, 75 LPG, BLK, SMT, SMT 74.9
11/B-4-9 3 26, 86, 87 LPG, SMT 75.1
12/B-4-10 2 13, 19 MGT 76.2
Notes: SMT (Sumatera Utara), LPG (Lampung), WSB (Wonosobo), MGT (Magetan), BTG (Bantaeng), BLK (Bulukumba), ERK (Enrekang), TRJ (Tanatoraja).
components was be able to explain the accumulative vari-ation of 70.70%. Base on principal component is used to review describes patterns of diversity and relationships among individual plants of surian.
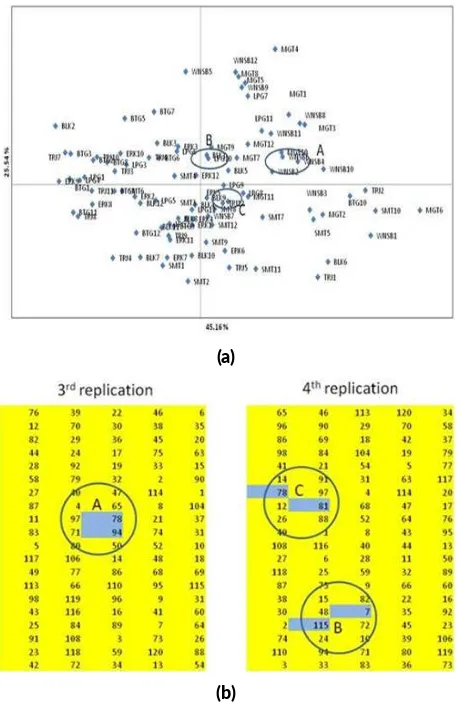
The relationships between individual surian tested are shown in scattered matrix principal components divided being four quadrants. Individuals trees (code as given in Table2and Figure4) in the same quadrant that shows the nearer genotype but if located in different quadrant that indicating a genotype has relationship away. The scattered matrix (Figure 4a) showed the individual trees of different family distributed and overlapped in one quadrant have nearest genotype or have a close relationship.
The information from PCoA analysis is then used to review the placement maps of families in progeny test orig-inally arranged based on randomization to separate fam-ilies from adjacent sites without being equipped genetic information. Ideally, the family distribution map in the progeny test is capable of separating families with genetic proximity but in the 3rdreplication plot there are still fami-lies located adjacent to 78 and 94 (Figure 4b, A) and at 4th replication families 78 and 81 (Figure 4b, C) and families 115 and 7 (Figure 4b, A). The role of genetic information to manage the layout of family placement in progeny test is essential to be involved for next period.
3.4. Implica on and recommenda on for designing the breeding strategy
Our results emphasized that basically genetic diversity is the foundation for maintaining genetic evolutionary pro-cesses of T. sinensis. Hence, to define breeding strat-egy, our main recommendation is in maintaining those pro-cesses within the family and the origin population as the genetic base in progeny test. Genetic diversity is a funda-mental tenet of the conservation ethic, and that genetic di-versity is an important consideration when managing for-est stands, ecosystem and landscapes (Libby 1973).Yet, the extent and distribution of genetic diversity are precon-ditions for the adaptation that determines the long-term sta-bility of individual species and entire ecosystems (Vellend and Geber 2005).
(a)
(b)
FIGURE 4Comparison sca ered distribu on of 96 Individual of Toona sinensisbased on PCoA Analysis using 11 RAPD Primers (a) and layout placement family at progeny test (b).
to provide an improved population of trees from which the next generation of select trees is made. Tree families es-tablished in progeny tests are randomized and replicated in a designed manner to meet statistical and genetic crite-ria. Families are planted in several sites and in more than one year to sample an adequate number of environmental conditions. T. sinensistree progeny tests are intensively managed similarly to a typical industrial forest plantation. Growth and quality measurements are made periodically in these tests until harvest. These data are entered into a data base and analyzed. The results are used to assess the genetic worth of the original selections, to make selections for the next generation and to make recommendations for establishing and upgrading seed and hedge orchards.
In order to determine whether the genetic diversity in maternal populations is transmitted to progeny popula-tions and how much its value is recommended to test the seeds derived from the progeny test in the next phase. De-ring and Chybicki(2012) reported gene diversity progeny decrease by 3.73% but increase by 1.26% in plantation. Based on the previous information it is necessary to con-duct research activities to complete the basic information for improvement to breeding programme include 3 steps.
First to identify changes in genetic diversity from last year to the next Second to determining the number of individ-ual tree which will represent families or populations in the progeny test. Third to corrected assignment of progeny to half-sib families based on genotypic information would to change result assessment of family rank for growth and quality traits. We recommend that assessment of growth traits be based on qualitative and quantitative traits based on genetic test data to accurately rank families and popu-lations. The next activity is to compare the average value of the individual genotype with the progeny test map at the time of planting base on phenotypic trait. The low-est variation in subsequent generations might result from the reduction in effective population size as well. The es-timated effective population size was studied at progeny plantation.
For genetic diversity ofT. sinensisfound in this study has two recommend. First to evaluated in terms of ge-netic gain expected for traits of importance, usually over a period of time. Second to evaluated mating system ofT. sinensispopulations expected gain could be utilised by a proposed selection and propagation system. Several long-term breeding strategies are now available, which are de-signed to retain sufficient genetic variability to counter act the risks of inbreeding in future generations. Mating pat-tern could be utilised by a proposed management breeding strategy. In recent years, different strategies and methods have been proposed and used to widen the genetic base of breeding populations for long-term breeding. In addi-tion, efforts should also to get quality resource ofT. sinen-siswe proposed to establishment of seed production areas from progeny test conversion is featured as the most ef-fective and time-efficient strategy for short-term improve-ment. For long-term sustainable tree production as well as quality seed yield, seed orchards are suggested.
4. Conclusions
Acknowledgments
This study was part of a long-term research on Toona spp. Genetic Conservation and Improvement, supported by the Centre for Forest Biotechnology and Tree Improve-ment Research and DevelopImprove-ment (Balai Besar Penelitian dan Pengembangan Bioteknologi dan Pemuliaan Tana-man Hutan, BBPPBTH). Wahyunisari, Maryatul Qiptiyah (assistance laboratory works in the Molecular Genetics Laboratory-BBPPBTH), ILG Nurcahyaningsih, AYPBC Widyatmoko (providing advice in the analyses). Many thanks go to all the team of the Molecular Genetic Lab-oratory for their excellent technical assistance.
Authors’ contribu ons
J, IN, SI, MN, EBH designed the study. J, IN carried out the laboratory work. J, IN analyzed the data. J, IN wrote the manuscript. IN, SI, MN, EBH proofread the manuscript. J, SI, MN, EBH, IN have read and approved the final version of the manuscript.
Compe ng interests
The authors declare no competing interest.
References
Bharmauria V, Narang N, Verma V, Sharma S. 2009. Ge-netic variation and polymorphism in the Himalayan nettle plantUrtica dioicabased on RAPD marker. J Med Plants Res. 3:166–170.
Çengel B, Tayanç Y, Kandemir G, Velioglu E, Alan M, Kaya Z. 2012. Magnitude and efficiency of ge-netic diversity captured from seed stands of Pinus nigra(Arnold) subsp.pallasianain established seed orchards and plantations. New Forests 43:303–317. doi:10.1007/s11056-011-9282-8.
Cipriano J, Carvalho A, Fernandes C, Gaspar MJ, Pires J, Bento J, Roxo L, Louzada J, Lima-Brito J. 2013. Evaluation of genetic diversity of PortuguesePinus sylvestrisL. populations based on molecular data and inferences about the future use of this germplasm. J Genet. 92:e41–48.
Collignon AM, Sype HVd, Favre JM. 2002. Geographical variation in random amplified polymorphic DNA and quantitative traits in Norway spruce. Can J For Res. 32:266–282. doi:10.1139/x01-198.
Dering M, Chybicki I. 2012. Assessment of genetic diversity in two-species oak seed stands and their progeny populations. Scand J For Res. 27:2–9. doi:10.1080/02827581.2011.631934.
Edmonds JM, Staniforth M. 1998. Plate 348.Toona sinen-sis. Curtis’s Bot Mag. 15:186–193. doi: 10.1111/1467-8748.00169.
El-Kassaby YA, Cappa EP, Liewlaksaneeyanawin C, Klápště J, Lstibůrek M. 2011. Breeding
with-out breeding: is a complete pedigree necessary for efficient breeding? PLOS ONE 6:e25737. doi:10.1371/journal.pone.0025737.
El-Kassaby YA, Lstibůrek M. 2009. Breeding with-out breeding. Genet Res. (Camb) 91:111–120. doi:10.1017/S001667230900007X.
Finkeldey R, Hattemer HH. 2005. Pengantar genetika hutan. Bogor: ASEAN-EU University Network Pro-gramme (AUNP) Fakultas Kehutanan IPB. Transla-tion of: Tropical Forest Genetics.
Gaspar MJ, Louzada JL, Silva ME, Aguiar A, Almeida MH. 2008. Age trends in genetic parameters of wood density components in 46 half-sibling families of Pinus pinaster. Can J For Res. 38:1470–1477. doi:10.1139/X08-013.
Hidayat H, Siregar IZ. 2011. Preliminary evaluation on ge-netic variation of two year old surian (Toona sinensis Roem) progeny test assessed by rapd marker.
Kimura T, Yagi M, Nishitani C, Onozaki T, Ban Y, Ya-mamoto T. 2009. Development of SSR markers in carnation (Dianthus caryophyllus). J Jpn Soc Hortic Sci. 78:115–123.
Lemes MR, Gribel R, Proctor J, Grattapaglia D. 2003. Population genetic structure of mahogany (Swietenia macrophylla King, Meliaceae) across the Brazilian Amazon, based on variation at microsatellite loci: im-plications for conservation. Mol Ecol. 12:2875–2883. Li P, Zhan X, Que Q, Qu W, Liu M, Ouyang K, Li J, Deng X, Zhang J, Liao B, Pian R, Chen X. 2015. Ge-netic diversity and population tructure ofToona cili-ataRoem. based on sequence-related amplified poly-morphism (SRAP) markers. Forests 6:1094–1106. doi:10.3390/f6041094.
Libby WJ. 1973. Domestication strategies for forest trees. Can J For Res. 3:265–276. doi:10.1139/x73-036. Liesebach H, Yang MSY, Schneck V. 2004. Genetic
di-versity and differentiation in a black locust (Robinia pseudoacaciaL.) progeny test. Int J For Gen. 11:151– 161.
Liu J, Jiang JM, Chen YT. 2014. Genetic diversity of central and peripheral populations of Toona cili-ata var. pubescens, an endangered tree species en-demic to China. Genet Mol Res. 13:4579–4590. doi:10.4238/2014.June.17.10.
Lorenz TC. 2012. Polymerase chain reaction: basic pro-tocol plus troubleshooting and optimization strategies. J Vis Exp. 63:3998. doi:10.3791/3998.
Lynch M, Milligan BG. 1994. Analysis of population ge-netic structure with RAPD markers. Mol Ecol. 3:91– 99.
Muona O. 1990. Population genetics in forest tree im-provement. In: AHD Brown, MT Clegg, AL Kahler, BS Weir, editors. Plant population genetics, breeding, and genetic resources. Sunderland, Massachusetts: Sinauer Associates Inc.. p. 282–298.
Nei M. 1972. Genetic distance between populations. Am Nat. 106:283–292.
Nosrati H, Hosseinpour-Feizi MA, Nikniazi M, Razban-Haghighi A. 2012. Genetic variation among different accessions ofLathyrus sativus(Fabaceae) revealed by RAPDs. Bot Serbica 36:41–47.
Peakall R, Smouse PE. 2006. GENALEX 6: genetic analysis in excel. population genetic software for teaching and research. Mol Ecol Notes 6:288–295. doi:10.1111/j.1471-8286.2005.01155.x.
Pennington TD, Styles BT. 1975. A generic monograph of the Meliaceae. Nationaal Herbarium Nederland- Uni-versiteit Leiden branch.
Pramono AA, Danu, Rohandi A, Royani H, Abidin AZ, Supardi E, Nurokhim N. 2008. Distribution of poten-tial seed sources of potenpoten-tial surian types in Java. LHP No. 498. Bogor: Research Institute for Seeding Tech-nology.
Rohlf F. 2000. NTSYS-pc - Numerical taxonomy and mul-tivariate analysis system version 2.0. New York: Ap-plied Biostatistics Inc.
Runo MS, Muluvi GM, Odee DW. 2004. Analysis of genetic structure inMelia volkensii(Gurke.) popula-tions using random amplified polymorphic DNA. Afr J Biotechnol. 3:421–425.
Sambrook J, Fritsch EF, Maniatis T. 1989. Molecular cloning: a laboratory manual.. 2nd edition. Cold Spring Harbor, NY: Cold Spring Harbor Laboratory Press.
Shiraishi S, Watanabe A. 1995. Identification of chloro-plast genome betweenPinus densifloraSieb. et Zucc. andP. thunbergiiParl. based on the polymorphism in rbcL gene. J Jpn For Soc. 77:429–436.
Silveira SR, Ruas PM, Ruas CdF, Sera T, Carvalho VdP, Coelho ASG. 2003. Assessment of genetic variabil-ity within and among coffee progenies and cultivars using RAPD markers. Gen Mol Biol. 26:329–336. doi:10.1590/S1415-47572003000300018.
Song B. 2000. Genetic relatedness amongLansium do-mesticumaccessions using RAPD markers. Ann Bot. 86:299–307. doi:10.1006/anbo.2000.1186.
Tavares R, Viana AP, Barroso DG, Júnior A, Do AT. 2012. Genetic diversity in Australian Cedar genotypes se-lected by mixed models. Cienc Agrotecnol. 36:171– 179. doi:10.1590/S1413-70542012000200005. Tingey SV, Rafalski JA, Hanafey MK. 1994. Genetic
anal-ysis with RAPD markers. In: Plant molecular biol-ogy. NATO ASI Series. Berlin: Springer. p. 491–500. doi:10.1007/978-3-642-78852-9_45.
Vellend M, Geber MA. 2005. Connections between
species diversity and genetic diversity. Ecol Lett. 8:767–781. doi:10.1111/j.1461-0248.2005.00775.x. Wang BY, Shi L, Ruan ZY, Deng J. 2010. Genetic
diver-sity and differentiation inDalbergia sissoo(Fabaceae) as revealed by RAPD. Gen Mol Res. 10:114–120. doi:10.4238/vol10-1gmr995.
Wang C, Cao J, Tian S, Wang Y, Chen Z, Chen M, Gong G. 2008. Germplasm resources research of Toona sinensiswith RAPD and isoenzyme analysis. Biolo-gia 63:320–326. doi:10.2478/s11756-008-0066-3. Wee AKS, Li C, Dvorak WS, Hong Y. 2012. Genetic
diversity in natural populations of Gmelina arborea: implications for breeding and conservation. New For. 43:411–428. doi:10.1007/s11056-011-9288-2. Weeden NF, Timmerman GM, Hemmat M, Kneen BE,
Lodhi MA. 1992. Inheritance and reliability of RAPD markers. In: Application of RAPD technology to plant breeding. Crop Science Society of America. Madison: Joint Plant Breeding Symposia Series. p. 12—17. Weising K, Nybom H, Pfenninger M, Wolff K, Meyer W.
1994. DNA Fingerprinting in Plants and Fungi. CRC Press.
Williams JG, Kubelik AR, Livak KJ, Rafalski JA, Tingey SV. 1990. DNA polymorphisms amplified by arbitrary primers are useful as genetic markers. Nucleic Acids Res. 18:6531–6535.
Xing PY, Liu T, Song ZQ, Li XF. 2016. Genetic di-versity of Toona sinensis Roem in China revealed by ISSR and SRAP markers. Genet Mol Res. 15. doi:10.4238/gmr.15038387.
Ye GN, Hemmat M, Lodhi MA, Weeden NF, Reisch B. 1996. Long primers for RAPD mapping and finger-printing of grape and pear. BioTechniques 20:368– 371.
Yulianti Y. 2011. Genetic variation of Melia
azedarach in community forests of West Java
assessed by RAPD. Biodiversitas 12:64–69. doi:10.13057/biodiv/d120202.
Zarek M. 2009. RAPD analysis of genetic structure in four natural populations ofTaxus baccatafrom south-ern Poland. Acta Biol Cracov Ser Bot. 51:67–75. Zhou GX, Zhang BG, Lin L, Qin Z, Lin G, Ya-Yun P, Xia
C. 2010. Study on the relationship between Toona sinensisRoem stand productivity and site conditions in Sichuan Basin. Ecol Econ. 6:387–394.