ORIGINAL ARTICLE
Effects of changes in the soil environment associated with heavy
precipitation on soil greenhouse gas fluxes in a Siberian larch forest
near Yakutsk
Takahiro KOIDE
1, Hideyuki SAITO
2, Tetsuoh SHIROTA
3, Go IWAHANA
4,
M. Larry LOPEZ C.
5, Trofim C. MAXIMOV
6, Shuichi HASEGAWA
2and
Ryusuke HATANO
21Graduate School of Agriculture and,2Research Faculty of Agriculture, Hokkaido University, Sapporo 060-8589,3Faculty of Agricul-ture, Shinshu University, Nagano 399-4598,4Graduate School of Environmental Science, Hokkaido University, Sapporo 060-0810, 5United Graduate School of Agricultural Sciences, Iwate University, Morioka 020-8550, Japan, and6Institute for Biological Problems of Cryolithozone, Siberian Branch, Russian Academy of Science, Yakutsk 677980, Russia
Abstract
A future increase in heavy precipitation events is predicted in boreal regions. An irrigation experiment was con-ducted in Taiga forest in eastern Siberia to evaluate the effect of heavy precipitation on greenhouse gas ([GHG] CO2, CH4, and N2O) fluxes in the soil. The GHG fluxes on the soil surface were measured using a
closed-cham-ber method and GHG production rates in the mineral soil were estimated using the concentration–gradient method based on Fick’s law. Irrigation water (20 mm day)1) was applied continuously for 6 days (120 mm in total; the same amount as summer precipitation in this region). Greenhouse gas production rates in the organic layer (O-layer) were defined as the difference between the GHG fluxes and the GHG production rates in the mineral soil. Carbon dioxide flux was measured both in root-intact (Rs) and trenched plots (Rmw). The root res-piration rate (Rr) was calculated as the difference betweenRsandRmw. Considering the root distribution in the soil, we regarded the CO2production rate in the mineral soil to be the microbial respiration rate in the mineral
soil (Rmm) and microbial respiration rate in the O-layer (Rmo) as the difference betweenRmwandRmm. Irrigation increased both soil temperature and moisture in the irrigated plot. TheRs, CH4flux and N2O flux during the
irrigation period were higher in the irrigated plot than that in the non-irrigated plot (P< 0.05; meanRs± stan-dard deviation [SD] (mg C m)2h)1) were 171 ± 20 and 109 ± 11, mean CH
4flux ± SD (lg C m)2h)1) were
)5.4 ± 4.1 and)14.0 ± 6.5, and mean N2O flux ± SD (lg N m)2h)1) were 1.6 ± 1.6 and 0.2 ± 1.1, respec-tively). Soil moisture had a positive effect onRmmand CH4production rate in the O-layer, a negative effect on
Rr, and did not affectRmo, the CH4production rate in the mineral soil or the N2O production rates in both the
O-layer and the mineral soil. Soil temperature had a positive effect on RrandRmo. The increment of global warming potential of the soil mainly resulted from an increase in microbial respiration rates. Future changes in precipitation patterns in this region would accelerate decomposition of the soil organic matter.
Key words: Fick’s law, greenhouse gas, irrigation, Siberian Taiga, trenching method.
INTRODUCTION
Forests in Russia contain 381 Pg of carbon (C), which accounts for 54% of the total C stock in forests in the northern hemisphere (Goodaleet al.2002), and play an important role as a C sink. Taiga forest near Yakutsk in
eastern Siberia lying on permafrost keeps the soil tempera-ture low (Eugsteret al.2000), and the decomposition rate *of soil organic matter is very slow (Rodionow et al.
2006). In addition, the amount of precipitation in this region is very low (Japan Meteorological Agency 2004).
The Intergovernmental Panel on Climate Change (IPCC 2007) predicts that an increase in air temperature, in the amount of precipitation and in heavy precipitation events will occur in the permafrost region as a result of global warming caused by an increase in the concentration of greenhouse gases (GHGs). In Siberia, heavy precipitation
Correspondence: T. KOIDE, Graduate School of Agriculture, Hokkaido University, N9 W9, Sapporo 060-8589, Japan. Email: [email protected]
events exceeding 20 mm day)1 significantly increased during 1936–1994 (Easterlinget al.2000). An increase in air temperature will accelerate the growth of vegetation and increase the C storage of biomass and litter (Sirotenko and Abashina 2008). In contrast, increased soil tempera-ture accompanied by thawing of permafrost will acceler-ate the decomposition racceler-ate of soil organic matter, enhancing global warming (Rodionow et al.2006). It is still unknown what effects a change in precipitation pat-tern will have on the plant growth rate and the decompo-sition rate of soil organic matter in this region.
Many field studies have shown that precipitation or irri-gation on dry soil increased the rate of soil respiration owing to an increase in soil moisture (e.g. Millardet al.
2008). Oberbaueret al.(1992) reported that precipitation events that raised the water table were found to strongly reduce soil respiration in the permafrost region in Alaska. However, very few studies have attempted to divide the effect of precipitation on soil respiration into microbial respiration and root respiration, which are the compo-nents of soil respiration (Bond-Lamberty et al. 2004). Dividing soil respiration is important to evaluate the effect of heavy precipitation on plant physiology and the decom-position rate of soil organic matter. Previous studies observed large increases in root and microbial respiration as a result of adding water to dry soil (e.g. Borkenet al.
2003; Millardet al.2008). However, the response of root and microbial respiration to heavy precipitation in the permafrost region is not clear.
In the permafrost region, heavy precipitation would affect not only the CO2flux from the soil, but also the
exchange of the GHGs CH4and N2O. In general, natural
oxic soil absorbs CH4(Potter et al. 1996). Striegl et al.
(1992) reported that precipitation on dry soil increased CH4consumption by the soil. Liuet al.(2008) reported
that CH4fluxes showed little difference between irrigated
and non-irrigated soils in an Inner Mongolian steppe soil. van Huisstedenet al.(2008) reported that CH4
consump-tion in a forest near Yakutsk remained stable even when the water table fluctuated from 9 to 27 cm. This indicates that methanotrophs occur in the uppermost soil and fluc-tuations in soil moisture do not affect CH4consumption
in the forests of this region.
Very few studies have reported the effect of precipita-tion on N2O emission from boreal forests. Rodionow
et al.(2006) reported that emission of N2O is negligible
from natural Siberian soils. Forest soils near Yakutsk emit or absorb little N2O (Morishitaet al.2007; Takakaiet al.
2008). Duet al.(2006) reported that N2O emission was
stimulated by precipitation events in natural grassland in Inner Mongolia.
The purpose of the present study was to evaluate the effect of heavy precipitation on GHG fluxes from soil in Taiga forest near Yakutsk by conducting an irrigation
experiment. In the present study, we measured GHG pro-duction rates both in the O-layer and in the mineral soil, and microbial respiration and root respiration separately to evaluate the effect of precipitation on the global warm-ing potential of the soil in this ecosystem in detail.
MATERIALS AND METHODS
Site description
The present study was conducted during July 2004 in a 180-year-old larch forest on sandy loam soil underlain by permafrost (Typic Haploturbels; Soil Survey Staff 2010) in the Spasskaya-Pad experimental forest (6215¢N, 12937¢E) of the Institute for Biological Problems of Cryo-lithozone, near Yakutsk, Russia. The site is located on a gently sloped (1–2decline toward north) terrace approxi-mately 200 m in elevation situated on the left bank of the Lena River. The mean annual temperature is )10.0 C
and the mean annual precipitation is approximately 237 mm (Japan Meteorological Agency 2004). The amount of precipitation in 2004 preceding the experiment was lower than the mean precipitation for 30 years (Fig. 1), indicating that the forest floor was relatively dry during the experiment. The forest is mainly occupied by larch trees (Larix cajanderi). The forest floor is covered by shrubby vegetation, including Vaccinium vitis-idaea and
Arctous erythrocarpa, and by a thick 10 cm organic layer (O-layer).
The amount of precipitation from 17 June to 26 July 2003 was recorded using a rain gauge (Young, Traverse, Michigan, USA) placed at the top of a 32-m high scaffold-ing tower built by Ohtaet al.(2001).
Layout of the experimental plots
An irrigated plot and a non-irrigated plot of the same size (14 m·14 m) were established. The non-irrigated plot was established in an area more than 50 m apart from the irrigated plot and was not affected by the irrigation (Fig. 2). Four subplots, measuring 0.16 m2, were set up in spring 2003 in each irrigated and non-irrigated plot. Around each subplot, the outside edges of the 0.16 m2 were trenched. The trenches were approximately 30 cm deep into the soil, which is deep enough to prevent the invasion of roots of Siberian larch; we estimated from our soil profile examination that approximately 97% of fine roots (<2 mm in diameter) are distributed within the)10
to 26 cm depth of the soil (Table 1; Ono 2003). The trenches were lined with plastic sheets before backfilling to prevent root growth. The above-ground parts of all vegetation were removed from the trenched plots.
approximately 1.5 m. Irrigation of 20 mm per day was conducted every day and a total of 120 mm of irrigation water was applied. The amount of irrigation was approxi-mately equal to the average amount of natural precipita-tion, including heavy precipitation events, during the summer season (June–September). Lena River water was
used for the irrigation and the temperature of the irrigated water was approximately 15C.
Field measurements
The CO2fluxes from the surface of the O-layer (Rs) were measured using a closed-chamber method (Kusa et al.
2008; Morishita et al.2005, 2006, 2007; Takakaiet al.
2008) from 1 to 23 July 2004. To measureRs, including root and microbial respiration, four stainless steel cylin-ders, approximately 20 cm in diameter and 25 cm height, were installed at a depth of 4 cm into the soil both in the irrigated and non-irrigated plots at least 24 h before measurement. The above-ground parts of all plants inside the cylinders were removed carefully to exclude plant respiration. Before beginning the measurements, an air sample inside the cylinder was transferred to a Tedlar bag (OMI Odorair Service, Shiga, Japan) as a 0-min sample, and an acrylic lid with silicone gasket and an inflatable plastic bag to adjust the air pressure inside the chamber was placed on the cylinder immediately. Six minutes later, a 500 mL air sample from inside the chamber was taken out. Each chamber remained open for more than 10 min after completion of the CO2 flux measurement to allow
for a complete exchange of air inside the chamber. Gas samples were then taken to measure CH4and N2O fluxes Figure 1 Seasonal variation in air temperature and precipitation
in Yakutsk. Open and closed circles indicate the average air tem-perature for each month over 30 years and in 2004, respectively. Open and closed bars indicate the average precipitation for each month over 30 years and the amount of precipitation for each month in 2004, respectively.
Figure 2 Location map of the study site and the layout of the measurement plots. Microbial respiration in the whole soil was measured in the trenched plots. Fluxes and concentrations of greenhouse gases in soil air were measured near the trenched plots.
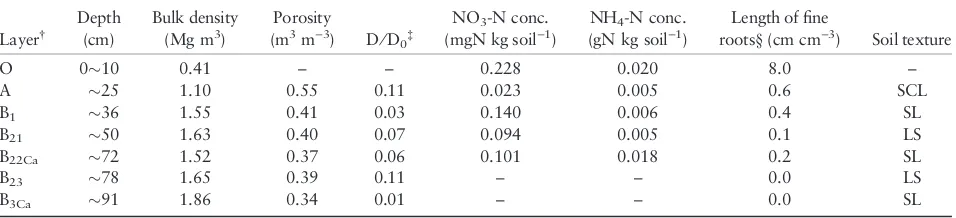
Table 1 Soil physical and chemical properties at the study site
Layer†
Depth (cm)
Bulk density (Mg m3)
Porosity
(m3m)3) D⁄D
0‡
NO3-N conc.
(mgN kg soil)1)
NH4-N conc.
(gN kg soil)1)
Length of fine
roots§(cm cm)3) Soil texture
O 010 0.41 – – 0.228 0.020 8.0 –
A 25 1.10 0.55 0.11 0.023 0.005 0.6 SCL
B1 36 1.55 0.41 0.03 0.140 0.006 0.4 SL
B21 50 1.63 0.40 0.07 0.094 0.005 0.1 LS
B22Ca 72 1.52 0.37 0.06 0.101 0.018 0.2 SL
B23 78 1.65 0.39 0.11 – – 0.0 LS
B3Ca 91 1.86 0.34 0.01 – – 0.0 SL
†O, O-layer (thickness of the O-layer was 10 cm); A and B, Mineral soil layers (with organic matter and illuviation, respectively); Ca, accumulation of
carbonate.‡D⁄D
0, gas tortuosity factor.§Length of fine roots (<2 mm in diameter) was calculated after Ono (2003). SCL, sandy clay loam; SL, sandy
on the surface of the O-layer. At 0, 30 and 60 min after the top of the chamber was again closed with a lid, a 20 mL gas sample from inside the chamber was taken into a 10 mL vacuum vial and the vial was sealed with a butyl rubber stopper (SVF-10; Nichiden-Rika, Kobe, Japan).
One stainless steel cylinder was installed into the middle of each trenched plot in both the irrigated and non-irri-gated plots in four replicates to measure the rate of microbial respiration in the whole soil (Rmw). The mea-surements were carried out on the same day as the gas sampling. The procedure for measuringRmwwas the same as that used to measure CO2.
Stainless steel pipes, 9 mm in diameter, were installed at depths of 10, 20, 30 and 50 cm (four pipes at each depth) out of the trenched plot in both the irrigated and non-irrigated plots in the spring of 2003 to collect air samples from the soil. The pipes were sealed by three-way cocks to allow the gas concentration in the pipes to equilibrate with the soil air. From each of the pipes installed at each depth and each treatment, air samples (50 mL) were taken into a Tedlar bag during the cham-ber measurements. All samples taken from the same depth and treatment were mixed into a Tedlar bag. Air samples of 50 mL from each of the Tedlar bags were diluted with CO2-free air for CO2 analysis, and 20 mL
was transferred to 10 mL glass bottles for CH4 and
N2O analysis.
These measurements were conducted between 10.00 and 18.00 hours to avoid diurnal effects on fluxes. We did not carry out measurements within 12 h of irrigation to avoid effects of the physical movement of water in the soil.
During the chamber measurements, the air and soil temperature and the soil moisture around each chamber were recorded manually. The air temperature around each chamber was measured with a digital thermometer to calculate GHG fluxes. Two replicate soil temperature measurements at a depth of 10 cm near each chamber, which is the boundary between the O-layer and the min-eral soil, were also taken using digital thermometers. Two replicate soil moisture measurements as volumetric water content at a soil depth of 0–10 cm (O-layer) from each chamber base were taken with a calibrated time domain reflectometer (TDR) sensor (TRIME-como; Tohoku Electronic Industrial Company, Sendai, Japan).
Soil temperature and moisture were recorded automat-ically approximately 5 m away from each chamber in both the irrigated and non-irrigated plots (Lopez et al.
2007). Soil temperature was measured using calibrated thermistors at depths of 10, 20, 30, 40 and 60 cm (T10,
T20, T30, T40, and T60, respectively; 104ET, Ishizuka
Denshi, Tokyo, Japan). Because of some sensor troubles with a thermistor at the 20 cm depth, we excluded the
T20 data from the analysis. The thermistors were
cali-brated using an ice-water bath with a precision of 0.02C at 0C; the overall probe accuracy for the temper-ature range of)20 to 30C was calculated to be better
than ±0.09C. T10 was recalibrated using soil tem-perature measured manually around the chambers. Soil moisture was measured using the frequency domain reflectometry (FDR) method at depths of 0–10, 10–20, 20–30, 30–40 and 50–60 cm (W10, W20, W30, W40and
W60, respectively; EnviroSMART, Sentek, South
Austra-lia, Australia). The FDR sensors were calibrated sepa-rately for depths of 0–10 cm and for depths below 10 cm (mineral soil layer). For this purpose, we collected 11 in situ soil samples of each soil depth with various moisture conditions and determined the volumetric water content gravimetrically to construct a calibration curve. W10was recalibrated using soil moisture measured
man-ually around the chambers. Soil temperature was recorded every 30 s and stored every 1 h on average, whereas soil moisture was recorded every 1 h. The soil temperature and moisture recorded at the time of gas sampling were used for the statistical analyses.
Physical and chemical conditions of the soil and
water samples
To analyze the physical properties of the soil and water samples, three soil cores 100 cm3 in size were sampled from each layer in 2003. With these undisturbed cores, we measured the volume of the air-filled pore space (AFPS) using a three phase meter (Model DIK-1110; Daiki Rika Kogyo Co., Saitama, Japan). The gas tortuos-ity factor (D⁄D0) of the undisturbed soil cores was
measured and calculated using the method developed by Osozawa and Kubota (1987) under steady-state condi-tions using O2 as the diffusing gas. The cores were
oven-dried (105C) for 48 h to obtain bulk density and water-filled pore space (WFPS). The porosity was calcu-lated as the sum of WFPS and AFPS. The length of the fine roots (<2 mm in diameter) in each layer was calculated using a theoretical equation after Ono (2003) as follows:
R¼2n
S ;
whereR is the length of the fine roots in a unit volume of each layer (cm cm)3; Table 1),nis the number of the cut ends of fine roots appearing on each layer in the soil profile and S is the area of each layer in the soil profile (cm)2).
Fresh soil samples were sieved (2 mm) and used for the chemical analysis. The concentrations of NO3)-N
in a 1:20 for the O-layer and a 1:10 for the mineral soil : deionized water mixture were measured using ion chromatography (TOA DIC Analyzer ICA-2000; TOA DKK, Tokyo, Japan). The concentrations of NH4+-N
soil : 1 mol L)1 KCl solution mixture were measured using colorimetry (the indophenol-blue method) with a UV-VIS spectrophotometer (UV mini 1240; Shimadzu, Kyoto, Japan).
Irrigated water was sampled directly from the rubber hose that was used to apply the irrigation water. Rain water was sampled using eight rain gutters (0.12 m2each) that had been placed around the irrigated and non-irrigated plots.
The concentrations of NH4+-N and NO3)-N in the
irri-gation and rain water were also measured. The contents of NH4+-N and NO3)-N in the soil were calculated by
multiplying the bulk density by the NH4+-N or NO3)-N
concentration of each layer of the soil. The contents of NH4+-N and NO3)-N in the irrigation and rain water
were calculated by multiplying the amount of irrigation or rain water by the NH4+-N or NO3)-N concentrations of
the water.
Analysis of the CO
2, CH
4and N
2O
concentrations
The CO2concentration was determined with a portable
infrared CO2 gas analyzer (ZFP9GC11; Fuji Electric
Systems, Tokyo, Japan). The CH4 and N2O
concentra-tions were analyzed using gas chromatography
equipped with a flame ionization detector and an electron capture detector, respectively (GC-8A and GC-14B; Shimadzu).
Estimation of soil-gas diffusivity and calculation
of flux, respiration and production rates of
greenhouse gases
Greenhouse gas fluxes, measured using a closed-chamber method, were calculated as follows:
whereFcis the flux of GHGs obtained using the
closed-chamber method (lg C or N m)2h)1), q is the gas
density of GHGs (CO2-C, CH4-C, 0.536·103g m)3;
N2O-N, 1.25·103g m)3), V⁄A is the height of the
chamber (m), dc⁄dt is the ratio of change in the gas con-centration (c) inside the chamber per unit time (t) during the sampling period (m3m)3h)1) and T is the air temperature (ºC).
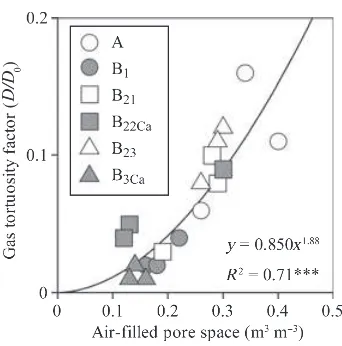
We estimated the flux of each GHG from the mineral soil to the O-layer using a soil gradient method (Kusa
et al. 2008). The soil-gas diffusivities were estimated using the soil AFPS (Fig. 3). Estimated diffusivities were corrected for temperature effects using DT⁄D25=
[(273 + T)⁄298]1.75 (Reid et al. 1977). Greenhouse gas flux from the mineral soil to the O-layer was determined from Fick’s law as: at the surface of the mineral soil calculated using the gas tortuosity factor (D⁄D0) and the molecular
diffu-sivity of each GHG in air (D0CO2= 0.138,
D0CH4= 0.191, D0N2O = 0.143) and dc⁄dz is the ratio of change in the gas concentration (c) along the soil depth (z) (lg C or N cm)3cm)1). We made quadratic
functions of depth (10, 20, 30 and 50 cm) to each GHG concentration to calculate dc⁄dz at the 10-cm depth, the boundary between the O-layer and the min-eral soil, as the slope of the tangent to the quadratic functions at the 10-cm depth (Takle et al. 2004). We did not use the GHG concentration data at the 0-cm
depth, ambient air, to make the quadratic
functions because there is always some variation in the gas concentrations owing to the turbulent mixing of ambient air with to some extent the topmost O-layer (Pihlatie et al.2007).
The root respiration rate (Rr) of each measurement was calculated as the difference between the CO2 flux from
the surface of the O-layer in the root-intact (Rs) and trenched plots (the microbial respiration rate in the whole soil [Rmw]) of each measurement. One negative value of
Rr was eliminated. We regarded the estimated GHG fluxes from the mineral soil into the O-layer as the GHG production rates in the mineral soil, assuming no move-ment of GHGs in the permafrost. The GHG production rates in the O-layer were calculated as the difference between the GHG fluxes from the surface of the O-layer and the production rates of GHG in the mineral soil
to avoid problems caused by the turbulent mixing of ambient air and the unevenly distributed O-layer constitu-ents (Davidson and Trumbore 1995; Pihlatieet al.2007; Schwendenmann and Veldkamp 2006). For CO2, we
regarded the CO2production rates in the mineral soil as
the microbial respiration rates in the mineral soil (Rmm) assuming that almost allRrwas occurring in the O-layer because in the most part the fine roots were distributed in the O-layer (Table 1). The microbial respiration rate in the O-layer (Rmo) was calculated as the difference betweenRmwandRmm.
The following equations were applied to the measured temperature and CO2flux or production rate data (FCO2) to calculate the normalized CO2 flux or the production
rate (FCO2,b) corresponding to the base temperature (Tb, 5C in the present study):
FCO2 ¼aexpðbTÞ
FCO2;b¼FCO2exp b½ ðTbTÞ;
where a and b are fitted constants and T is the soil temperature at the 10-cm depth (Takakaiet al.2008).
Negative fluxes and production rates of CH4and N2O
represent downward movement or net consumption of the gases.
To evaluate the relative significance of CO2, CH4and
N2O, their global warming potentials ([GWP] mg CO2-eq
m)2h)1) expressed in CO
Two-way ANOVAs or paired t-tests were carried out to
compare the average GHG fluxes, GHG production, soil temperature or soil moisture obtained from the irrigated and non-irrigated plots before and during the irrigation period.
Linear or non-linear regression analyses were carried out to examine the relationship between the measured GHG flux and production, soil temperature and mois-ture. Spearman’s correlation analyses were carried out to examine the relationship between W20 and other
variables because of the non-normal distribution of W20.
A multiple regression analysis was used to evaluate the contributions ofRr,Rmo,Rmm, CH4production in the
O-layer and the mineral soil, and N2O production in the
O-layer and the mineral soil to GWP.
Significance for all statistical analyses was accepted at
P= 0.05. All statistical analyses were carried out using the statistical package R, version 2.9.1 (R Development Core Team 2009).
RESULTS
Physical and chemical properties of the soil
The soil physical and chemical properties are shown in Table 1. The dry bulk density in the O-layer was 0.41 and the density in the mineral soil ranged from 1.1 to 1.9 Mg m)3, and increased as the depth increased. The porosity in the mineral soil ranged from 0.34 to 0.55 m3m)3andD⁄D
0in the mineral soil before the
irri-gation experiment ranged from 0.01 to 0.11 m2s)1, and both decreased with an increase in depth. The NO3)-N
and NH4+-N concentrations in each layer ranged
from 0.02 to 0.23 mg kg soil)1 and from 0.00 to 0.02 g kg soil)1, respectively, and both were highest in the O-layer, whereas there was no trend in the mineral soil. The NH4+-N contents in the O-layer and in the
min-eral soil (1–62 cm) were 816 and 9,160 mg m)2, respec-tively, and the NO3)-N contents were 9 and 82 mg m)2,
respectively. The estimated length of fine roots in each layer ranged from 0 to 80 m L)1 and 86% of the fine roots were distributed in the O-layer.
Precipitation, soil temperature and soil moisture
A total of 11.4 mm of precipitation occurred during the 30 days before the irrigation period. The amount of pre-cipitation from 17 June to 27 July was 19.8 mm.
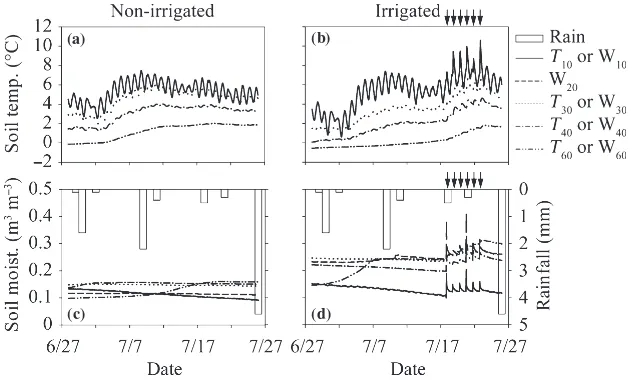
The soil temperature at depths of 10, 30, 40 and 60 cm (T10,T30,T40andT60, respectively) during the flux
mea-surements ranged from)0.5 to 7.6C in the irrigated plot
and from)0.0 to 6.9C in the non-irrigated plot (Fig. 4
a,b). Before the irrigation period, the average soil temper-ature at each depth in the irrigated plot was significantly lower than that in the non-irrigated plot (Table 2;
P< 0.01). During the irrigation period, the average T10
in the irrigated plot was significantly higher than that in the non-irrigated plot (P< 0.01), the averageT60in the
irrigated plot was significantly lower than that in the non-irrigated plot (P< 0.001), and the average T30and T40
did not differ between the irrigated and non-irrigated plots.
Soil moisture in the O-layer (W10) during the flux
measurements ranged from 0.11 to 0.14 m3m)3 in the irrigated plot and from 0.10 to 0.13 m3m)3in the non-irrigated plot (Fig. 4c,d). Soil moisture at depths of 10–20, 20–30, 30–40 and 50–60 cm (W20, W30, W40,
and W60, respectively) ranged from 0.13 to 0.31 m3m)3
in the irrigated plot and from 0.10 to 0.16 m3m)3in the non-irrigated plot. Soil moisture increased with an increase in depth in both plots. Although the average soil moisture at each depth in the irrigated plot was signifi-cantly higher than that in the non-irrigated plot, both before and during the irrigation period (Table 2;
increase with an increase in irrigation (Fig. 4D). W20 in
the irrigated plot was significantly higher during the irrigation period than before the irrigation period and
W20 in the non-irrigated plot was significantly lower
during the irrigation period than before the irrigation period (both atP< 0.001).
(a) (b)
(c) (d)
Figure 4 (a,b) Temporal variation in soil temperature at 10, 30, 40 and 60 cm depths (T10,T30,T40, andT60, respectively) and (c,d) soil
moisture at 0–10, 10–20, 20–30, 30–40 and 50–60 cm depths (W10, W20, W30, W40, and W60, respectively) of the non-irrigated (a,c)
and irrigated plots (b,d). Arrows indicate the irrigation events for the irrigated plot. Open bars represent the precipitation amount.
Table 2 Average greenhouse gas fluxes, production, global warming potentials and soil temperature and moisture during each period of measurement
Before irrigation period During irrigation period
Non-irrigated plot Irrigated plot Non-irrigated plot Irrigated plot
Rs(mg C m)2h)1) 116 ± 21a 106 ± 32a 109 ± 11a 171 ± 20b
Rr(mg C m)2h)1) 36 ± 11a 45 ± 23a 45 ± 8a 49 ± 14a
Rmw(mg C m)2h)1) 80 ± 15b 67 ± 15a 63 ± 6a 122 ± 10b
Rmo(mg C m)2h)1) 64 ± 13b 44 ± 16a 54 ± 5a 97 ± 8b
Rmm(mg C m)2h)1) 17 ± 3a 24 ± 4b 9 ± 3a 25 ± 2b
CH4(w) (lg C m)2h)1) )8.3 ± 3.4a )8.3 ± 3.5a )14.0 ± 6.5a )5.4 ± 4.1b
CH4(o) (lg C m)2h)1) 3.8 ± 5.4a 3.6 ± 4.3a )5.67 ± 6.3
a
6.1 ± 4.0b
CH4(m) (lg C m)2h)1) )12.0 ± 3.3a )11.9 ± 2.4a )8.4 ± 1.9a )11.5 ± 2.4a
N2O(w) (lg N m)2h)1) 1.21 ± 1.56a 0.13 ± 0.63a 0.21 ± 1.12a 1.58 ± 1.64b
N2O(o) (lg N m)2h)1) 1.06 ± 1.52a 0.06 ± 0.63a 0.32 ± 1.11a 1.44 ± 1.71a
N2O(m) (lg N m)2h)1) 0.15 ± 0.22a 0.07 ± 0.19a
)0.11 ± 0.26a 0.14 ± 0.26a
T10(C) 5.53 ± 1.04b 5.06 ± 1.43a 6.92 ± 0.60a 7.63 ± 0.28b
T20(C) 7.62 ± 1.68b 4.92 ± 1.18a 7.76 ± 0.46b 6.77 ± 0.46a
T30(C) 4.61 ± 1.09b 2.97 ± 0.89a 4.84 ± 0.21a 5.09 ± 0.52a
T40(C) 3.12 ± 0.90b 1.60 ± 0.76a 3.54 ± 0.19a 3.69 ± 0.52a
T60(C) 1.22 ± 0.79b )0.08 ± 0.30
a
1.93 ± 0.07b 1.18 ± 0.49a
W10(m3m)3) 0.12 ± 0.01a 0.13 ± 0.01b 0.10 ± 0.00a 0.12 ± 0.00b
W20(m3m)3) 0.12 ± 0.00a 0.24 ± 0.01b 0.11 ± 0.00a 0.26 ± 0.00b
W30(m3m)3) 0.15 ± 0.00a 0.24 ± 0.00b 0.14 ± 0.00a 0.26 ± 0.01b
W40(m3m)3) 0.15 ± 0.00a 0.21 ± 0.01b 0.15 ± 0.00a 0.24 ± 0.01b
W60(m3m)3) 0.13 ± 0.02a 0.22 ± 0.03b 0.16 ± 0.02a 0.28 ± 0.02b
Within the group of greenhouse gas fluxes, production and soil temperature and moisture, values with different letters are significantly different at P< 0.05.Rs, soil respiration rate;Rr, root respiration rate;Rmw,Rmo,Rmm, microbial respiration rate from the whole soil, O-layer and mineral soil, respectively; CH4(w), CH4(o), CH4(m), CH4production rates in the whole soil, O-layer and mineral soil, respectively; N2O(w), N2O(o), N2O(m), N2O
Nitrogen supply by irrigation and precipitation
The NH4+-N and NO3)-N concentrations in the irrigation
water were 0.09 and 0.10 mg L)1and the concentrations in the rain water were 0.14 and 0.005, respectively. The NH4+-N and NO3)-N supply to the soil by irrigation were
11 and 12 mg m)2and by rain water were 2.8 and 0.1, respectively. A total of 13.8 mg m)2of NH
4+-N and 12.1
of NO3)-N were added to the soil over the measurement
period.
Greenhouse gas flux from the surface of the
O-layer
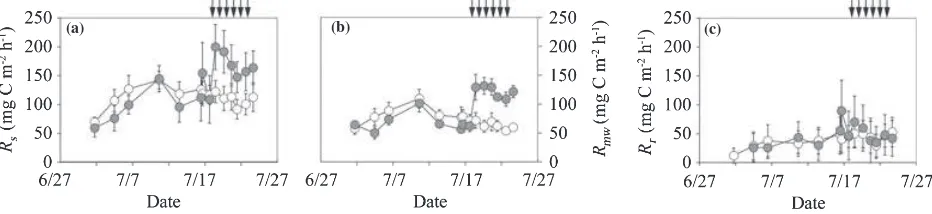
The CO2flux from the surface of the O-layer in the
root-intact plot (Rs) ranged from 59 to 200 mg C m)2h)1in the irrigated plot and from 70 to 142 in the non-irrigated plot, and both fluctuated with variation in the soil temper-ature (Figs 4a,b, 5a). Before the irrigation period the aver-ageRs(mean ± standard deviation [SD]) in the irrigated plot (106 ± 32 mg C m)2h)1; Table 2) did not differ from that in the non-irrigated plot (116 ± 21). During the irrigation period, the average Rs in the irrigated plot (171 ± 20) was significantly higher than that in the non-irrigated plot (109 ± 11;P< 0.001). The CO2flux from
the surface of the O-layer in the trenched plot (microbial respiration rate in whole soil; Rmw) ranged from 50 to 132 mg C m)2h)1 in the irrigated plot and from 54 to 109 in the non-irrigated plot, and accounted for 42–108% (mean ± SD; 67 ± 12%) of Rs(Fig. 5b). This percentage was high at the beginning of the measurement period and decreased with time. Before the irrigation period, the averageRmw(mean ± SD) in the irrigated plot (67 ± 15 mg C m)2h)1; Table 2) was significantly lower than that in the non-irrigated plot (80 ± 15; P< 0.05). During the irrigation period, the averageRmwin the irri-gated plot (122 ± 10) was significantly higher than that in the non-irrigated plot (63 ± 6;P< 0.001).
The ranges of the root respiration rate (Rr), calculated from the difference betweenRsandRmw, were 26–90 and
12–53 mg C m)2h)1 in the irrigated and non-irrigated plots, respectively, accounting for 17–58% (mean ± SD; 35 ± 9%) ofRs(Fig. 5c). This percentage was low at the beginning of the measurement period and increased with an increase in soil temperature in the non-irrigated plot, whereas irrigation depressed the rate in the irrigated plot. The averageRr in the irrigated plot did not differ from that in the non-irrigated plot before or during the irriga-tion period (Table 2).
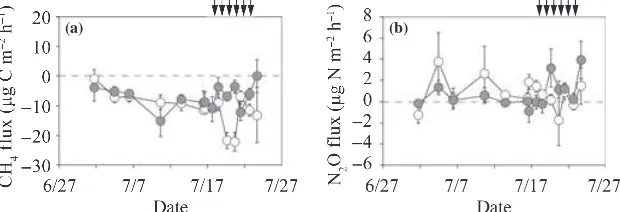
The CH4flux from the surface of the O-layer ranged
from )15 to)0lg C m)2h)1in the irrigated plot and
from)22 to)1 in the non-irrigated plot (Fig. 6a). Before
the irrigation period, the average CH4flux (mean ± SD)
in the irrigated plot ()8.3 ± 3.4lg C m)
2
h)1; Table 2) did not differ from that in the non-irrigated plot ()8.3 ± 3.5). During the irrigation period, the CH4flux in
the irrigated plot ()5.4 ± 4.1) was significantly higher
than that in the non-irrigated plot ()14.0 ± 6.5;
P< 0.001).
The N2O flux from the surface of the O-layer ranged
from)0.9 to 3.9lg N m)2h)1in the irrigated plot and
from)0.7 to 3.8 in the non-irrigated plot (Fig. 6b). Before
the irrigation period, the average N2O flux (mean ± SD)
from the irrigated plot (0.13 ± 0.63lg N m)2h)1;
Table 2) did not differ from that in the non-irrigated plot (1.21 ± 1.56lg N m)2h)1). During the irrigation period,
the N2O flux from the irrigated plot (1.58 ± 1.64lg
N m)2h)1) was significantly higher than that from the non-irrigated plot (0.21 ± 1.12lg N m)2h)1;P< 0.05).
Greenhouse gas concentration in the soil
The ranges of CO2concentration of soil air at depths of
10, 20, 30 and 50 cm were 720–4,740 p.p.m.v in the irri-gated plot and 900–3,600 p.p.m.v in the non-irriirri-gated plot (Fig. 7a,b). The CO2concentrations increased with
an increase in depth in both plots.
The ranges of CH4concentration of soil air at depths of
10, 20, 30 and 50 cm were 0.30–2.07 p.p.m.v in the irri-gated plot and 0.34–2.16 p.p.m.v in the non-irriirri-gated plot
(a) (b) (c)
(Fig. 7c,d). The CH4 concentration decreased with an
increase in depth in both plots.
The ranges of N2O concentration of soil air at depths of
10, 20, 30 and 50 cm were 0.30–0.33 p.p.m.v in the irri-gated plot and 0.29–0.33 p.p.m.v in the non-irriirri-gated plot (Fig. 7e,f). The N2O concentration was independent of
the depth of soil in both plots.
Greenhouse gas production rate
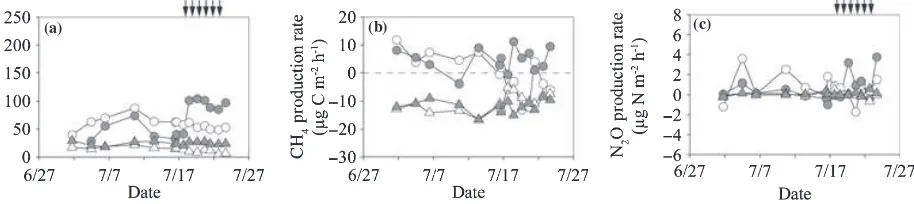
The ranges of the microbial respiration rate in the O-layer (Rmo) were 29–105 and 40–80 mg C m)2h)1in the irri-gated and non-irriirri-gated plots, respectively, and accounted for 26–62% (mean ± SD; 50 ± 9%) ofRs(Fig. 8a). This percentage was high at the beginning of the measurement
(a) (b)
Figure 6 Temporal variation in (a) CH4fluxes from the surface of the O-layer and (b) N2O fluxes from the surface of the O-layer of the
non-irrigated (open symbols) and irrigated plots (closed symbols). Positive values indicate net emission and negative values indicate net consumption. Vertical bars denote the standard error of each parameter. Arrows indicate the irrigation events for the irrigated plot.
(a) (b)
(c) (d)
(e) (f)
Figure 7 Temporal variation in (a,b) CO2, (c,d) CH4and (e,f) N2O concentrations (conc.) in soil air at 10, 20, 30 and 50 cm depths of
period and decreased with an increase in soil temperature in the non-irrigated plot, whereas irrigation enhanced the rate in the irrigated plot. Before the irrigation period, the average Rmo (mean ± SD) in the irrigated plot (44 ± 16 mg C m)2h)1; Table 2) was significantly lower than that in the non-irrigated plot (64 ± 13;P< 0.001). During the irrigation period, the averageRmoin the irri-gated plot (97 ± 8 mg C m)2h)1) was significantly higher than that in the non-irrigated plot (54 ± 5; P< 0.001). The microbial respiration rate in the mineral soil (Rmm) ranged from 18 to 29 mg C m)2h)1in the irrigated plot and from 5 to 22 mg C m)2h)1in the non-irrigated plot, and accounted for 5–49% (mean ± SD; 16 ± 9%) of Rs (Fig. 8a). This percentage was high at the beginning of the measurement period and decreased with time. The aver-age Rmmvalues before and during the irrigation period (mean ± SD) in the irrigated plot were 24 ± 4 and 25 ± 2 mg C m)2h)1and both values were significantly higher than the values recorded in the non-irrigated plot (17 ± 3 and 9 ± 3 mg C m)2h)1, respectively;P< 0.01; Table 2).
The CH4production rate in the O-layer ranged from)4
to 11lg C m)2h)1in the irrigated plot and from
)13 to
12 in the non-irrigated plot (Fig. 8b). Before the irrigation period, the average CH4 production rate in the O-layer
(mean ± SD) in the irrigated plot (3.6 ± 4.3lg C m)2h)1;
Table 2) did not differ from that in the non-irrigated plot (3.8 ± 5.4). During the irrigation period, the CH4
produc-tion rate in the irrigated plot (6.1 ± 4.0) was significantly higher than that in the non-irrigated plot ()5.7 ± 6.3;
P< 0.05). The CH4 production rate in the mineral soil
ranged from)17 to)8lg C m)2h)1in the irrigated plot
and from)17 to)5 in the non-irrigated plot (Fig. 8b). The
average CH4production rate in the mineral soil in the
irri-gated plot did not differ from that in the non-irriirri-gated plot before and during the irrigation period (Table 2).
The N2O production rate in the O-layer ranged from
)1.0 to 3.8lg N m)2h)1in the irrigated plot and from
)1.7 to 3.6lg N m)2h)1in the non-irrigated plot. The N2O production rate in the mineral soil ranged from)0.2
to 0.6lg N m)2h)1in the irrigated plot and from)0.6
to 0.5 in the non-irrigated plot (Fig. 8c). Average N2O
(a) (b) (c)
Figure 8 Temporal variation in (a) microbial respiration rate in the O-layer and the mineral soil (Rmoare indicated by circles andRmm are indicated by triangles, (b) CH4production rates in the O-layer and the mineral soil (circles and triangles, respectively) and (c) N2O
production rates in the O-layer and the mineral soil (circles and triangles, respectively) of the non-irrigated (open symbols) and irrigated plots (closed symbols). Positive values indicate net emission and negative values indicate net consumption. Arrows indicate the irrigation events for the irrigated plot.
Table 3Average global warming potentials of root respiration (Rr), microbial respiration in the O-layer (Rmo), microbial respiration in the mineral soil (Rmm), and CH4and N2O production of each part of the soil in each period (expressed in CO2-equivalent; mg CO2-eq
m)2h)1) from the study site
Before irrigation During irrigation
Non-irrigated plot (%) Irrigated plot (%) Non-irrigated plot (%) Irrigated plot (%)
Rr 131a(31) 166a(43) 167a(42) 180a(29)
Rmo 233b(55) 163a(42) 198a(50) 355b(56)
Rmm 61a(14) 86b(22) 34a(8) 93b(15)
CH4production in the O-layer 0.125a(0.03) 0.122a(0.03) )0.188a()0.05) 0.202b(0.03)
CH4production in mineral soil )0.401a()0.09) )0.397a()0.10) )0.280a()0.07) )0.383a()0.06)
N2O production in the O-layer 0.496a(0.12) 0.029a(0.01) 0.150a(0.04) 0.674a(0.11)
N2O production in mineral soil 0.069a(0.02) 0.031a(0.01) )0.051a()0.01) 0.064a(0.01)
Net GWP 425a(100) 390a(100) 398a(100) 628b(100)
production rates in both the O-layer and the mineral soil in the irrigated plot did not differ from the rates in the non-irrigated plot before and during the irrigation period (Table 2).
Global warming potentials
Before the irrigation period, the GWP of the soil (mean ± SD) in the irrigated plot (390 ± 117 mg CO2
-eq m)2h)1) did not differ from that in the non-irrigated plot (425 ± 78). During the irrigation period, the GWP in the irrigated plot (628 ± 75) was significantly higher than
that in the non-irrigated plot (398 ± 39; P< 0.001; Table 3). Carbon dioxide production accounted for more than 99% of the GWP in both the irrigated and non-irri-gated plots both before and during the irrigation period. The GWP increment resulting from irrigation was mainly caused by an increase in microbial respiration.Rmomade the greatest contribution to GWP in both the irrigated and non-irrigated plots both before and during the irrigation period. The GWP by only CH4 and N2O production
during the irrigation period in the non-irrigated plot was negative ()0.20 mg CO2-eq m)2h)1) because CH4 (a)
(d)
(g)
(j) (k) (l) (h) (i) (b) (c)
(e) (f)
consumption by the soil offset the GWP by N2O
produc-tion. However, the GWP in the irrigated plot was positive (0.56 mg CO2-eq m)2h)1), mainly owing to an increase
in GWP by N2O production, which could not be offset by
CH4consumption.
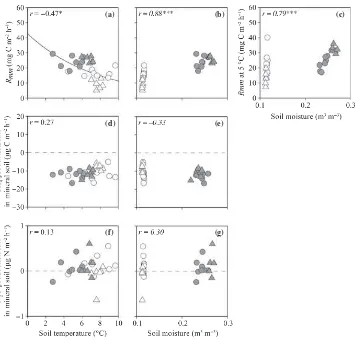
Controlling factors for greenhouse gas fluxes
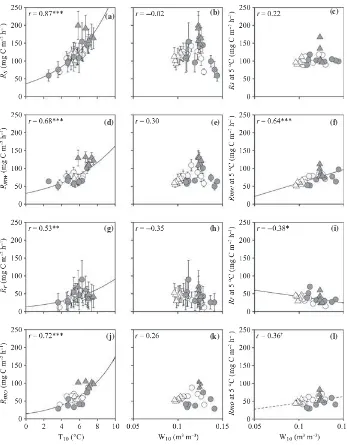
Non-linear regressions revealed a significant positive cor-relation betweenT10andRs,Rr,RmwandRmo(r= 0.87, 0.53, 0.68 and 0.72, respectively,P< 0.01; Fig. 9a,d,g,j). No significant correlation between T10 and Rmm was recorded (r= 0.11; Fig. 12a). NormalizedRmwand Rmm values were significantly and positively correlated with W10and W20, respectively, whereas normalizedRr was significantly and negatively correlated with W10(r= 0.64,
0.76 and )0.38, respectively, P£0.05; Figs 9f,i, 12c).
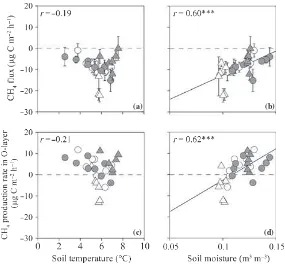
Normalized Rmo had a weak positive correlation with W10(r= 0.36,P= 0.07; Fig. 9l). Both the CH4flux from
the surface of the O-layer and the CH4production rate in
the O-layer had significant positive correlations with W10
(r= 0.60 and 0.62, respectively, P< 0.001; Fig. 10b,d). The CH4production rate in the mineral soil was not
cor-related with eitherT10or W20(Fig. 12d,e). Each N2O flux
or N2O production rate did not significantly correlate
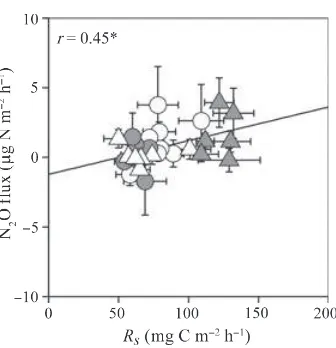
with either soil temperature or moisture (Figs 11, 12f,g). The N2O flux from the surface of the O-layer had a
signif-icant positive correlation with Rmw (r= 0.45, P< 0.05; Fig. 13).
We carried out multiple regression analyses to evaluate the contributions ofRr,Rmo,Rmm, CH4production in the
O-layer and the mineral soil, and N2O production in the
O-layer and the mineral soil to GWP (Table 4). The results showed thatRmohad the largest effect on the GWP followed by Rr and Rmm. This indicates that microbial activity plays an important role in controlling GWP of the soil in this region. The production rates of CH4and N2O
had little effect on the GWP.
DISCUSSION
Effects of irrigation on soil temperature and
moisture
Both soil temperature at a depth of 10 cm (temperature of the boundary between the O-layer and the mineral soil [T10]) and soil moisture in the O-layer (W10) increased
with irrigation (Fig. 4b,d). The increase in T10 results
from the higher temperature of the irrigation water (approximately 15C) thanT10in the irrigated plot before the irrigation period (4.5C on average). The temperature of the raindrops should be in the balance between latent heat by evaporation of raindrops and sensible heat from the atmosphere to raindrops (Ogura 1999). Anderson
et al.(1998) verified that measured raindrop temperature
and wet-bulb temperature were almost equal. The mean temperature of raindrops in July in Yakutsk is calculated to be 14C from mean air temperature (18.7C) and mean relative humidity (60%) in July in Yakutsk (Japan Meteo-rological Agency 2004). These values indicate that an increase in soil temperature as a result of heavy precipita-tion would occur in this region. Permafrost creates a strong heat sink in the summer that keeps soil temperature low (Eugsteret al.2000) and therefore soil temperature would increase greatly with heavy precipitation events in this region. The very low amount of precipitation in one event (2.2 mm in maximum) might be the reason why the precipitation during the experimental period did not affect the soil temperature (Fig. 4).
Effects of irrigation on CO
2flux and CO
2production rate
The increase inRmoas a result of irrigation was affected by the soil temperature in our study (Fig. 9j); this result is consistent with a previous study (Boone et al.1998). In contrast, the normalizedRmovalue had only a weak posi-tive effect on soil moisture (Fig. 9l). These results indicate that the increase inRmowas mainly caused by the increase in soil temperature as a result of irrigation. In general, the microbial respiration rate increases immediately after irri-gation in dry conditions, whereas the microbial respira-tion rate did not vary or decrease with irrigarespira-tion in wet conditions (Howard and Howard 1993). The weak rela-tionship between soil moisture and normalizedRmo indi-cated that the O-layer at this site was relatively dry, but not severely dry. Waldrop and Zak (2006) mentioned that there was a trend that soil amended with NO3)-N
(7 mg kg soil)1) could enhance the soil C decomposition rate 1.5-fold. Comparing the supply of NH4+-N and
NO3)-N to the soil by irrigation (11 and 12 mg N m)2,
respectively) with the NH4+-N and NO3)-N contents in
the O-layer (826 and 9 mg N m)2, respectively), NH
4+-N
supply could be negligible, whereas the NO3)-N supply
was equivalent to 1.3-fold the NO3)-N content in the
O-layer. However, an increase in NO3)-N concentrations
in the O-layer as a result of irrigation could not exceed 0.3 mg kg soil)1(Table 1). Therefore, it appears that the NO3)-N amendment of soil by the irrigation water barely
affected theRmo.
There was no significant correlation between the soil temperature andRmm(Fig. 12a). In contrast, both Rmm and normalized Rmm were significantly and positively affected by soil moisture (Fig. 12b,c). W20 in the
irri-gated plot was significantly higher during the irrigation period than before the irrigation period, and W20 in the
non-irrigated plot was significantly lower during the irri-gation period than before the irriirri-gation period (both at
P< 0.001). This indicates that the change in W20could
(a)
(c) (d) (b)
Figure 10 (a,b) CH4fluxes from the surface of the O-layer and (c,d) the CH4production rate in the O-layer plotted against soil
tempera-ture at a depth of 10 cm (a,c) and moistempera-ture at the 0–10 cm depth (b,d). Open and closed circles indicate data from non-irrigated and irrigated plots before irrigation and open and closed triangles indicate data from non-irrigated and irrigated plots during irrigation. ***P< 0.001. Error bars indicate the standard error of each parameter.
(a)
(c) (d) (b)
Figure 11 (a,b) N2O fluxes from the surface of the O-layer and (c,d) the N2O production rate in the O-layer plotted against soil
period in the non-irrigated plot compared with that in the irrigated plot, even if there were no differences between Rmm in the non-irrigated and irrigated plots before the irrigation period. The NH4+-N and NO3)-N
contents in the mineral soil (9,160 and 82 mg N m)2, respectively) were much higher than those in the O-layer (826 and 9 mg N m)2, respectively), so that the effect of inflow of N from the O-layer into the mineral soil as a result of irrigation toRmmwas negligible.
As a result, the positive correlation between soil temper-ature and Rmw (Fig. 9d) was derived from the positive correlation between soil temperature and Rmo. In con-trast, the positive correlation between soil moisture and normalized Rmw (Fig. 9f) was derived mainly from the positive correlation between soil moisture and Rmm. These results indicated that a future increase in heavy precipitation events in summer, resulting in increases in soil temperature and moisture, could accelerate the decomposition of soil C in the O-layer as well as in the mineral soil.
Irrigation did not increase the root respiration rate (Rr) in our study, and a negative correlation between normal-ized Rr and soil moisture and a positive correlation betweenRrand soil temperature were observed (Figs 5c, 9g,i). A very few studies reported the effect of irrigation or precipitation accompanied by an increase in soil moisture onRr.Rrwas depressed by surplus water owing to reduced soil oxygen diffusion (Bouma and Bryla 2000). A positive relationship between soil temperature and Rr has been reported in many studies (Atkinet al.2000; Pregitzeret al.
2000). The increase in the percentage ofRrtoRswith soil temperature in the non-irrigated plot in our study strongly supported a positive correlation between soil temperature andRr. These results indicate that the negative effect of the increase in soil moisture as a result of irrigation onRroffset the positive effect of the increase in soil temperature onRr in this ecosystem. It is suggested that the soil in active layer investigated was too wet not to increaseRraccompanied by an increase in soil temperature because of a shortage of oxygen during the irrigation period.
(a)
(d) (e)
(f) (g)
(b) (c)
Figure 12 (a,b) Microbial respiration rate in mineral soil and (c,d) CH4and (e,f) N2O production rates in mineral soil plotted against
The Rs value recorded in the present study was posi-tively correlated with soil temperature, which increased with an increase in irrigation (Fig. 9a). A positive relation-ship between soil temperature andRs has been reported in many studies (Booneet al.1998; Davidsonet al.1998; Xu and Qi 2001). In contrast, normalized Rs was not affected by an increase in soil moisture as a result of irri-gation (Fig. 9c). We concluded that an increase in soil moisture as a result of irrigation in the present study acceleratedRmw, but depressedRr. Consequently, the soil moisture appeared to have no influence on Rs. This
indicates that the permafrost in this region has the poten-tial to supply an adequate amount of water to plants (Sugimotoet al.2002), but would not have the potential to maintain a high soil moisture, which would depress decomposition of the soil organic matter.
Effects of irrigation on CH
4flux and CH
4production rate
The CH4flux from the surface of the O-layer in the
pres-ent study (from )2 to )0lg C m)2h)1) ranged over a
higher rate than values reported from forests in northern Europe (from )143 to )1lg C m)2h)1; Smith et al.
2000). Outside the permafrost region in Russia, Nakano
et al.(2004) reported a CH4flux ranging from)210 to )69lg C m)
2
h)1in western Siberia and Morishitaet al. (2005) reported a CH4 flux of )63lg C m)2h)1 near Khabarovsk. These fluxes are much lower than the fluxes recorded in the present study. In contrast, in a permafrost region of Russia, Morishitaet al.(2006) reported that the CH4flux ranged from)3.4 to)1.6lg C m)2h)1in
cen-tral Siberia and Takakai et al. (2008) recorded a range from)10 to 3.4lg C m)2h)1near Yakutsk; these results
are similar to our results. Flessaet al.(2008) mentioned that the lower CH4consumption in soils with continuous
permafrost can be explained by factors that hamper the diffusion of atmospheric CH4into the soil. However, van
Huissteden et al. (2008) observed CH4 fluxes ranging
from)301 to)278lg C m)
2
h)1in a forest only 1 km from our study site. The reason for this variation is unknown.
The CH4production rate in the mineral soil was lower
than that in the O-layer in the present study. This result is similar to results reported in previous studies (Donget al.
1998; Saariet al.1998).
The CH4 production rate in the mineral soil did not
differ between the irrigated and non-irrigated plots, despite a difference in soil moisture in these plots (Figs 8b, 12e). The CH4production rate in soil is the net result of
simultaneously occurring production and consumption of CH4 within the soil (Butterbach-Bahl and Papen 2002;
Yavittet al. 1995). This indicates that the potential for both gross CH4production and consumption rates in the
mineral soil did not change with the increase in soil mois-ture resulting from irrigation.
In contrast, the increase in the CH4production rate in
the O-layer as a result of irrigation was affected by the soil moisture in our study (Fig. 10d). In the irrigated plot, the CH4production rates in the O-layer were positive during
the irrigation period. This indicates that the increase in CH4production in the O-layer as a result of irrigation in
our study is caused by a change in the balance between gross CH4 production and consumption rates in the
O-layer as a result of an increase in soil moisture. The CH4production rates in the O-layer were estimated from Table 4 Standardized partial regression coefficients obtained
from a multiple regression analysis to evaluate the contributions of root respiration rate (Rr), microbial respiration rate from the O-layer (Rmo), microbial respiration rate from the mineral soil (Rmm), CH4production in the O-layer and the mineral soil, and
N2O production in the O-layer and the mineral soil to global
warming potentials
CH4(o), CH4(m), CH4production rate in the O-layer and mineral soil,
respectively; N2O(o), N2O(m), N2O production rate in the O-layer and
mineral soil, respectively.
Figure 13 CO2fluxes from the surface of the O-layer (Rs) plot-ted against N2O fluxes from the surface of the O-layer. Open
two types of fluxes measured with different methods, so these rates include various assumptions. However, there is a possibility that a significantly higher CH4flux from the
surface of the O-layer in the irrigated plot compared with that in the non-irrigated plot during the irrigation period (Fig. 6a) resulted from a change in the CH4production
rate in the O-layer, because the CH4production rate in
the mineral soil was not affected by the irrigation. The effect of the addition of NH4+ in the irrigation water
should not be significant because the NH4+content in the
O-layer was much higher than that added by the irrigation (826 and 11 mg N m)2, respectively). In general, a nega-tive correlation between soil moisture and CH4 flux is
observed under dry conditions and a positive correlation between them is observed under wet conditions (Curry 2007; Strieglet al.1992). In our study, soil dryness was not a limiting factor for CH4consumption.
Effects of irrigation on N
2O flux and N
2O
production rate
The N2O flux from the surface of the O-layer (from)1.7
to 3.9lg N m)2h)1) ranged over a lower rate than previ-ously reported values in boreal forests (from)4.9 to 22.3;
Dalal and Allen 2008). Previous studies conducted near Yakutsk also reported very low values (from)2.1 to 4.6;
Morishita et al. 2007; Takakai et al. 2008). These low values show characteristics of an N-limited region (Hat-ano et al. 2001; Schulze et al. 1995). The much larger N2O production in the O-layer than in the mineral soil
observed in the present study was consistent with previous studies (Saariet al.1997).
A number of studies have reported a positive correla-tion between soil moisture and temperature and N2O
flux from the surface of the O-layer in natural forests (e.g. Dong et al. 1998; Fest et al. 2009). Although the N2O flux during the irrigation period in our study was
higher in the irrigated plot than in the non-irrigated plot, the N2O fluxes did not correlate with either soil
moisture or temperature (Figs 11, 12e,f). Only a weak positive correlation between the N2O flux from the
sur-face of the O-layer and soil temperature was found (P= 0.08). The N2O production rates in the O-layer
and the mineral soil did not differ between the irrigated and non-irrigated plots both before and during the irri-gation period and did not correlate significantly with either soil moisture or soil temperature. In contrast, the N2O flux from the surface of the O-layer was positively
correlated with Rmw (P< 0.05; Fig. 13). This indicates that the main cause of an increase in the N2O flux from
the surface of the O-layer as a result of irrigation was not a direct effect of either soil temperature or moisture, but rather an indirect effect of microbial activities. Comparing NH4+-N and NO3)-N supply to the soil by
irrigation (11 and 12 mg N m)2, respectively) with the NH4+-N and NO3)-N contents in the O-layer, which
produced most of the N2O for the whole soil (826 and
9 mg N m)2, respectively), NH
4+-N supply was
negligi-ble, whereas NO3)-N supply was comparable with the
NO3)-N content in the O-layer. This indicates that
NO3)-N supply by irrigation might stimulate N2O
emission via an increase in denitrification in the irri-gated plot. Liu et al. (2008) could not detect variation in the N2O flux from the surface of the O-layer after
irrigation owing to the lack of substrate for denitrifica-tion process on grassland in Inner Mongolia. The weak relationship between N2O flux from the surface of the
O-layer and both soil temperature and moisture in the present study might be caused by a deficiency of N. Du
et al.(2006) also observed no significant linear relation-ship between both soil temperature and moisture and diurnal N2O flux from the surface of the O-layer in
grassland in Inner Mongolia. However, these researchers mentioned that it was the distribution of effective pre-cipitation, rather than the precipitation intensity, which influenced seasonal and inter-annual variations in N2O
flux. Even in the ecosystem investigated in the present study, observations over a longer period are needed to examine the effects of precipitation on N2O flux from
the surface of the O-layer.
Conclusions
In the investigated Taiga forest near Yakutsk, which is characterized by low soil temperature and dry weather, heavy precipitation events would increase both soil tem-perature and moisture. The increased soil temtem-perature and moisture would accelerate microbial activities, which play an important role in controlling the GWP in the soil, resulting in decomposition of soil organic matter in both the O-layer and the mineral soil. As a result, the release of inorganic N into the soil together with an increase in N2O
emission, which has a huge impact on the GWP of the soil, would be expected. Continuous study on the effect of changes in precipitation patterns on the decomposition of soil organic matter accompanied by N mineralization is crucial in predicting the future GWP of soil in this region. In addition, an increase in the gross CH4production rate
might decrease the potential of the soil to act as a CH4
sink. Further study is required to investigate changes in CH4 production in the O-layer caused by heavy rain
events.
ACKNOWLEDGMENTS
Branch, Russian Academy of Science, for their support during the field research. This study was funded by the RR2002 Program of the Japanese Ministry of Education, Culture, Sports, Science and Technology.
REFERENCES
Anderson SP, Hinton A, Weller RA 1998: Moored observations of precipitation temperature. Journal of Atmospheric and Oceanic Technology,15, 979–986.
Atkin OK, Edwards EJ, Loveys BR 2000: Response of root respi-ration to changes in temperature and its relevance to global warming.New Phytol.,147, 141–154.
Bond-Lamberty B, Wang CK, Gower ST 2004: A global relation-ship between the heterotrophic and autotrophic components of soil respiration?Global Change Biol.,10, 1756–1766. Boone RD, Nadelhoffer KJ, Canary JD, Kaye JP 1998: Roots
exert a strong influence on the temperature sensitivity of soil respiration.Nature,396, 570–572.
Borken W, Davidson EA, Savage K, Gaudinski J, Trumbore SE 2003: Drying and wetting effects on carbon dioxide release from organic horizons.Soil Sci. Soc. Am. J.,67, 1888–1896. Bouma TJ, Bryla DR 2000: On the assessment of root and soil respiration for soils of different textures: interactions with soil moisture contents and soil CO2concentrations.Plant Soil,227, 215–221.
Butterbach-Bahl K, Papen H 2002: Four years continuous record of CH4-exchange between the atmosphere and untreated
and limed soil of a N-saturated spruce and beech forest ecosystem in Germany.Plant Soil,240, 77–90.
Curry CL 2007: Modeling the soil consumption of atmospheric methane at the global scale.Global Biogeochem. Cycles,21, GB4012.
Dalal RC, Allen DE 2008: Greenhouse gas fluxes from natural ecosystems.Aust. J. Bot.,56, 369–407.
Davidson EA, Belk E, Boone RD 1998: Soil water content and temperature as independent or confounded factors control-ling soil respiration in a temperate mixed hardwood forest.
Global Change Biol.,4, 217–227.
Davidson EA, Trumbore SE 1995: Gas Diffusivity and Produc-tion of CO2in Deep Soils of the Eastern Amazon.Tellus B Chem. Phys. Meteorol.,47, 550–565.
Dong Y, Scharffe D, Lobert JM, Crutzen PJ, Sanhueza E 1998: Fluxes of CO2, CH4and N2O from a temperate forest soil:
the effects of leaves and humus layers.Tellus B Chem. Phys. Meteorol.,50, 243–252.
Du R, Lu DR, Wang GC 2006: Diurnal, seasonal, and inter-annual variations of N2O fluxes from native semi-arid
grass-land soils of inner Mongolia.Soil Biol. Biochem.,38, 3474– 3482.
Easterling DR, Evans JL, Groisman PYet al.2000: Observed variability and trends in extreme climate events: a brief review.Bull. Am. Meteorol. Soc.,81, 417–425.
Eugster W, Rouse WR, Pielke RAet al.2000: Land-atmosphere energy exchange in Arctic tundra and boreal forest: avail-able data and feedbacks to climate.Global Change Biol.,6, 84–115.
Fest BJ, Livesley SJ, Drosler M, van Gorsel E, Arndt SK 2009: Soil-atmosphere greenhouse gas exchange in a cool, temperate Eucalyptus delegatensis forest in south-eastern Australia.Agricultural and Forest Meteorology,149, 393– 406.
Flessa H, Rodionov A, Guggenberger Get al.2008: Landscape controls of CH4fluxes in a catchment of the forest tundra
ecotone in northern Siberia.Global Change Biol.,14, 2040– 2056.
Goodale CL, Apps MJ, Birdsey RAet al.2002: Forest carbon sinks in the Northern Hemisphere. Ecol. Appl.,12, 891– 899.
Hatano R, Sawamoto T, Shibuya Met al.2001: Characteristics of nitrogen cycling in Permafrost regional ecosystems in Yakutsk, Russia. InNinth Symposium on the Joint Sibe-rian Permafrost Studies between Japan and Russia in 2000 Ed. M Fukuda and Y Kobayashi, pp. 99–103, Sapporo, Japan.
Howard DM, Howard PJA 1993: Relationships between CO2
evolution, moisture-content and temperature for a range of soil types.Soil Biol. Biochem.,25, 1537–1546.
van Huissteden J, Maximov TC, Kononov AV, Dolman AJ 2008: Summer soil CH4emission and uptake in taiga forest
near Yakutsk, Eastern Siberia.Agricultural and Forest Mete-orology,148, 2006–2012.
IPCC 2007: Climate change 2007: The Physical Science Basis. Contribution of Working Group I to the Fourth Assessment Report of the Intergovernmental Panel on Climate Change, Cambridge University Press, Cambridge, United Kingdom and New York, NY, USA.
Japan Meteorological Agency 2004: Monthly Report of the Japan Meteorological Agency, Japan Meteorological Agency, Tokyo.
Kusa K, Sawamoto T, Hu R, Hatano R 2008: Comparison between closed-chamber and gas concentration gradient methods for measurement of CO2and N2O fluxes in two
upland field soils.Soil Sci. Plant Nutr.,54, 777–785. Liu CY, Holst J, Bruggemann Net al.2008: Effects of Irrigation
on Nitrous Oxide, Methane and Carbon Dioxide Fluxes in an Inner Mongolian Steppe.Advances in Atmospheric Sci-ences,25, 748–756.
Lopez MLC, Saito H, Kobayashi Yet al.2007: Interannual envi-ronmental-soil thawing rate variation and its control on transpiration fromLarix cajanderi, Central Yakutia, Eastern Siberia.J. Hydrol.,338, 251–260.
Millard P, Midwood AJ, Hunt JE, Whitehead D, Boutton TW 2008: Partitioning soil surface CO2efflux into autotrophic
and heterotrophic components, using natural gradients in soil delta C-13 in an undisturbed savannah soil.Soil Biol. Biochem.,40, 1575–1582.
Morishita T, Hatano R, Desyatkin RV 2007: N2O Flux in Alas Ecosystems Formed by Forest Disturbance Near Yakutsk, Eastern Siberia, Russia. Eurasian Journal of Forest Research,10, 79–84.
Morishita T, Hatano R, Takahashi K, Kondrashov LG 2005: Effect of deforestation on CH4uptake in Khabarovsk, Far
Morishita T, Matsuura Y, Zyryanova OA, Abaimov AP 2006: CO2, CH4, and N2O fluxes from a larch forest soil in
Central Siberia.InSymptom of Environmental Change in Siberian Permafrost Region, Ed. R Hatano and G. Guggen-berger, pp. 1–9, Hokkaido University Press, Sapporo, Japan. Nakano T, Inoue G, Fukuda M 2004: Methane consumption and soil respiration by a birch forest soil in West Siberia.
Tellus B Chem. Phys. Meteorol.,56, 223–229.
Oberbauer SF, Gillespie CT, Cheng Wet al.1992: Environmen-tal-Effects on CO2 Efflux from Riparian Tundra in the
Northern Foothills of the Brooks Range, Alaska, USA.
Oecologia,92, 568–577.
Ogura Y 1999: General Meteorology (in Japanese). University of Tokyo Press, Tokyo.
Ohta T, Hiyama T, Tanaka Het al.2001: Seasonal variation in the energy and water exchanges above and below a larch forest in eastern Siberia.Hydrol. Process.,15, 1459–1476. Ono R 2003: Examination of presuming method of the length of
the line contained in a space, and the application in investi-gation of tea plant rootlet (in Japanese with English sum-mary).Root Research,12, 119–123.
Osozawa S, Kubota T 1987: Method or measuring soil gas diffu-sion coefficient (in Japanese). Japanese Journal of Soil Science and Plant Nutrition,58, 528–535.
Pihlatie M, Pumpanen J, Rinne Jet al.2007: Gas concentration driven fluxes of nitrous oxide and carbon dioxide in boreal forest soil.Tellus B Chem. Phys. Meteorol.,59, 458–469. Potter CS, Davidson EA, Verchot LV 1996: Estimation of global
biogeochemical controls and seasonality in soil methane consumption.Chemosphere,32, 2219–2246.
Pregitzer KS, King JA, Burton AJ, Brown SE 2000: Responses of tree fine roots to temperature.New Phytol.,147, 105–115. R Development Core Team 2009: R: A Language and
Environ-ment for Statistical Computing. R Foundation for Statistical Computing, Vienna, Austria, URL: http://www.R-project. org.
Reid RC, Prausnitz JM, Sherwood TK 1977: The Properties of Gases and Liquids. McGraw-Hill, New York.
Rodionow A, Flessa H, Kazansky O, Guggenberger G 2006: Organic matter composition and potential trace gas produc-tion of permafrost soils in the forest tundra in northern Sibe-ria.Geoderma,135, 49–62.
Saari A, Heiskanen J, Martikainen PJ 1998: Effect of the organic horizon on methane oxidation and uptake in soil of a boreal Scots pine forest.FEMS Microbiol. Ecol.,26, 245–255. Saari A, Martikainen PJ, Ferm Aet al.1997: Methane oxidation
in soil profiles of Dutch and Finnish coniferous forests with
different soil texture and atmospheric nitrogen deposition.
Soil Biol. Biochem.,29, 1625–1632.
Schulze ED, Schulze W, Kelliher FMet al.1995: Aboveground Biomass and Nitrogen Nutrition in a Chronosequence of Pristine Dahurian Larix Stands in Eastern Siberia.Canadian Journal of Forest Research-Revue Canadienne De Recher-che Forestiere,25, 943–960.
Schwendenmann L, Veldkamp E 2006: Long-term CO2
produc-tion from deeply weathered soils of a tropical rain forest: evidence for a potential positive feedback to climate warm-ing.Global Change Biol.,12, 1878–1893.
Sirotenko OD, Abashina EV 2008: Modern Climate Changes of Biosphere Productivity in Russia and Adjacent Countries.
Russian Meteorology and Hydrology,33, 267–271. Smith KA, Dobbie KE, Ball BCet al.2000: Oxidation of
atmo-spheric methane in Northern European soils, comparison with other ecosystems, and uncertainties in the global terres-trial sink.Global Change Biol.,6, 791–803.
Soil Survey Staff 2010: Soil taxonomy. A Basic System of Soil Classification for Making and Interpreting Soil Surveys, 11th edn. US Gov Printing Office, Washington, DC. Striegl RG, Mcconnaughey TA, Thorstenson DC, Weeks EP,
Woodward JC 1992: Consumption of Atmospheric Meth-ane by Desert Soils.Nature,357, 145–147.
Sugimoto A, Yanagisawa N, Naito D, Fujita N, Maximov TC 2002: Importance of permafrost as a source of water for plants in east Siberian taiga. Ecol. Res., 17, 493–503.
Takakai F, Desyatkin AR, Lopez CML, Fedorov AN, Desyatkin RV, Hatano R 2008: Influence of forest disturbance on CO2, CH4and N2O fluxes from larch forest soil in the
per-mafrost taiga region of eastern Siberia.Soil Sci. Plant Nutr.,
54, 938–949.
Takle ES, Massman WJ, Brandle JR et al.2004: Influence of high-frequency ambient pressure pumping on carbon diox-ide efflux from soil.Agricultural and Forest Meteorology,
124, 193–206.
Waldrop MP, Zak DR 2006: Response of oxidative enzyme activities to nitrogen deposition affects soil concentrations of dissolved organic carbon.Ecosystems,9, 921–933. Xu M, Qi Y 2001: Soil-surface CO2efflux and its spatial and
temporal variations in a young ponderosa pine plantation in northern California.Global Change Biol.,7, 667–677. Yavitt JB, Fahey TJ, Simmons JA 1995: Methane and
Carbon-Dioxide Dynamics in a Northern Hardwood Ecosystem.