RESEARCH OF REGISTRATION APPROACHES OF THERMAL INFRARED IMAGES
AND INTENSITY IMAGES OF POINT CLOUD
Lirong Liu a,b, Zhanying Wei b, Xianlin Liu a,b, Zheng Yang c, *
a
Key Laboratory of 3D Information Acquisition and Application of Ministry of Education, Capital Normal University, Beijing, China –[email protected]
b
Chinese Academy of Surveying and Mapping, Beijing, China - [email protected] c
School of Resource and Environmental Sciences, Wuhan University, Wuhan, China [email protected]
KEY WORDS: Image registration, Intensity image of point cloud, Thermal infrared image, Partial intensity invariant feature descriptor
ABSTRACT:
In order to realize the analysis of thermal energy of the objects in 3D vision, the registration approach of thermal infrared images and TLS(Terrestrial Laser Scanner)point cloud was studied. The original data was pre-processed. For the sake of making the scale and brightness contrast of the two kinds of data meet the needs of basic matching, the intensity image of point cloud was produced and projected to spherical coordinate system, histogram equalization processing was done for thermal infrared image.This paper focused on the research of registration approaches of thermal infrared images and intensity images of point cloud based on SIFT,EOH-SIFT and PIIFD operators. The latter of which is usually used for medical image matching with different spectral character. The comparison results of the experiments showed that PIIFD operator got much more accurate feature point correspondences compared to SIFT and EOH-SIFT operators. The thermal infrared image and intensity image also have ideal overlap results by quadratic polynomial transformation. Therefore, PIIFD can be used as the basic operator for the registration of thermal infrared images and intensity images, and the operator can also be further improved by incorporating the iteration method.
* Corresponding author
1. INTRODUCTION
As a non-destructive and non-contact technique, thermal infrared remote sensing can detect the temperature difference of target surfaces and have been widely applied in building energy efficiency investigation and the conservation of architectural heritage(Costanzo et al., 2015;Maierhofer et al.,2011).Thermal imaging is typically used to record the temperatures of the targets. However, it acquires 2D images without any spatial dimensions, which is not suffice for quantitative measurements. If digital 3D heat energy models were created, the heat spots can be located more precisely and the building energy detection(Borrmann et al.,2012a)will be more reliable.In recent years, laser scanning have been widely used for urban modelling and a number of researches have been done on the fusion of 3D point cloud and optical images to get 3D model. As a consequence, taking the existing fusion methods of point could and optical images for reference, this paper focused on studying the feasible co-registration method of laser point cloud and thermal infrared images, aiming to provide a 3D vision with thermal information for energy analysis or anomalous detection of all kinds of objects.
As thermal image and laser point cloud have different spectral characteristics, objects visible in the visual domain may be invisible in the infrared domain even if they have the same temperature and emissivity coefficient. In contrast, in thermal images, even objects below the surface of an object may be visible which is certainly invisible in the visual domain. Two
different materials with the same temperature can appear with different intensity if they have a significantly different emissivity coefficient. Interestingly, two objects with different temperature and emissivity coefficient may coincidentally appear with very similar intensity in thermal images. The intensity values of the point clouds also have intimate relations with the material, colour and roughness of the objects scanned. So the respective characteristics of intensity value represented by the two data sets increased the difficulty to find a robust method to realize the co-registration between thermal images and laser point cloud.
Several related researches have been done on the registration of point cloud and thermal images. (Gonzalez-Aguilera et al., 2012) proposes a 2D-2D registration method. After having corrected the geometric deformation induced by camera lenses, the point cloud was projected onto a plane parallel to the infrared image plane which resulted in the so-called range image. The registration was performed using an affine transformation and the control points from both images were selected using Harris operator (Harris and Stephens, 1988).Another method proposed by(Lagüela et al.,2012),consists in line matching, which were 2D line features extracted in the thermal images and 3D line features in the point cloud.(Weinmann et al.,2014) focused on thermal 3D mapping which allowed to observe the evolution of a dynamic 3D scene overtime. After radiometric and geometric correction, a robust approach for detecting reliable feature correspondences and a co-registration of point cloud and thermal information via a RANSAC-based EPnP(Efficient Perspective-n-Point) solution were given. A contour-based
algorithm was proposed for 3D point cloud and infrared image registration which did not depend on the shape of the edge points and took into account the perspective effect by considering projective transformations (Bennisa et al.,2013) . Related research shows that manual control points or special equipment such as range camera have been used in previous study and most of the data fusion approaches of thermal images and LiDAR point clouds are limited on the 3D mapping of a certain scene such as a history building or an indoor scene which was decorated in advance. So, there is still no reliable and robust co-registration method yet. The tricky problem of the study lies in the features matching between LiDAR point cloud and thermal images, including points, lines and planes. This paper aims to study the feasible co-registration method of thermal images and point cloud based on feature matching. SIFT(Scale-invariant Feature Transform),EOH-SIFT(Edge Oriented Histogram) and PIIFD (Partial Intensity Invariant Feature Descriptor)operators were tested for contrastive analysis.
2. THE BASIC ALGORITHM THEORY OF SIFT, EOH-SIFT AND PIIFD
The SIFT(Lowe,2004) key points are famous for their distinctiveness. In the first stage, it detects extreme feature points in scale-space. Potential interest points that are invariant to scale and orientation are identified to describe the local characteristics of the image by using a difference-of-Gaussian function. Then one or more orientations are assigned to each key point based on the histogram peak value of local image gradient directions. Finally, a high-dimensional feature vector representing the image gradients within a local region of the image is formed as the key point descriptor.
The difficulty of the registration of thermal image and intensity image of point cloud lies in the different spectral characteristics of two data source. The pixel value of thermal image represents the temperature of objects while the intensity image of point cloud is similar to near-infrared image, whose value reflects the colours, echoing characteristics and material of the targets. Compared to normal optical images’ matching, the characteristics of thermal and intensity images are nonlinear correlation. Therefore, the correlation between image gradient is very small, and the algorithm based on gradient such as SIFT, SURF, etc. can't satisfy the registration demand(Isteni et al.,2007; Lee et al.,2010). So this paper focus on EOH-SIFT and PIIFD approaches which can be applied to the multispectral image acquired in different spectral bands.
EOH-SIFT (Aguilera et al., 2012) is an adapted SIFT approach used for Far-Infrared and Visible Spectrum images matching. First of all, it detects key points by the use of a SIFT-like detector. Then, an Edge Oriented Histogram (EOH) based approach is proposed to characterize multispectral key points and the Canny edge detector algorithm(Canny,1986) is used to extract contour edges. That is, a descriptor based on the edge histogram is used instead of the gradient information (gradient and direction) used by SIFT. Finally, matches are obtained by finding nearest couples in the feature description space. EOH-SIFT can also be used as a feature point descriptor for images from the same spectral band. However, this approach assigns no main orientation value to key points, so its rotation invariance effect is not that satisfactory. Correspondingly, the matching image should be provided with strict position, perspective and scope consistency.
PIIFD (Chen et al.,2010)also known as Harris – PIIFD is a distinctive local feature descriptor which can be applied to images’ matching acquired from different positions or perspectives and is also invariant to image rotation and partially
invariant to image intensity, affine transformation, and viewpoint change. PIIFD detects initial feature points by Harris detector (Harris and Stephens, 1988) and extracts the PIIFD surrounding each point. Due to the nonlinear correlation of the variation of intensity of multispectral images, the common method such as SIFT which determines the main directions of the key points by using the gradient directional histogram is not suffice. If the average or cumulative gradient value of neighbourhood pixels is taken as the main orientation, the opposite gradients will cancel each other which are supposed to reinforce each other. So PIIFD square the gradient vectors Convolution calculation is done by setting a Gaussian-weighted window empirically. reason that the average orientation acquired in a small window is sensitive to noise while in a large window cannot represent
Corresponding features in the images of different spectrum tend to appear different even contrary brightness variation characteristics. For instance, the motor vehicles, computers or heat pipes and other high temperature objects can only present their reflected color of visible light in optical image, while these objects show high brightness in thermal infrared image. So the gradient orientations at corresponding locations in the images may point to opposite directions and the gradient magnitudes usually change.
Compared to SIFT, PIIFD makes two improvements on the image gradients to reduce the sensitivity of the matching operator to image brightness. First, the gradient magnitudes are normalized piecewise to reduce the influence of gradient magnitude variation. In a neighborhood of each key point, the first 20% strongest gradient magnitudes are set to 1, the second 20% to 0.75, and by parity of reasoning the last 20% to 0.
Second, the main orientation is limited within [0°,180°]instead of [0°,360°] and the orientation histogram is converted to a degraded orientation histogram with only 8 bins by calculating the sum of the opposite directions instead of 16 bins in SIFT. As a result, the improved descriptor PIIFD achieves partial invariance to the intensity change.Similar to SIFT, PIIFD adopts 4*4*8 matrix to construct the feature descriptor.
WhereHij denotes a gradient orientation histogram with 8 bins. 3. REGISTRATION OF THERMAL INFRARED IMAGES AND INTENSITY IMAGES OF POINT CLOUD 3.1 Matching Workflow
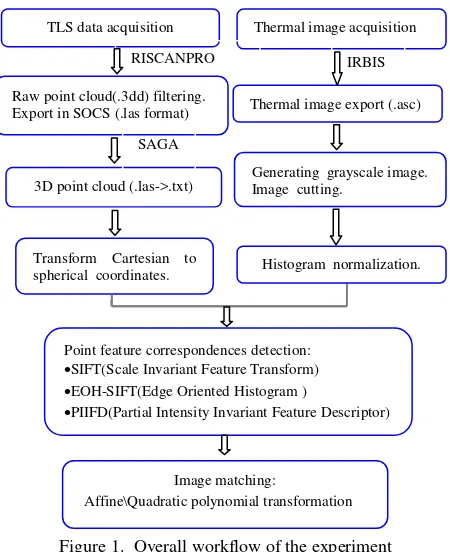
Figure 1. Overall workflow of the experiment
As presented in Figure 1, RIEGL VZ–6000 terrestrial Laser Scanner and its corresponding post-processing software RISCANPRO were used to obtain and process the laser point cloud data. The original point cloud with .3dd format was filtered, cut and transformed to SOCS(Scanner’s Own Coordinate System) and .las format. The open source software SAGA(System for Automated Geoscientific Analyses) was used to output ( SAGA,2015).txt format of the point cloud data. Then the subsequent coordinate transformation and feature extraction process were done in matlab.
Thermal images were acquired using VarioCAM ® high resolution thermal infrared thermal imaging system developed by German InfraTec company. The thermal images were acquired with 30 mm standard focal lens and 30 x 23 °FOV (Field of view). The image pixel size is 640 x 480 or increased to 1280 x 960 after resolution enhancement. Here in Table1 we calculate the images’ resolution as the shooting distance changes based on the 640 x 480 image.
d(m) 1 2 5 10 30 100 500
H(m) 0.5 1 2.5 5 15 50 250
V(m) 0.39 0.78 1.95 3.9 11.7 39.1 195.37 Resolution
(mm) 0.78 1.6 3.9 7.8 23 78 390.6
Table1. Resolution changes with shooting distance of thermal imaging system
Where d is the distance from the thermal imaging system to the target, H is the horizontal distance, V is the vertical distance. This paper acquired the test data in the distance of 30m with the image pixel size of 1280 x 960, whose image resolution is 11.5mm according to Table1 and the image format is .asc output by IRBIS software.
3.2 Data Preprocessing
3.2.1 Spherical coordinate projection of point cloud For the purpose of feature extraction and matching of the two data sets, we ensure that the two sensors RIEGL VZ–6000 and VarioCAM be located nearby and collect data in the same view, as shown in Figure2. The test data was collected in July 2015 in the valley near the village of Schmirn in Austria.
Figure 2. Relative position of the two sensors for data collecting
In order to get the point cloud intensity image which can have similar shooting effect to the corresponding thermal image of the same scene, the point cloud was transformed from Cartesian to spherical coordinate system which can reproduce the work procedure of the laser: scanning from up to down,
Figure 3. Cartesian and spherical coordinate system transformation
TLS data acquisition Thermal image acquisition
RISCANPRO IRBIS
Raw point cloud(.3dd) filtering.
Export in SOCS (.las format) Thermal image export (.asc)
Transform Cartesian to spherical coordinates. 3D point cloud (.las->.txt)
Point feature correspondences detection:
SIFT(Scale Invariant Feature Transform)
EOH-SIFT(Edge Oriented Histogram )
PIIFD(Partial Intensity Invariant Feature Descriptor) Generating grayscale image. Image cutting.
SAGA
Image matching:
Affine\Quadratic polynomial transformation
Histogram normalization.
Assuming that P x, y, z is a point in Cartesian coordinate system, as shown in Figure 3, is the distance between the origin O and the point P. is the angle between OP and the
XOY plane. is the rotating angle from X-axis to OM
counterclockwise from the view of positive direction of X-axis, where point M is the projection of point P on the XOY surface.
、 、 are the spherical coordinates of point P. The vary scopes of the coordinates are:
∈[0,+∞),
∈[0, 2π],
∈[0, π]. A scene including a cabin, a car and the grass was chosen as the test data in this paper. Figure4 and Figure5 shows the intensity image before and after coordinate transformation respectively, which reveals that the shape of the roof on both ends change obviously and the spherical coordinate system conforms to the real visual effect. The intensity image in Figure 5 looks more similar to the shooting perspective of the thermal image in Figure 6.Figure 4. Intensity image in Cartesian coordinate system
Figure 5. Intensity image in spherical coordinate system
3.2.2 Histogram equalization of thermal image
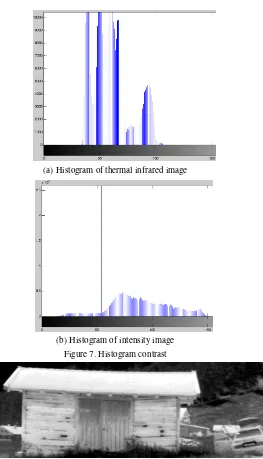
Figure 6 shows the gray scale thermal image, which has low contrast and the detail is not obvious. As shown in Figure 7, the histogram of thermal image is more concentrated compared to intensity image of point cloud. So the histogram equalization was done on the thermal image to facilitate the point feature extraction.
255
min max
min
I
I
I
I
I
n(7)
The gray value of thermal image was extended to [0,255] by equation (7). The histogram equalization result is shown in Figure8. As the intensity image of the point cloud already have strong contrast, no further histogram transformation has been done to avoid the unnecessary loss of image quality.
Figure 6. Gray scale thermal infrared image
(a) Histogram of thermal infrared image
(b) Histogram of intensity image Figure 7. Histogram contrast
Figure 8. Thermal infrared image after histogram equalization
4. EXPERIMENT RESULTS AND ANALYSES In our experiment, the framework presented in Figure1 has been used to evaluate the performance of different feature descriptor algorithms including SIFT,EOH-SIFT and PIIFD. The feature points were extracted both in thermal image and intensity image, and the coregistration results were analyzed for comparison.
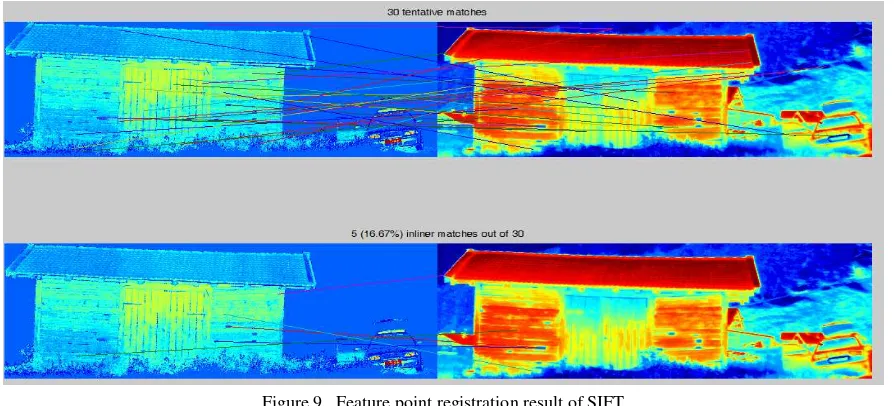
4.1 Matching result by SIFT and EOH-SIFT operators In this paper, we use the open source vlfeat-0.9.20 (Vedaldi and Fulkerson,2008) algorithm library to implement the SIFT matching. By experiment, thermal infrared image and intensity image of laser point cloud cannot get correct feature point registration result. As shown in Figure 9, we got 30 tentative feature point pairs and then obtained 5 ‘inline matches’ by introducing some feature point elimination constraints provided by vlfeat. However, these ‘inline matches’ are not the correct matching couples.
Figure 9. Feature point registration result of SIFT
Similarly, by using the open source matlab program EOH-SIFT provided by Cristhian Aguilera (Aguilera, 2014), we got the experimental results shown in Figure10. As we can see, only 3 points near the left edge of the cabin looks like correct matching couples. Although the EOH-SIFT algorithm has good performance based on the experimental data(called data A) provided by Cristhian Aguilera, it is not applicable for the experimental data (called data B) of this paper.
According to our analysis, there are three reasons. Firstly,images from data A and B have different spectral characteristics, this paper focus on the coregistration of thermal infrared image and intensity image of point cloud while data A
used infrared thermal image and optical image for matching. Secondly, as EOH-SIFT descriptor have poor performance in rotation invariant(Li et al.,2015), all the experimental images in data A have been corrected and aligned strictly(Aguilera et al.,2012). However,the data in this paper have no extral preprocess for the sake of exploring a robust matching algorithm. In addition, the CCD camera and thermal infrared camera are similar in data acquisition,which is totally different from the laser scanning mode.Thirdly, data A selected images containing regular textures such as stairs and tiles which have relative abundant image textures compared to our data B.
Figure 10. Registration result of EOH-SIFT
4.2 Matching result by PIIFD operate
Figure 11. Registration result of PIIFD
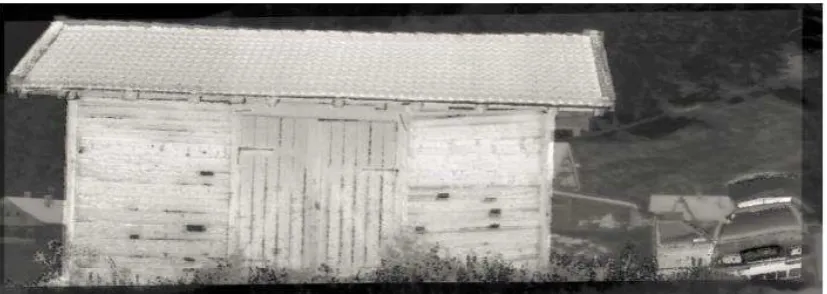
Figure 12. Image overlap result by quadratic polynomial transformation
The PIIFD algorithm was tested on the same image pairs. By trying to change the parameters in the algorithm to see different registration effects, we got the conclusion that the default parameters provided by PIIFD could achieve relative good results. As shown in Figure 11, we obtained 10 matching points, although the feature points are still not enough for high precision registration, the test result already appears a qualitative leap compared with SIFT and EOH-SIFT algorithm. Geometric rectification of quadratic polynomial transform was implemented on the image pairs based on the 10 correspondences. The final overlapping result of thermal image and intensity image is shown in Figure12. Because of the filtering of laser point cloud, ignoring the background of the thermal image, we can see clearly that the front objects such as the cabin and the car have satisfactory matching which demonstrates that the 10 corresponding point couples detected by PIIFD are available and accurate.
5. CONCLUSIONS
This paper focus on researching the coregistration approach of thermal infrared images and TLS point cloud. The registration problem is treated as a matching task of thermal infrared image and intensity image, i.e. 2D image matching. Apart from testing the traditional image matching algorithm SIFT, EOH-SIFT and PIIFD algorithms which perform well at multi spectral image matching are also introduced for experimental analysis. Although thermal image and point cloud data were not acquired strictly in the same location and same angle of view and also no special geometric distortion correction of the images was done in our experiments, it still reveals that PIIFD is a robust and automatic feature detecting algorithm and got ideal and accurate matching points. The next step of our study will focus on solving the distortion correction of the images to get more feature point correspondences and developing iterative algorithm to increase the point couples based on the few feature points we already got. Finally, we could get the 3D model with thermal infrared information by automatic thermal image mapping.
ACKNOWLEDGEMENTS
The experimental data of this paper was acquired in July 2015 at the university of innsbruck in Austria during the communication study period. Thank university of innsbruck for providing the terrestrial laser scanner, thermal infrared imaging
device and relative supporting software. Thanks to Dr. Martin and colleagues of the LiDAR group for their careful assistance and guidance for the study of this article.
REFERENCES
Aguilera, C., Barrera F., Lumbreras F., et al., 2012. Multispectral image feature points.Sensors, 12, pp.12661– 12672.
Aguilera C.,2014. Matlab implementation of EOHSIFT. http://www.mathworks.com/matlabcentral/fileexchange/48200-ngunsu-matlab-eoh-sift.
Bazen A. M., Gerez S. H.,2002. Systematic methods for the computation of the directional fields and singular points of fingerprints. IEEE Trans. Pattern Anal. Mach. Intell.,24(7),pp. 905–919.
Bennisa A., Bombardier V., Thiriet P. et al., 2013. Contours based approach for thermal image and terrestrial point cloud registration.Remote Sensing and Spatial Information Sciences, XXIV International CIPA Symposium, Volume XL-5/W2,pp.97-101.
Borrmann, D., Afzal H., Elseberg J., 2012a. Mutual calibration for 3D thermal mapping. Proceedings of the 10th International IFAC Symposium on Robot.
Canny, F. J., 1986. A computational approach to edge detection.IEEE Transactions on pattern analysis and matching intelligence,8(6),pp.679-698.
Chen J., Tian J., Lee N., et al.,2010. A partial intensity invariant feature descriptor for multimodal retinal image registration.IEEE Trans.Biomed.Eng,57,pp. 1707–718. Costanzo, A., Minasi M., Casula G.,2015. Combined use of terrestrial laser scanning and IR thermography applied to a historical building. Sensors,15, pp.194-213.
Gonzalez-Aguilera D., Rodriguez-Gonzalvez P., Armesto J. et al.,2012. Novel approach to 3d thermography and energy efficiency evaluation[J].Energy and Buildings, 54(0),pp.436– 443.
Harris C., Stephens M.J., 1988. A combined corner and edge detector.Proceedings of Alvey Vision Conference,pp.147–151. Hong L., Wan Y., Jain A., 1998. Fingerprint image enhancement: Algorithm and performance evaluation. IEEE Trans. Pattern Anal. Mach. Intell,20(8),pp.777–789.
Istenic R., Heric D., Ribaric S., et al., 2007. Thermal and visual image registration in hough parameter space.Proceedings of the 14th International Workshop on Systems, Signals and Image Processing and 6th EURASIP Conference focused on Speech and Image Processing, Multimedia Communications and Services ,pp.106–109.
Lagüela S., Armesto J., Arias P., et al., 2012. Automatic procedure for the registration of themographic images with point clouds[C].XXII ISPRS Congress, Volume XXXIX-B5,pp.211-216.
Lee J., Kim Y., Lee D., et al., 2010. Robust CCD and IR image registration using gradient-based statistical information. IEEE Signal Process, 17,pp.347–350.
Li,Y., Shi,X., Li,J.W., et al., 2015. Assigning main orientation to an EOH Descriptor on multispectral images.
Sensors,15,pp.15595-15610.
Lowe D. G., 2004. Distinctive image features from scale invariant keypoints. International Journal of Computer Vision, 60 (2),pp.91-110.
Maierhofer, C., Krankenhagen, R., Röllig, M., et al., 2011. Investigating historic masonry structures with a combination of active thermography and 3D laser scanner. Quant. Infrared. Thermogr, 8,pp.15–118.
SAGA User Group Association, 2015. System for automated geoscientific. http://www.saga-gis.org/en/index.html.
Weinmann M., Leitloff J., Hoegner L., 2014. Thermal 3D mapping for object detection in dynamic scenes.ISPRS Annals of the Photogrammetry, Remote Sensing and Spatial Information Sciences, Volume II-1,pp.53-60.
Vedaldi, A., Fulkerson, B., 2008. VLFeat: An Open and Portable Library of Computer Vision Algorithms. http://www.vlfeat.org/.