ELEVATION-BASED SEA-LEVEL RISE VULNERABILITY ASSESSMENT OF
MINDANAO, PHILIPPINES: ARE FREELY-AVAILABLE 30-M DEMS GOOD ENOUGH?
J. R. Santillan a,b*, M. Makinano-Santillana,b
aCaraga Center for Geo-informatics, College of Engineering and Information Technology
bCaraga State University, Butuan City, 8600, Agusan del Norte, Philippines - (jrsantillan, mmsantillan)@carsu.edu.ph
Commission IV, WG IV/3
KEY WORDS: Digital Elevation Model, Vertical Accuracy, Uncertainty, Sea level rise, Vulnerability Assessment, AW3D30, ASTER GDEM, SRTM DEM, Mindanao, Philippines
ABSTRACT:
We assessed the vertical accuracies and uncertainties of three freely-available global DEMs as inputs to elevation-based sea-level rise vulnerability assessment of Mindanao, Philippines - an area where above average SLR of 14.7 mm/year was recently found. These DEMs are the Shuttle Radar Topography Mission (SRTM) DEM, ASTER Global DEM (GDEM Version 2), and ALOS World 3D-30 (AW3D30). Using 2,076 ground control points, we computed each DEM’s vertical accuracies and uncertainties, and from these we determined the smallest increment of sea-level rise (SLRImin) that should be considered when using the DEMs for SLR impact assessment, as well as the Minimum Planning Timeline (TLmin) for an elevation-based SLR assessment. Results of vertical accuracy assessment revealed Root Mean Square Errors of 9.80 m for ASTER GDEM V2, 5.16 m for SRTM DEM, and 4.32 m for AW3D30. Vertical uncertainties in terms of the Linear Error at 95% Confidence (LE95) were found to be as follows: 19.21 m for ASTER GDEM V2, 10.12 m for SRTM DEM, and 8.47 m for AW3D30. From these, we found that ASTER GDEM2 is suitable to model SLR increments of at least 38.41 m and it will take 2,613 years for the cumulative water level increase of 14.7 mm/year to reach the minimum SLR increment afforded by this DEM. For the SRTM DEM, SLRImin and TLmin were computed as 20.24 m and 1,377 years, respectively. For the AW3D30, SLRImin and TLmin were computed as 16.92 m and 1,151 years, respectively. These results suggest that the readily available global DEMs' suitability for mapping coastal inundations due to SLR in our study area is limited by their low vertical accuracies and high uncertainties. All the three DEMs do not have the necessary accuracy and minimum uncertainties that will make them suitable for mapping inundations of Mindanao at smaller increments of SLR (e.g., SLR ≤ 5m). Hence, users who apply any of these DEMs for SLR impact assessment at SLRIs lower than the DEM’s SLRImin must be cautious in reporting the areas of SLR vulnerable zones. Reporting the inundated areas as a range instead of a singular value for a given SLR scenario can highlight the inherent accuracy and uncertainty of the DEM used in the assessment.
* Corresponding author
1. INTRODUCTION
Rising sea levels associated with global climate change has prompted the need for assessing the vulnerability of coastal regions to inundation. To facilitate this kind of assessment Digital Elevation Models (DEMs) are widely used. One common practice is to use a DEM as input to a single-value surface model or bathtub model to map inundation from SLR using only the two variables: the inundation level and the ground elevation (Schmid et al., 2014). In this model, the DEM is the source for the ground elevation while the inundation levels are based on SLR projections. The approach is straightforward by simply “raising the water level” on a DEM to map and assess the vulnerability of land and its corresponding resources (Gesch, 2013).
Recent studies (e.g., Gesch, 2009; Gesch, 2013; Schmid, et al., 2014; Leon et al., 2014) have shown that to properly model potential impacts of SLR the vertical accuracies and uncertainties of the DEMs must be well quantified and understood. Assessments that do not account for these factors may not present a complete picture of potential inundation, and the results may not be reliable (Gesch, 2009).
DEMs with considerably higher (better than or equal to 1 m) spatial resolution from LiDAR surveys can provide better accuracy in SLR assessments (Gesch, 2009; Cooper et al., 2013; Antonioli et al., 2017). However, the availability of these elevation datasets are scarce in developing countries such that Global DEMs like the Shuttle Radar Topography Mission (SRTM) DEM and the ASTER Global DEM (GDEM V2), including the recently released ALOS World 3D-30 (AW3D30) are often used.
LiDAR) for Mindanao, it cannot be avoided that freely-available 30-m global DEMs like SRTM DEM, ASTER GDEM and AW3D30 are being used to conduct SLR impact assessments. To ensure that these DEMs are used appropriately for such purpose, there is a need to conduct vertical accuracy and uncertainty assessments.
In this work, we assessed the vertical accuracies and uncertainties of the SRTM, ASTER and ALOS DEMs as inputs to elevation-based SLR assessment. The effects of different orders of accuracy of reference elevation data (ground control points) used in the analysis to the computed uncertainties are also presented.
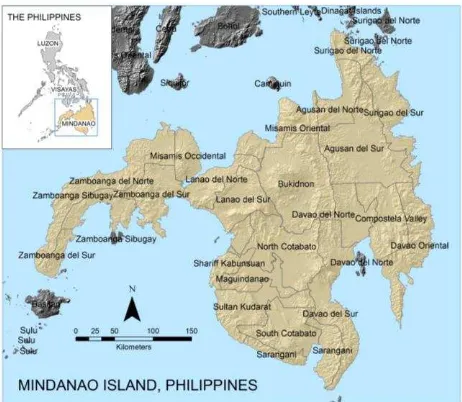
The study area covers the whole of Mindanao Island in southern Philippines (Figure 1). It has an approximate area of 94,090 km2 and coastline length of 4,283 km based on a GIS analysis of the country boundary data extracted from the Global Administrative Areas (GADM) database version 2.0 (www.gadm.org).
To our knowledge, this paper is the first to report the vertical uncertainties of these specific DEMs covering Mindanao, Philippines for SLR assessment purposes.
Figure 1. Map showing the location of Mindanao Island, Philippines and the provinces within.
2. METHODS AND MATERIALS
2.1 Determining a DEM’s Vertical Uncertainty using the Gesch (2013) Approach
Gesch (2013) demonstrated how to take a DEM's vertical uncertainty into consideration in elevation-based SLR vulnerability analysis by quantifying two specific parameters namely, the Minimum Sea Level Rise Increment (SLRImin; also referred to as SLR Interval) and the planning horizon which the author referred to as the Minimum Planning Timeline or TLmin.
According to Gesch (2009), a DEM-based SLR assessment can use small intervals of water-level change as long as the DEM’s vertical accuracy truly support these intervals, i.e., the intervals must be within the bounds of the statistical uncertainty of the elevation data. This minimum interval, SLRImin, can be determined using the equation (Gesch, 2013):
SLRImin = 2*LE95 (1)
where LE95 refers to the linear (vertical) error at 95% confidence of the DEM. LE95, according to Gesch (2009), is a commonly used metric for expressing the vertical accuracy of elevation data, and is an implementation of the U.S. National Standard for Spatial Data Accuracy (NSSDA). LE95 basically informs the users the linear uncertainty of a certain elevation data, i.e., “the true or theoretical location of the point falls within +/- of that linear uncertainty value 95% of the time” (Gesh, 2013; FGCC, 1998). The use of LE95 for computing SLRImin is based on the requirement that elevation data for SLR impact assessment should be at least as twice as accurate (at the 95% confidence level) as the modelled increment of water-level change (Gesch, 2013; Gesch et al., 2009). LE95 can be computed by multiplying 1.96 to the DEM’s vertical Root Mean Square Error (RMSEz), i.e., LE95 = 1.96*RMSEz such that minimum interval is simply computed as:
SLRImin = 3.92*RMSEz (2)
Using Gesch (2013)’s notation,
RMSEz = sqrt[Ʃ(zdata I– zcheck I)2/n] (3)
where zdata I is the DEM elevation of the Ith check point, zcheck I is the true (ground) elevation of the Ith
check point, n is the number of points being checked, and I is an integer from 1 to n.
The TLmin, on the other hand, can be estimated as (Gesch, 2013):
TLmin = SLRImin / Annual SLR Rate (4)
The above equation can be expressed in terms of RMSEz as:
TLmin = (3.92*RMSEz) /Annual SLR Rate (5)
Given the annual SLR rate and a DEM’s RMSEz, TLmin would provide the user of that DEM the number of years for the cumulative water-level increase to reach the minimum sea-level rise increment (SLRImin) afforded by the elevation data (Gesch, 2013).
Similar to Gesch (2013)’s illustration, a DEM with RMSEz of 38.3 cm would allow modeling of only 1.5 m or more of SLR. Using an increment smaller than 1.5 m, according to Gesch (2013) “will give questionable results as the increment will not be within the bounds of the statistical uncertainty of the given elevation data”. Assuming the annual SLR rate is 10 mm/year, TLmin can be estimated as 150 years which means that it will take 150 years for the cumulative water-level to reach the minimum SLR interval afforded by the elevation data.
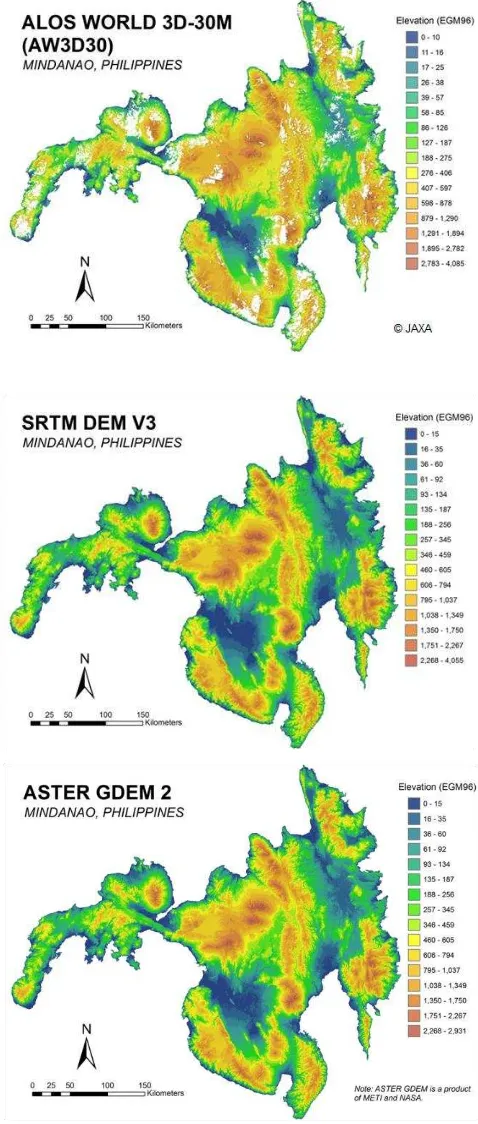
2.2 30-m Global DEMs Used
The AW3D30 Version 1 DEM tiles of Mindanao (Figure 2)
were downloaded from
http://www.eorc.jaxa.jp/ALOS/en/aw3d30/. These tiles were generated using stereo images acquired by the Panchromatic Remote Sensing Instrument for Stereo Mapping (PRISM) sensor onboard the Advanced Land Observing Satellite (ALOS) from 2006 through 2011(Takaku et al., 2014).
5-meter mesh version (AVE = average; MED = median). For this study, we used the AVE tiles. All the tiles were mosaicked and saved in GeoTIFF format using Global Mapper software, and reprojected from WGS 1984 geographic coordinates system to Universal Transverse Mercator Zone 51 projection (retaining WGS 1984 as its horizontal datum) using ArcGIS 9.3 software. The elevation values in the AW3D30 are considered “height above sea level” with the Earth Gravitational Model 1996 (EGM96) as the vertical datum (JAXA, 2017). Missing data due to cloud cover is evident in the AW3D30 DEM Version 1 (shown as white gaps in Figure 2). However, in the most recent version (Version 1.1; March 2017), these gaps or voids have been complemented by existing DEMs.
The SRTM-30m (Version 3) and ASTER GDEM2 (Figure 2) were both downloaded from LP DAAC Global Data Explorer (http://gdex.cr.usgs.gov/gdex/), in GeoTIFF format with Universal Transverse Mercator Zone 51 (UTM51) projection and the World Geodetic System (WGS) 1984 as horizontal datum. Both DEMs have the EGM96 as vertical datum. Raw data used in the generation of the SRTM DEM was collected between February 11-22, 2000 (US Geological Survey, 2015) while the ASTER GDEM2 was generated using images acquired by the ASTER sensor from the year 2000 onwards (Japan Space Systems, 2015).
2.3 Ground Control Points Dataset
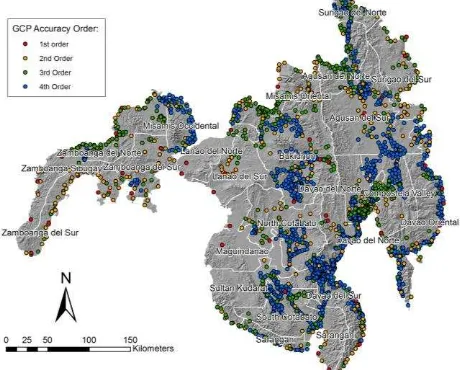
We used a total of 2,076 ground control points (GCPs) in our vertical accuracy and uncertainty analysis (Figure 3; Table 1). These GCPs are part of the Philippines’ Geodetic Control Network established using Global Navigation Satellite System (GNSS) equipment and techniques, and are maintained by the National Mapping and Resource Information Authority (NAMRIA). The GCP data we used in this study was
downloaded from
http://www.geodeticengineer.org.ph/geodetic-control-points/. These GCPs were established using Global Navigation Satellite System (GNSS) equipment and techniques between the years 1990 and 2009 throughout the Philippines with varying orders of accuracy (1st to 4th order). The order of accuracy is determined by minimum GNSS observation and other requirements as specified in the Revised Manual of Land Surveying Regulations in the Philippines (DENR, 1998). As the order number increases, the horizontal and the vertical accuracy of a GCP decreases.
The said GCP data is considered appropriate for use in the analysis since the years when these GCPs were established nearly coincides with the years when the raw data used in the production of the three global DEMs were acquired (i.e., February 2000 for SRTM DEM, year 2000 onwards for ASTER GDEM2, and year 2006-2011 onwards for AW3D30).
Each GCP has WGS 1984 latitude, longitude, and ellipsoidal height. Ellipsoidal heights (h) of the GCPs were converted to EGM96 elevations (or orthometric height, H) using the formula:
H = h – N (6)
where N is the geoidal undulation. N for each GCP was computed using the NGA F477 program available at
http://earth-info.nga.mil/GandG/wgs84/gravitymod/egm96/egm96.html.
2.4 Vertical Accuracy and Uncertainty Assessment
Vertical accuracies of the three DEMs were assessed by comparing the DEM elevations with those of the GCPs. Two types of assessments was conducted. The first assessment considered all the GCPs regardless of the order of their accuracy, while the second assessment look into the effects of the different orders of accuracy of the GCP on the computed DEM vertical accuracies and uncertainties.
The DEM elevations at each point were extracted using ArcGIS 9.3 software. The differences in elevation, which are the measured errors in the DEMs, were computed by subtracting the GCP elevation from its corresponding DEM elevations. Positive errors represent locations where the DEM was above the GCP elevation, and negative errors occur at locations where the DEM was below the control point elevation. From these measured errors, the mean error and RMSEz for each DEM were calculated. The mean error (or bias) indicates if a DEM has an overall vertical offset (either positive or negative) from the true ground level (Gesch et al., 2012).
The values of LE95, SLRImin and TLmin were then computed from the RMSEz of each DEM.
Figure 3. Map showing the ground control points (GCPs) used in the vertical accuracy and uncertainty assessment.
GCP Accuracy Order No. of GCPs
1st 57
2nd 299
3rd 590
4th 1,130
Total 2,076
Table 1. Number of GCPs according to order of accuracy.
2.5 Coastal Inundation Mapping Considering the DEM’s Vertical Uncertainties
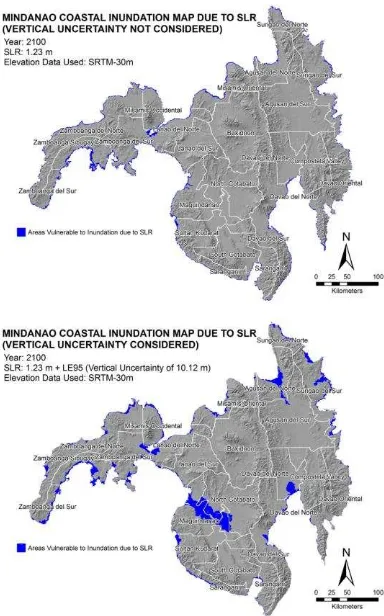
For this work, we are interested in finding how much of the land area of Mindanao Island is vulnerable to the effects of SLR by the year 2100, both with and without consideration of the DEMs' vertical uncertainties.
Assuming that the annual rate is at 14.7 mm/year, the cumulative SLR since 2016 will be at 1.23 m by 2100. Without consideration of vertical uncertainty, the assessment can be done by simply finding all those areas in the DEM whose elevations are less than or equal to 1.23 m using a GIS software. To account for the vertical uncertainty inherent in each DEM, LE95]. This means that the interval 1.23 m ± LE95 defines the
maximum and minimum elevation of areas that can be affected by a SLR of 1.23 m at 95% confidence level.
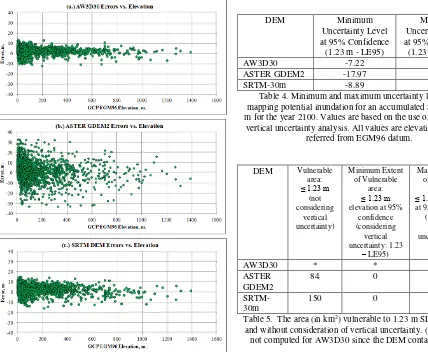
3. RESULTS AND DISCUSSION 3.1 Vertical Accuracies of the DEMs Using All GCPs The calculated errors of the DEMs plotted with the EGM96 elevation of all the GCPs are shown in Figure 4, while the summary of computed error statistics are listed in Table 2. The error plots indicates that there is no clear relationship between
Among the three DEMs, AW3D30 is the most accurate having exhibited the lowest RMSEz while ASTER GDEM2 exhibited the highest RMSEz making it the least accurate (Table 2).
The computed 4.32 m RMSEz of AW3D30 is within the expected vertical accuracy of the ALOS World 3D which is 5 m. In fact, the result is comparable to that of Tadono et al. (2016) where they obtained an RMSEzof 4.40 for the same version of AW3D30 using 5,121 GCPs located in Japan and other parts of the world. On the other hand, the RMSEz computed in this study is slightly higher than the RMSE computed by Takaku et al (2014) in their preliminary assessment of the 5-m version of the DEM where they calculated an RMSEz of 3.94 based on 122 GCPs. An assessment conducted by Santillan and Makinano-Santillan (2016) for AW3D30 covering Northeastern Mindanao, Philippines revealed an RMSEzof 5.68 m which is higher than the one computed in the current study. The reason for this is that Santillan and Makinano-Santillan (2016) used Mean Sea Level (MSL) as the vertical datum of their GCPs, which is approximately above EGM96.
The results for the SRTM-30m shows that its accuracy is better than the expected RMSE of 9.73 m (Mukul et al., 2017).
For the ASTER GDEM2, the computed RMSEz of 9.80 m is comparable to that of Athmania and Achour (2014) when they conducted external validation of the DEM in northeastern Algeria and obtained a similar RMSE value; and to that of Gesch et al. (2012) where they computed an RMSEz of 8.68 based on the comparison of the DEM with more than 18,000 independent reference ground control points located in the conterminous US.
3.2 Vertical Uncertainties of the DEMs Using All GCPs Table 3 summarizes the results of the vertical uncertainty GDEM has the highest uncertainty in their elevation values.
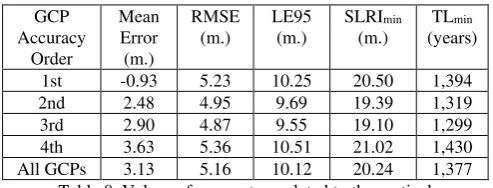
For the SRTM DEM, SLRImin and TLmin were computed as 20.24 m and 1,377 years, respectively. For the AW3D30, SLRImin and TLmin were computed as 16.92 m and 1,151 years, respectively. These results suggest that the readily available global DEMs' suitability for mapping coastal inundations due to SLR in our study area is limited by their low vertical accuracies and high uncertainties.
Users who apply any of these DEMs for SLR impact assessment at SLRIs lower than the DEM’s SLRImin must be cautious in reporting the areas of SLR vulnerable zones. As summarized in Tables 4 and 5, and illustrated in Figures 5 and 6, mapping potential inundations due to SLR of 1.23 m requires not only mapping areas whose elevations are equal to or below 1.23 m. If an SRTM-30 m DEM will be used, it is necessary to map all areas whose elevation ranges from -8.89 m up to 11.36 m. Doing so would incorporate the inherent vertical uncertainty of this DEM. Without considering this DEM’s uncertainty, the total inundated areas will only amount to 150 km2 which may be unreliable and may not provide a complete picture of potential inundation. If uncertainties are considered, this DEM can provide users a range of potential inundated areas, e.g., from 0 to 4,198 km2.
Figure 4. DEM errors plotted versus elevation using all the 2,076 ground control points.
Table 2. Error statistics (in meters) generated from the vertical accuracy assessment of the DEMs using 2,076 ground control
points. All values are in meters
DEM RMSE
Table 3. Computed values of parameters related to the vertical uncertainties of the DEMs based on the use of all GCPs. TLmin was computed assuming an annual SLR rate of 14.7 mm/year.
DEM Minimum
Table 4. Minimum and maximum uncertainty levels for mapping potential inundation for an accumulated SLR of 1.23 m for the year 2100. Values are based on the use of all GCPs in
vertical uncertainty analysis. All values are elevation in meters referred from EGM96 datum. and without consideration of vertical uncertainty. (*Areas were
Figure 5. Map of inundations due to SLR of 1.23 using ASTER GDEM2 with and without considerations of vertical
uncertainties computed using all GCPs.
Figure 6. Map of inundations due to SLR of 1.23 using SRTM 30-m DEM with and without considerations of vertical
uncertainties computed using all GCPs.
3.3 Effects of GCP's Order of Accuracy on the Vertical Accuracies and Uncertainties of the DEMs
The effects of using GCPs that are of different orders of accuracies are illustrated in Figure 7 and summarized in Tables 6 to 8.
For all DEMs, using first order GCPs appears to result to smaller mean errors when compared to using 2nd, 3rd or 4th order GCPs. However, the mean errors resulting from the use of either 2nd, 3rd or 4th order GCPs appears to be of little difference.
The effects of using different GCP orders appears to have minimal effect on the RMSEs (and consequently on the (LE95, SLRImin and TLmin) of AW3D30 and SRTM-30m. However, this observation is not true for ASTER GDEM2 where the RMSE and other measures of vertical uncertainties appears to decrease as the GCP order of accuracy increases. These findings may imply that results and conclusions obtained from vertical accuracy and uncertainty assessments of ASTER GDEM2 is dependent on the order of accuracy of GCPs used but not for AW3D30 and SRTM-30m. However, further investigation is needed to quantify and explain these findings.
GCP Table 6. Values of parameters related to the vertical uncertainties of the AW3D30 computed based on the order of
GCP accuracy. Table 7. Values of parameters related to the vertical uncertainties of the ASTER GDEM 2 computed based on the
order of GCP accuracy. Table 8. Values of parameters related to the vertical uncertainties of the SRTM-30m computed based on the order of
GCP accuracy.
4. CONCLUSIONS
We have presented an assessment of the vertical accuracies and uncertainties of three 30-m resolution global DEMs covering Mindanao Island, Philippines using an approach previously presented by Gesch (2013). Two specific parameters namely, the Minimum Sea Level Rise Increment (SLRImin) and Minimum Planning Timeline or TLmin were quantified which allowed us to take into consideration each DEM's vertical uncertainty in elevation-based SLR vulnerability analysis. The effects of different orders of accuracy of GCPs used in the analysis to the computed uncertainties were also presented.
Based on the results, it is concluded all the three DEMs considered in this study do not have the necessary accuracy and minimum uncertainties that will make them suitable for mapping inundations of Mindanao at smaller increments of SLR (e.g., SLR ≤ 5m). However, in the absence of highly accurate and more detailed elevation data (e.g., from LiDAR), these DEMs may be utilized as long as the uncertainties are taken into consideration, and that the end users are informed accordingly of these limitations. Reporting the inundated areas as a range instead of a singular value for a given SLR scenario can highlight the inherent accuracy and uncertainty of the DEMs used in the assessment.
ACKNOWLEDGEMENTS
This work is one of the extended R&D activities of the Geo-SAFER Mindanao (“Geo-informatics for the Systematic Assessment of Flood Effects and Risks for a Resilient Mindanao”), a research program supported and funded by the Philippine Council for Industry, Energy and Emerging Technology Research and Development of the Department of Science and Technology (PCIEERD DOST). We gratefully acknowledge PCIEERD DOST for the financial support, as well as the Philippines’ National Mapping and Resource Information Authority (NAMRIA) and the Geodetic Engineers of the Philippines Incorporated (GEPI) for giving us access to the ground control points dataset used in this work. ASTER GDEM is a product of METI and NASA. ALOS World 3D 30 original data was provided by JAXA. We would like to thank the anonymous reviewers for their helpful comments and suggestions. Algeria. Remote Sensing, 6(5), pp. 4600-4620.
Cooper, H.M., Fletcher, C.H., Chen, Q., Barbee, M.M., 2013. Sea-level rise vulnerability mapping for adaptation decisions using LiDAR DEMs. Progress in Physical Geography, 37(6), pp. 745-766.
DENR, 1998. DENR Administrative Order No. 98-12, Revised Manual of Land Surveying Regulations in the Philippines. Department of Environment and Natural Resources, http://policy.denr.gov.ph/pol-1998/SrvyMnl.pdf (10 June 2017).
Federal Geographic Data Committee (FGDC), 1998. Geospatial Positioning Accuracy Standards Part 3: National Standard for
Spatial Data Accuracy, 28p. URL:
http://www.fgdc.gov/standards/projects/FGDC-standards- projects/accuracy/part3/chapter3.
Gesch., D.B., 2009. Analysis of Lidar elevation data for improved identifiction and delineation of lands vulnerable to sea-level rise. Journal of Coastal Research., 53, pp. 49-58.
Gesch, D.B.; Gutierrez, B.T., Gill, S.K., 2009. Coastal elevations. In: USCCSP (U.S. Climate Change Science Program), Coastal Sensitivity to Sea-level Rise: A Focus on the Mid-Atlantic Region: A report by the U.S. Climate Change Science Program and the Subcommittee on Global Change Research. Washington, D.C.: U.S. Environmental Protection Agency, pp. 25–42.
and Spatial Information Sciences, Vol. XXXIX-B4, pp. 281-286.
Gesch, D.B., 2013. Consideration of vertical uncertainty in elevation-based sea-level rise assessments: Mobile Bay, Alabama case study. Journal of Coastal Research, 63, pp. 197-210.
JAXA, 2017. ALOS Global Digital Surface Model “ALOS World 3D - 30m (AW3D30)”, Japan Aerospace Exploration Agency, http://www.eorc.jaxa.jp/ALOS/en/aw3d30/ (28 January 2017).
Japan Space Systems, 2015. Features of ASTER G-DEM. http://www.jspacesystems.or.jp/ersdac/GDEM/E/2.html (10 June 2017).
Leon, J.X., Heuvelink, G.B.M., Phinn, S.R., 2014. Incorporating DEM uncertainty in coastal inundation mapping. PLoS ONE, 9 (9), e108727.
Mukul, M., Srivastava, V., Jade, S., Mukul, M., 2017. Uncertainties in the Shuttle Radar Topography Mission (SRTM) Heights: Insights from the Indian Himalaya and Peninsula. Scientific Reports, 7, 41672.
Rietbroek, R., Brunnabend, S.E., Kusche, J., Schröter, J. and Dahle, C., 2016. Revisiting the contemporary sea-level budget on global and regional scales. In: Proceedings of the National Academy of Sciences, Vol. 113, No. 6, pp.1504-1509.
Santillan, J.R., Makinano-Santillan, M., 2016. Vertical accuracy assessment of 30-m resolution ALOS, ASTER, and SRTM global DEMs over Northeastern Mindanao, Philippines. In: The International Archives of the Photogrammetry, Remote Sensing and Spatial Information Sciences, Vol. XLI-B4, pp. 149-156.
Schmid, K., Hadley, B., Waters, K., 2014. Mapping and portraying uncertainty of bathtub-type models. Journal of Coastal Research, 30(3), pp. 548-561.
Tadono, T., Nagai, H., Ishida, H., Oda, F., Naito, S., Minakawa, K., Iwamoto H., 2016. Generation of the 30 m-mesh global digital surface model by ALOS PRISM. In: The International Archives of the Photogrammetry, Remote Sensing and Spatial Information Sciences, Vol. XLI-B4, pp. 157-162.
Takaku, J., Tadono, T., Tsutsui, K., 2014. Generation of high resolution global DSM from ALOS PRISM. In: The International Archives of the Photogrammetry, Remote Sensing and Spatial Information Sciences, Vol. Xl-4, pp. 243-248.
US Geological Survey, 2015. Shuttle Radar Topography
Mission (SRTM) 1 Arc-Second Global.