Implementation of Value Stream Mapping and
Simulation in a Food Factory
Cucuk Nur Rosyidi
1, a, Pringgo Widyo L
2,band Haritsah M Y H
3,c1, 2, 3 Sebelas Maret University, Industrial Engineering Department
Jl. Ir. Sutami No. 36A, Kentingan, Surakarta, 57126 Indonesia
Tel.: +62271632110
a cucuk@uns.ac.id , b pringgo@ft.uns.ac.id , c haritsah.myh@gmail.com
PT. XYZ is a food based company with 13 production lines. PT. XYZ attempts to win market competition by increasing its productivity. One way to increase the productivity is to reduce the waste in the production line using lean manufacturing approach. The focus of this study is Line 3 that produces egg nuts. A number of WIP was found in the frying station of Line 3 which indicates that the company has waste problem. The purpose of this study is to reduce the number of WIP by determining the number of packing machines in production line 3. This research starts with the use of Value Stream Mapping (VSM) which has known as a proven lean tool to map and identify the problems in the company. The simulation is used to compare the current performance of the production line with the proposed ones. The result of this study showed that the optimal number of packing machines are 21 units.
Keywords—VSM, Simulation
I. INTRODUCTION
Nowadays, the growth of food industries in Indonesia would be potential because foods have been a part of human needs. Market of food industries would increase continuously in line with the rate of population growth in Indonesia, which according to the Central Bureau of Statistics in 2012 reached 245.4 millions inhabitants. Not only the staple food, snack needs would also increase. Therefore, food industries must be ready for competition and win the market share.
PT. XYZ is one of many companies that specializes in foods and baverages which located in Pati, Central Java, Indonesia. The company has two factories, Plant A and Plant B. Plant A mainly produces bean-based products such as atom peanuts, egg nuts, roasted peanuts, etc. While Plant B produces flour-based products such as potato chips, pilus, etc. Plant A has six production lines. Line 1 and Line 2 are used to produce atom peanuts. Line 3 is used to produce egg nuts. Line 4 is used to produce curly nuts. Line 12 is used to produce roasted peanuts and Line 13 is used to produce popcorn. The focus of this study is Line 3 that produces local egg nuts (LEN).
There was a problem in LEN production, namely work in process (WIP) waste. The problem arises from the accumulation of products in frying station, because the number of outputs from the frying machine is not balanced with the output number of packing machines.
Lean manufacturing is defined as a tool to identify and eliminate waste or activities that did not give value-added in the design, production, and supply chain management, which relates directly to the customer [1]. There are eight types of waste in industries, namely over production, waiting time, transportation, over-processing, excess inventory, unnecessary movement, defects, and unused employee creativity[2]. Those wastes can be identified using value stream mapping (VSM) [3]. VSM is a description of all activities on the system process in which various activities are performed in the form of value added, necessary non-value added and non-value added to bring a product from raw material to finished goods [4].
Simulation is defined as the process of designing a model of a real system and conducting experiments[5]. A simulation is a model that mimics reality[6]. The key point of all definitions of simulation is that a system is imitated to generate a better understanding and find answers to questions about it[7]. Simulation modeling and experiment are used to validate the future state of a system before implementation[8]. This validation helps to ensure the future state effectively addresses the current state gap.
In this paper VSM as a tool of lean manufacturing is used to identify the problems in production department of Line 3. The simulation method is used to determine the number of packing machines for WIP reduction. Several performance criteria are used in this paper: WIP, utilization, efficiency, and output.
II. METHODOLOGY
This research was carried out in Line 3 of PT. XYZ which produces egg nuts. In the first step, Field observations are conducted directly to observe the real conditions in the line, starting from the raw material of egg nuts until the packing process.
In the second step, the LEN production process data are collected. We collected the following data from the factory:
1) Bill of Material (BOM)
2) Layout of production and work stations
3) Cycle time and lead time data for each station
4) Planned down time data for each station
6) Performance loss data for each station
7) Defect loss data for each station
8) Failure data for each machine
9) Input dan output production data for each station
10)Waste data for each station
11)Number of operators data
In the third step, the collected data from the second step are proccesed as the following:
1) Calculating the value of the takt time for each station. The equation of the takt time for each station is [9]:
T = �
� (1)
When using more than one machine the total takt time is calculated using the following formula:
Tt = 1 1
�1+�21+⋯+��1
(2)
where:
T = takt time (min/kg)
L = machine loading time per shift (min)
O = machine output per shift (kg)
Tt = total takt time for n machines (min/kg)
2) Calculating OEE (overall equipment efficiency) for each station.
The OEE depends on takt time, working time, planned down time, performance loss, down time loss, defect loss, and the real output production. The following formula is used to calculate the OEE[10]:
a) Calculating the working time
WT = Wk – n (3)
b) Calculating the loading time
LT = WT – PDT (4)
c) Calculating the operating time
OT = LT – DTL (5)
d) Calculating the net operating time
NOT = OT – PFL (6)
e) Calculating the value operating time
VOT = NOT – DL (7)
f) Calculating the output of production
Ou = ���
� (8)
g) Calculating the speed loss
SL = Ou - Ro (9)
Because the speed loss unit is in kilograms then converted into minutes with the following formula:
SL(min) = SL(kg) x T (10)
h) Calculating the value operating time after speed loss
VOTt = VOT0 – SL (11)
i) Calculating the OEE
OEE = ����
�� x 100% (12)
where:
OEE = overall equipment efficiency (%)
VOTt = operating time value after speed loss (min)
VOT0 = operating time value before speed loss (min)
SL = speed loss (min)
Ou = output production from calculation (kg)
Ro = real output (kg)
VOT = value operating time (min)
NOT = net operating time (min)
DL = defect loss (min)
OT = operating time (min)
PFL = performance loss (min)
LT = loading time (min)
PDT = planned down time (min)
WT = working time (min)
3) Calculating yield, waste, and loss for each station. In the context of this paper, the term yield means the percentage of good product outputs, while defect product and loss mean the percentage of rejected products and loss of materials during production process respectively. Yield, defect product and loss calculation of each station required production input, production output and production waste. Formula for calculating the yield, defect product, and loss are [9]:
a) Yield formula
Y = �
� x 100% (13) b) Defect product formula
4) Calculating the maximum capacity of each station. The maximum capacity of the machines can be calculated using the following fomula[9]:
K = ��
�� x OEE (16)
where:
K = production capacity per shift (kg)
LT = loading time (min)
5) Developing the VSM
VSM has three important components, namely:
a) The timeline, describes the flow of value added and non-value added activities.
b) The flow of materials from the raw materials warehouse to the finished goods warehouse.
c) Information of the production command, such as supply chain and scheduling.
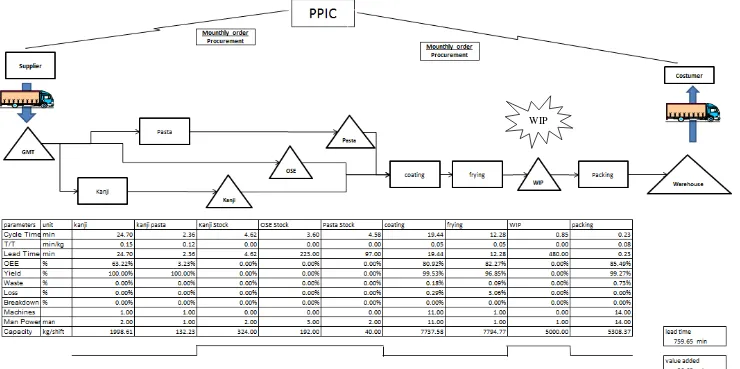
The current state value sream mapping is developed by observing activities of the company from ordering until the finished products are ready to deliver to the consumer. After process flow mapping, the lean matrix data is filled into each process. The VSM of the production process can be seen in Figure 1.
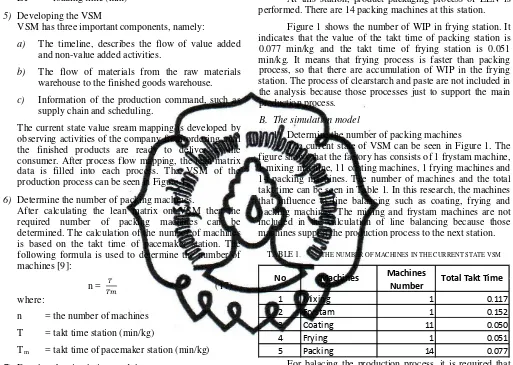
6) Determine the number of packing machines.
After calculating the lean matrix on VSM then the required number of packing machines can be determined. The calculation of the number of machines is based on the takt time of pacemaker station. The following formula is used to determine the number of machines [9]:
Tm = takt time of pacemaker station (min/kg)
7) Develop the simulation model.
After calculating the lean matrix on VSM, the simulation model is developed to evaluate the current and proposed system.
III. RESULT AND DISCUSSIONS
A. Current state VSM
LEN production is performed in 4 stations, namely: 1) Stock preparation station
At this station, raw materials for production are prepared, such as beans and flour. Those materials are mixed in process of clearstarch and paste making that will be used for further process.
2) Coating station
After preparing raw material for LEN production, the next step is to mix the flour and nuts using coating machines. At this station 11 coating machines are used.
3) Frying station
At this station the outputs from coating station are processed. The outputs of coating station are placed on a conveyor that came into the frying machine. Afterwards, the outputs of coating machines are fried for 5-7 minutes. Finally, the outputs of this station will be sent out through conveyor to the packing station.
4) Packing station
At this station, product packaging process of LEN is performed. There are 14 packing machines at this station.
Figure 1 shows the number of WIP in frying station. It indicates that the value of the takt time of packing station is 0.077 min/kg and the takt time of frying station is 0.051 min/kg. It means that frying process is faster than packing process, so that there are accumulation of WIP in the frying station. The process of clearstarch and paste are not included in the analysis because those processes just to support the main production process.
B. The simulation model
1) Determine the number of packing machines
The current state of VSM can be seen in Figure 1. The figure shows that the factory has consists of 1 frystam machine, 1 mixing machine, 11 coating machines, 1 frying machines and 14 packing machines. The number of machines and the total takt time can be seen in Table 1. In this research, the machines that influence to line balancing such as coating, frying and packing machines. The mixing and frystam machines are not included in the calculation of line balancing because those machines support the production process to the next station.
TABLE1. THE NUMBER OF MACHINES IN THE CURRENT STATE VSM
For balacing the production process, it is required that the total takt time of each station approximately the same with the total takt time of the pacemaker station. Table 1 shows the total takt time of packing machines is greater than the total takt time of frying machine, so that WIP in frying station is accumulated. Hence, the frying machines is the pacemaker. The calculation of the number of packing machines will be based on the takt time of pacemaker station. Using equation (17) the number of frying machines is obtained to be 21.36 units.
2) Building the simulation model
FIGURE 3.THE SIMULATION MODEL 3) Determine the number of replications
The minimum number of replication is used to obtain valid conclusions. Absolute error is the difference between the measured value and the true value. The following formula is used to determine the minimum number of replications[11]:
n’= �(�∝/2)�
� �
2
(18) where:
n’ = the minimum number of replications
P = confidance level α = significance level e = absolute error
S = standard deviation
Absolute error is obtained by performing 10 replications, then the average time needed in 1 batch product on simulation is recorded. Equation (18) is used to obtain the minimum number of replications which is found to be 7 replications with 95% confidences level.
4) Determine the warm up period
The system will be simulated for 16 hours by 7 replications and the cumulative number of output per hour will be recorded. The results of the simulation output can be seen in Table 2.
TABLE 2 OUTPUT AVERAGE PER HOUR
From Table 2, we can see that the value of the average output per hour will be in steady state condition in the second hour of simulation. Therefore, the warm-up period is 2 hours.
5) Validation
Validation aims to determine how well the simulation model represents the real system. In this study, the validation is
performed by comparing the real total time of production with the total time output from the simulation.
In this study, validation is performed using a hypothesis test. Since the sample is less than 30, then the t test is used. In this case, the null hypothesis since the p-value is greater then 0.05, the null hypothesis is not rejected.
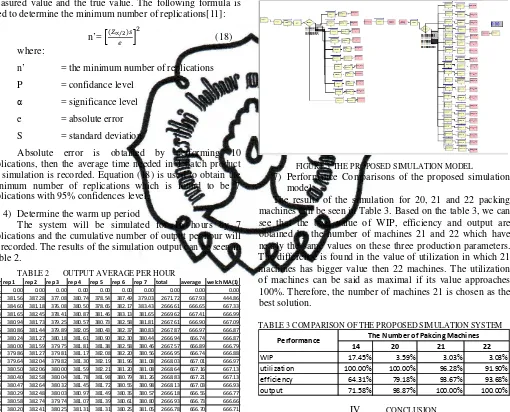
6) The proposed simulation model
Based on takt time calculation, the ideal number of packing machines is 21.36. In this simulation we will compare the performance of Line in term of several production parameters (WIP, utilization, efficiency and output) using 20, 21, and 22 machines. The proposed simulation model can be seen Figure 3.
FIGURE 3 THE PROPOSED SIMULATION MODEL
7) Performance Comparisons of the proposed simulation model.
The results of the simulation for 20, 21 and 22 packing machines can be seen in Table 3. Based on the table 3, we can see that the best value of WIP, efficiency and output are obtained by the number of machines 21 and 22 which have nearly the same values on these three production parameters. The difference is found in the value of utilization in which 21 machines has bigger value then 22 machines. The utilization of machines can be said as maximal if its value approaches 100%. Therefore, the number of machines 21 is chosen as the best solution.
TABLE 3 COMPARISON OF THE PROPOSED SIMULATION SYSTEM
IV. CONCLUSION
This paper discussed the implementation of VSM and simulation model to determine the number of packing machines in PT. XYZ. From the results of analysis it was found that the optimal number of packing machines are 21 units. Altough the selected solution decreases the machines utilization from 100% to 96.28%, it will reduce the number of WIP from 17.45% to 3.03%, increase machines efficiencies
hour rep 1 rep 2 rep 3 rep 4 rep 5 rep 6 rep 7 total average welch MA(1)
1 0.00 0.00 0.00 0.00 0.00 0.00 0.00 0.00 0.00 0.00
2 381.56 387.28 377.08 380.74 378.54 387.49 379.03 2671.72 667.93 444.86
3 384.60 381.18 376.08 380.50 378.65 382.17 383.43 2666.61 666.65 667.33
4 381.65 382.45 378.41 380.87 381.46 383.13 381.65 2669.62 667.41 666.99
5 380.94 381.73 379.25 380.57 380.73 382.58 381.81 2667.61 666.90 667.09
6 380.86 381.44 379.89 382.05 380.43 382.37 380.83 2667.87 666.97 666.87
7 380.24 381.27 380.18 381.61 380.90 382.30 380.44 2666.94 666.74 666.87
8 380.00 381.59 379.75 381.81 381.38 382.58 380.46 2667.57 666.89 666.79
9 379.86 381.27 379.81 381.17 382.08 382.20 380.56 2666.95 666.74 666.88
10 379.64 382.04 379.82 381.30 382.19 381.96 381.08 2668.03 667.01 666.97
11 380.50 382.06 380.00 381.59 382.21 381.20 381.08 2668.64 667.16 667.13
12 380.40 382.58 380.04 381.78 381.98 380.79 381.26 2668.83 667.21 667.13
13 380.47 382.64 380.32 381.45 381.72 380.55 380.98 2668.13 667.03 666.93
14 380.29 382.48 380.03 380.97 381.49 380.35 380.57 2666.18 666.55 666.77
15 380.58 382.74 379.74 381.07 381.39 380.61 380.80 2666.93 666.73 666.66
16 380.20 382.41 380.25 381.31 381.31 380.25 381.05 2666.78 666.70 666.71
14 20 21 22
WIP 17.45% 3.59% 3.03% 3.03%
utilization 100.00% 100.00% 96.28% 91.90%
efficiency 64.31% 79.18% 93.67% 93.68%
output 71.58% 98.87% 100.00% 100.00%
from 64.31% to 93.67% and maximize output production from 71.58% to 100%.
REFERENCES
[1] V. Gasperz, Lean Six Sigma for Manufacturing and Service Industries, Vinchristo Publication: Bogor, 2011.
[2] J. K. Liker and D. Meier, The Toyota Way Fieldbook, Jakarta: Erlangga, 2006.
[3] S. Kalpakjian and S. Schmid, Manufacturing engineering and technology, 5th ed, Prentice Hall: 1227-1228, 2006.
[4] P. Hines and D. Taylor, “Going Lean”, Proceeding of Lean Enterprise Research Centre Cardiff Business School, UK, 2000
[5] C. D. Pegden, R. E. Shannon, and R. P. Sadowski, Introduction to Simulation Using SIMAN, 2nd ed, McGraw-Hill, USA, 1995
[6] S. Robinson, Successful Simulation: A Practical Approach to Simulation Project, McGraw-Hill Book Company Europe, Berkshire, England, 1994.
[7] P. Solding and P. Gullander, Concept for Simulation Based Value Stream Mapping, Proceeding of the 2009 Winter Simulation Conference, 2009.
[8] J. H. Marvel and C. R. Santridge, A Simulation-enhanced lean design process, Journal of Industrial Engineering and Management, 2009. [9] T. Ohno, Toyota Production System: Beyond Large-Scale Production,
Productivity Press, ISBN 978-0-915299-14-0, 1998.
[10] S. Nakajima, Introduction to TPM (Total Productive Maintenance), Productivity Press, Inc, Cambridge, MA, 1988.
[11] C. Harrel, Simulation Using Promodel, McGaw-Hill, 2000.
Figure 1. Current State Value Stream Mapping