RESEARCH PAPER
Submitted as requirement to obtain degree of Sarjana Pendidikan in International Program on Science Education Study Program
Created By: Rizal Syafrudin
0902146
INTERNATIONAL PROGRAM ON SCIENCE EDUCATION FACULTY OF MATHEMATICS AND SCIENCE EDUCATION
The Effect of 5E Learning Cycle
Model to Improve Student’s
Learning Achievement in Pollution
and Environmental Damage
Oleh Rizal Syafrudin
Sebuah skripsi yang diajukan untuk memenuhi salah satu syarat memperoleh gelar Sarjana Pendidikan (S.Pd.) pada Fakultas Pendidikan Matematika dan Ilmu
Pengetahuan Alam
© Rizal Syafrudin 2014 Universitas Pendidikan Indonesia
Maret 2014
Hak Cipta dilindungi undang-undang.
APPROVAL FORM OF RESEARCH PAPER RIZAL SYAFRUDIN
0902146
THE EFFECT OF 5E LEARNING CYCLE MODEL TO IMPROVE STUDENT’S LEARNING ACHIEVEMENT IN POLLUTION AND
ENVIRONMENTAL DAMAGE
APPROVED AND AUTHORIZED BY: Supervisor I
Agus Fany Chandra Wijaya, M.Pd. NIP. 198108122005011003
Supervisor II
Lilit Rusyati, S.Pd., M.Pd. NIP. 198704202012122001
Head of Study Program of
International Program on Science Education
Rizal Syafrudin,2014
THE EFFECT OF 5E LEARNING CYCLE MODEL TO IMPROVE STUDENT’S LEARNING ACHIEVEMENT IN
CHAPTER III
RESEARCH TETHODOLOGY
A. Location, Subject and population of Research
Population of this research is all classes in grade 7 one of junior high school in Bandung. The sample is 7A class consists of 28 students on pollution and environmental damage chapter. The sampling technique of this research is purposive sampling. The research was conducted in one of Junior High School in Bandung which applied national curriculum in learning process. The data collection was done in November 2013.
B. Research Design
The type of research design which is used in this research is quantitative method. Quantitative here is weak experiment on implementation of 5E Learning Cycle Model in concept of pollution and environmental damage to improve student learning achievement. This method is used because this method is the most suitable to the condition which the study subjects were examined only in one class and does not use using class comparison (Arikunto, 2006). The quantitative data is gained from the pretest and posttest while another data from questionnaire .Design used in this study was one group pretest-posttest design (Fraenkel and Wallen, 2008). Designs can be described as follows:
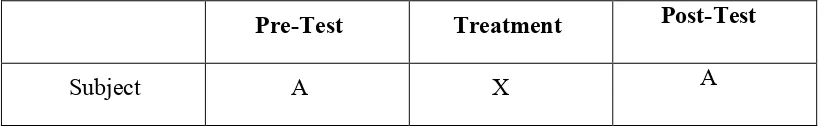
Table 3.1 The One Group Pretest-Posttest Design
Pre-Test Treatment Post-Test
Description:
A : Multiple choice tests
X : 5E Learning Cycle Model
There are three steps taken in this design are:
1. Provide pre-test to measure student achievement in concept of pollution and environmental damage before implementation learning model.
2. Implementation of 5E Learning Cycle Model in pollution and environmental damage.
3. Provide post-test to measure student achievement in concept of pollution and environmental damage after treatment.
The difference is in the value of the difference between the initial test and final test is assumed to be the effect of 5E Learning Cycle Model in pollution and environmental damage concept to develop student achievement concept.
Rizal Syafrudin,2014
Implementation: 5E Learning Cycle Model
Figure 3.1 Diagram of Research Plot
Procedure of research is arranged based on the syntax of 5e learning cycle model. There are three stages of procedure consists of preparation stage, implementation stage, and analysis and conclusion stage. The procedure could be explained as follows:
1. Preparation Stage
In this stage, the researcher conduct several steps that support the research, there are:
a. Formulating problem that will be investigated, in this step there are problem that must be solve, so this research would solve problem in learning about concept in pollution and environmental damage.
b. Determining the focus of variable research
c. Conducting literature review of pollution and environmental damage concept, 5e learning cycle model, and curriculum.
d. Arranging the research proposal which is presented in proposal seminar
e. Revised of research proposal after having suggestions and critics from lecturers.
f. Arranging the research instrument and being judged by expert or lecturer. Instrument that used are multiple choice test that measured concept achievement, questionnaire to measured student respond in implementing 5e learning cycle model and e-book of ipse, and note observation to observe student activity in implementation of 5e learning cycle model.
g. Arranging instructional tool which are including lesson plan, module, worksheet of pollution.
Rizal Syafrudin,2014
i. Testing of research instrument, researchers implement this step to 7th grade of junior high school of Laboratorium Percontohan UPI.
j. Revised of research instrument based on instrument try out analysis result
2. Implementation stage
During implementation stage, it will be observed the implementation of 5e learning cycle model. Implementation conducted several stages that includes:
a. Determining the class that used for experimental class, in this stage researcher used 7th grade students consist of 28students.
b. Giving pretest that conducted to measure student prior knowledge before implementation of 5e learning cycle model.
c. Collecting pretest data and processing pretest result.
The implementation of 5e learning cycle model could be explained as follows: 1) First Meeting, teacher show the demonstration and picture about pollution
and environmental damage concept then ask to students about the picture and the demonstration, form groups consist of 7 students in a group then give problem in form of picture and ask to all of group present their result of discussion, and conclude about the material that has been learned. In the end of learning teacher give task to students, they have to find out pollution and environmental damage in their surrounding or home and find out about greenhouse effect, acid rain, ozone hole based on e-book that given by the teacher, teacher ask to students work in group and make report and collected next meeting, teacher share the e-book to the students. 2) Second meeting, teacher ask to all of group present their work in front of
d. Give posttest that conducted to measure student learning achievement after implementation of 5e learning cycle model.
e. Give questionnaire to know the student’s response towards implementation of 5e learning cycle model and e-book of ipse in the whole learning.
3. Final stage a. Data Analysis
All Data is collected and then data is analyzed and make some discussion in Implementation of 5e learning cycle model in concept of pollution and environmental damage to improve student learning achievement.
b. Conclusion
After analyze the data, it make conclusion about implementation of 5e learning cycle model in concept of pollution and environmental damage to improve student learning achievement.
C. Operational Definition
Explanation of the term is intended to describe the meaning of the various concepts used in this study, so hopefully will not cause different interpretations.
1. Learning cycle 5E is the sequence for teaching and learning process. The five phases of that learning cycle included: Engagement, Exploration, Explanation, Elaboration, and Evaluation Invention and Discovery (Bybee 1997). The implementation of 5e learning cycle model will be measured by observation sheet.
Rizal Syafrudin,2014
is to observe, to read, to initiate, and to try something themselves, to listen, to follow direction". According to Nurkencana (1986: 62) argues that learning achievement is a result that has been achieved or acquired by the students as a value of each subjects. This research will measure the cognitive achievement of students based on Bloom’s Taxonomy cognitive domain, the following stages: C1 (Remembering), C2 (Understanding), C3 (Applying), C4 (Analyzing). The learning achievement will be measured by multiple choice tests.
D. Instructional Tool
Instructional tool that is used in the implementation of this research are enlisted as follow:
1. Lesson Plan
Lesson plan is design of instructional arrangement that will be used in the implementation of 5e learning cycle model. There are mainly five sequences that should be conducted in 5e learning cycle model there are: Engagement, Exploration, Explanation, Elaboration, and Evaluation. Lesson plan arranged according to learning objective stated in national curriculum for concept of pollution and environmental damage. Accordingly arrangement of lesson plan can be seen in appendix
E. Research Instrument
The instrument used to obtain the data in this study consists of: 1. Objective test
Objective test in a form of pretest and posttest. This test is used to measure students’ learning achievement before and after treated 5E Learning Cycle Model in concept of environmental pollution and damage.
Questionnaire in this study is designed to determine students' responses to 5e learning cycle model and e-book that has been applied as well to know the advantages and disadvantages.Draft of Questionnaire can be seen in appendix. 3. Observation Sheet
Note observations used to observe implementation phases implementation of 5e learning cycle model. This is used to obtain the data of teacher activity and student activity during learning process. Draft of Observation sheet can be seen in appendix.
F. Process of Instrument Development
This research was conducted using a test instrument in writing in the form of multiple choice, questionnaire, and observation sheets. Before the first test item made lattice prepared to determine the suitability of indicators about the mastery of concepts and contents lattice with the test item. The instrument needs to be consulted (judgment) by the concerned lecturer and some experts in related fields. After being judged, the instrument which is not appropriate enough should be revised. After the instrument revised, it should be tried out on another class which has the same level of research sample. Based on the test results, the instrument questions will be analyzed with the following requirements:
1. Instrument Test Requerments a. Questions Validity Test
Rizal Syafrudin,2014
had been getting the concept to be taught. According Arikunto (2009) a data or information can be said to be valid in accordance with our actual results. The test is called valid if the test can measure what it intends to measure. Validity is sought is the validity item. Technique that used to measure the validity of the test is the product moment correlation technique proposed by Pearson. Here is the Pearson product moment correlation formula:
rxy= n
xy (
x)(
y )[n
x2(
x) 2 }{n
y 2 (
y ) 2 ](Sudjana, 2005)
Description:
rxy = correlation coefficient between variables x and y variables
n = number of participants test
X = score of students at each items
Y = total score
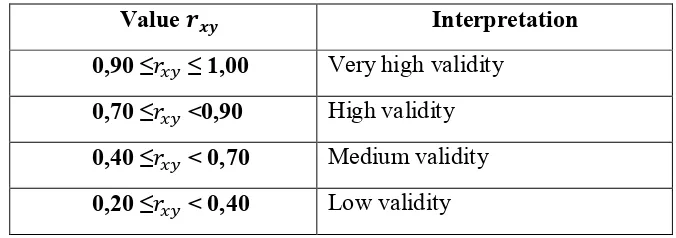
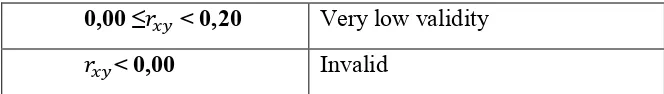
Interpretation about will be divided into different categories based on Guilford (Arikunto, 2010).
Table 3.2 Classification Validity Coefficient
Value Interpretation
0,00 ≤ < 0,20 Very low validity < 0,00 Invalid
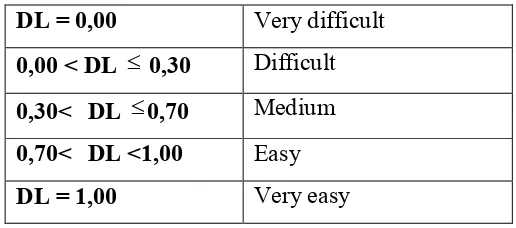
b. Test of Difficulty Level
In test of difficulty level, researcher separated two subgroups of test; an upper group consisting of the top (27%) of the total group who received the highest scores, and a lower group including an equal number of tests (27%) who received the lowest scores. The researcher also counted the number of times each response to each item is chosen correctly on the test of the upper group and does the same separately for the papers of the lower group. So, it intended to calculate the difficulty level of each item. It means as Gronlund (1976:211) remarks “the percentage of students who got the item right”; so, in order to find out the level of difficulty for each item in the test, the following formula has been used:
Sample
Table 3.3 Coefficient Classification of Difficulty Level
Rizal Syafrudin,2014
c. Discriminating Power
Calculating the item discrimination power which can be defined as the degree to which an item test discriminates between students with high and low achiever. Discriminating power of test item is the ability of test item to distinguish between a high achiever and low achiever student (Arikunto, 2006). So, to obtain the discrimination power of the items, the following formula has been used:
T
RU = The number of tests in the upper group who got the item right. RL = The number of tests in the lower group who got the item right.
T = The total of tests included in item analysis.
Classification of discriminating power interpretation used is: (Arikunto, 2006):
d. Reliability Test
Reliability according to the Word (2000) is a measure of the extent to which a measuring instrument gives a completely reliable about ability of a person. If the measuring instrument has a high reliability of the measurements were performed repeatedly with the measuring instrument to the same subject in the same condition in the same conditions will produce the same information or the same approach. One of the ways to calculate the reliability of a test without splitting the two tests is by using the Kuder-Richardson 20 formula, with the formula:
= [1 −∑ ]
Description:
k = number of question
p = proportion of correct responses to a question q = proportion of incorrect responses to a question s2 = variance of test scores
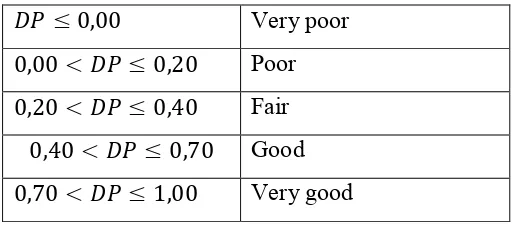
Table 3.5 Classification of Reliability Coefficient
≤ 0,00 Very poor
0,00 < ≤ 0,20 Poor
0,20 < ≤ 0,40 Fair
0,40 < ≤ 0,70 Good
Rizal Syafrudin,2014
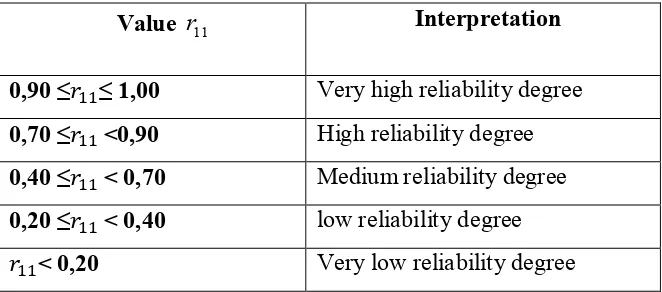
Value r11 Interpretation
0,90 ≤ ≤ 1,00 Very high reliability degree 0,70 ≤ <0,90 High reliability degree 0,40 ≤ < 0,70 Medium reliability degree 0,20 ≤ < 0,40 low reliability degree
< 0,20 Very low reliability degree
e. Instrument analysis result
1) Recapitulation of Students’ Learning Achievement Instrument
The instrument for measuring students’ learning achievement is by giving a multiple choice test in a form of twenty questions. The instrument should be tested in terms of validity, reliability, discriminating power and difficulty level, as explained before. The test was given to 28 students which have learned about the chapter that will be learned for the research. The recapitulation of test item analysis is shown in the following table.
Reliability: 0.63 (Medium reliability degree)
Table 3.6 Recapitulation of Test Item for Students’ Learning Achievement
Question
Number Discriminating Power Difficulty Level Validity Status
1 Poor Very easy Invalid Not Used
2 Poor Very easy Invalid Not Used
3 Poor Easy Very low Revised
5 Poor Very easy Invalid Not Used discrimination power is fair, poor, very porr and validity is low, very low level so it should be revised, question number 4, 6, 7, 8, 12, 15, 18, 19,23, 27, 28 are used because discrimination power is good, very good and validity is medium so for this question is accepted.
2) Instrument non-test requirements a) Questionnaire
Rizal Syafrudin,2014
damage chapter during the lesson and e-book of ipse. This data obtained from students’ answer from 15 questions of each questionnaire given in the end of the lesson.
G. Data Collection Technique
In this research, there are four different data which is collected, those data has different instrument to measure. The data collection techniques are explained as follow:
1. Data of Student Cognitive Achievement
The students’ cognitive achievement is the main data of the research. This data will be collected through objective test in form of multiple choice consist of 20 questions. The cognitive achievement that will be measured is only in pollution and environmental damage chapter. The result will be collected then analyzed using the normalized gain formula.
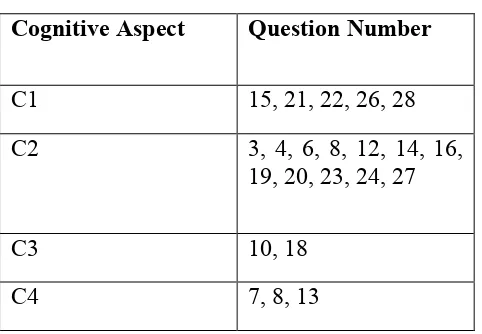
Table 3.7 Multiple Choice Test Item Specification (Blue Print)
Cognitive Aspect Question Number
C1 15, 21, 22, 26, 28
C2 3, 4, 6, 8, 12, 14, 16,
19, 20, 23, 24, 27
C3 10, 18
C4 7, 8, 13
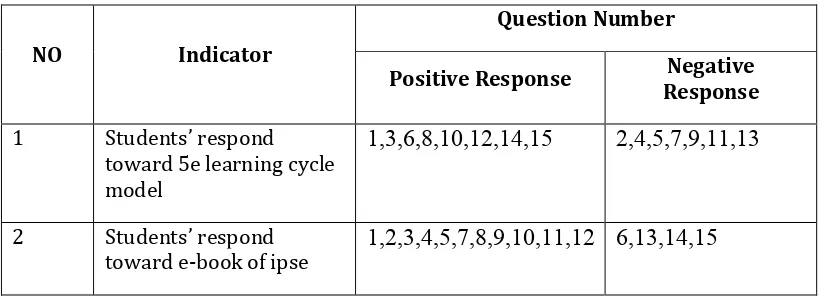
Data of students’ response was used to determine the response of the students towards students’ learning in pollution and environmental damage chapter of in implementing 5e learning cycle model. The data obtained from the questionnaire is a secondary instrument, and it is processed by a percentage calculation. The blue print of students’ response questionnaire is shown in table as follows:
Table 3.8 Specification Students’ Response Questionnaire
NO Indicator
Question Number
Positive Response Response Negative
1 Students’ respond
toward 5e learning cycle model
1,3,6,8,10,12,14,15 2,4,5,7,9,11,13
2 Students’ respond
toward e-book of ipse 1,2,3,4,5,7,8,9,10,11,12 6,13,14,15
H. Data Analysis Technique
As stated Patton (in Hasan, 2010) data analysis is "the process set the order of the data, organizing it into a pattern, category and description of the basic unit." Stages of data analysis includes:
1. Quantitative Data Processing
Rizal Syafrudin,2014
a. Score of Multiple Choice test
Multiple choice score has 5 point for correct answer and 0 point for incorrect answer each of item. The criteria of scoring will be determined by correct and incorrect answer of student itself.
b. Calculation of Gain Score and Normalized Gain
Calculating of gain score student that occur before implement 5e learning cycle model and after implement 5e learning cycle model. The difference in pretest scores and the post-test is assumed as the effect of implementation of 5e learning cycle model. Normalized gain calculations are intended to determine the categories of students’ improvement.
The effectiveness implementation of 5E Learning Cycle model in improving students’ learning achievement of pollution and environmental damage chapter will be seen from the result of the normalized gain that achieved by students during the learning process. For the calculation of the normalized gain value and its classification will use equations (Hake, 1999) as follows:
The value of normalized gain <g> which is already gained is interpreted with the classification of Table 3.11.
Table 3.9 Interpretation of Normalized Gain Value Value g Classification
g 0,7 High
0,7 >g 0,3 Medium
g< 0,3 Low
(Hake, 1999)
2. Qualitative Data Processing a. Observation Sheet
Analyze observation sheet to get description about implementation of 5e learning cycle model in pollution and environmental damage concept. Here it can be seen from teacher activity and students’ activity during learning process. From these data will also conclude the advantages and disadvantages the implementation of 5e learning cycle model.
b. Processing of Questionnaire
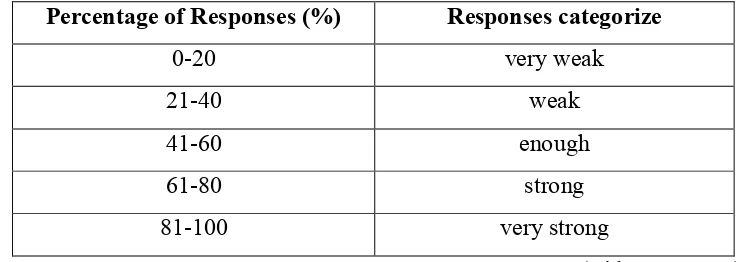
Data of questionnaire results of student responses were analyzed descriptively quantitative to presents the results of students 'response toward 5e learning cycle model and students’ response toward e-book of ipse. Questionnaire sheet of student responses is arranged based on criteria of assessment Likert scale (Riduwan, 2008). Analyses were conducted by using the response percentage formula:
Rizal Syafrudin,2014 Description
P: Percentages of respondent answer
F: Total of respondent answer
N: Total respondent
From the results of the response percentage, and then inserted into the data interpretation student response in table are:
Table 3.10 Interpretation Student Response
Percentage of Responses (%) Responses categorize
0-20 very weak
21-40 weak
41-60 enough
61-80 strong
81-100 very strong
CHAPTER V
CONCLUSION AND RECOMMENDATION
A. Conclusion
Based on research the result of implementation of 5e learning cycle model
in concept of pollution and environmental damage show that student learning
achievement is improve, it is indicated by average score of normalized gain <g>
as much as 0.61 which categorized as medium improvement . It is acquired some
conclusions as follows:
1. The effect of 5e learning cycle model can improve students’ learning
achievement. It is indicated by result of students’ activity during
implementation and students’ cognitive domain. In result of students’ activity that shown highest level of learning cycle is elaboration phase
and evaluation phases and in students cognitive domain that shown
highest level is C2 (Understanding). It means there are effect between 5e
learning cycle model and student learning achievement and also
improvement.
2. Respond of student toward implementation of 5e learning cycle model
show positive respond, it is indicated by the result which categorized is
very strong. It means students agree that 5e learning cycle model can
make understand science concept, fun and enjoy, make more sensitive to
natural world problem, and can give good solution about natural world
problem.
B. Recommendation
Considering that the implementation is still need to be developed in a way
1. Requiring experiment class and control class to make researcher easy to
compare with other model.
2. In this study 5e learning cycle model can be implemented in short
meetings. It is to avoid the schedule from disorganized become organized,