ICSAFEI-173
“The 7
thInternational Conference on Sustainable Agriculture for Food, Energy and Industry in
Regional and Global Context, ICSAFEI2015”
Comparing Instantaneous Yield from Combine Yield Monitor against Crop
Cut Test Estimated Yield
Renny Eka Putri
a*, Azmi Yahya
a, Nor Maria Adam
b, and Samsuzana Abd Aziz
ba Department of Biological and Agricultural Engineering, Faculty Engineering,
University Putra Malaysia, 43400 Serdang, Selangor D. E., Malaysia
b Department of Mechanical Engineering, Faculty Engineering,
University Putra Malaysia, 43400 Serdang, Selangor D. E., Malaysia
Abstract
Yield map accuracy is an important element for the successful implementation of precision farming practices. Incorrect yield monitor readings cause errors in the yield maps, which lead to inaccurate management decisions. Two methods, namely instantaneous yield from on-board yield monitoring system mounted on combine harvester and estimated yield from Crop Cutting Test (CCT) method were used in this study to determine the yield variability that exists within a rice plot foe two cropping seasons. The yield monitoring system was designed to measure the instantaneous harvested crop yield during the actual harvesting of the crop with the combine within the individual rice plots. The CCT method was conducted based on a total of 20 sampling points from a 30 m x 18 m sampling grid within the individual plots prior to the harvesting operation with the combine. Analysis was conducted to determine the closeness of fit between instantaneous yield with estimated yield within the test plots. Some similarities could be seen in in the yield variable plots from the yield data obtained from the two determination methods. The Pearson's correlation coefficients between the two yield data were found to be in the range of 0.69 to 0.83. Conclusively, the developed yield monitoring system on-board the rice combine was able to provide measurements with good accuracy not only on the total crop yield of the harvested plot but also the crop yield variability within the plot.
Keywords:Instantaneous Crop Yield; Estimated CCT CropYield; .
1. Introduction
Development and practical use of yield monitoring in grain combine harvesters has been conducted throughout the years (Arslan et al., 1999, 2002; Al-Mahasneh et al., 2000; and Chosa et al., 2002, 2006; Shoji et al., 2005). The yield monitoring system was used during harvesting operation to determine the yield variability within the harvested paddy area. In yield monitoring, measurements of instantaneous flow of collected clean grain at the grain tank was collected and then plotted against spatial coordinate to generate a crop yield map. Relating the yield map with other input maps may reveal the root causes of low yield at the relevant location with the paddy field. Following from th analysis, actions could be taken within critical regions of the paddy to improve yield for the upcoming crop cropping seasons.
2
grain flow. However, the use of force-impetus flow sensor on the combine harvesters for measuring grain flow had been widely reported to give low measurement accuracy by previous researchers. It was due to the impact force measurement by flow sensor which was much dependent on both the physical properties and impact trajectory of
the materials that were thrown by the grain elevator paddle as the paddle moves to it’s top position. Ideally, all the
grains moved by the elevator paddle should hit the surface of the impact plate in order for the sensor to register the actual grain mass flow rate. Similarly, the dielectric moisture sensor that was normally installed at the grain elevator to measure grain moisture content was made based only on sampling basis.
The use of microwave technology has been considered in the study because of it high precision for on-line measurements of grain mass flow and grain moisture content in replacement of the strain gage technology for the impact type sensor for the measurement of grain flow and dielectric technology for the capacitance type sensor for the measurement of grain moisture content. However, proper calibration investigation must be conducted to improve the sensors measurement precision and accuracy prior to their usage on a combine harvester for in-field monitoring crop yield and grain moisture content.
Ju (2011) developed a simple, portable and rugged instrumentation system that could be directly used on any rice combine harvester from different makes and models to monitor, measure and record in real-time the harvested crop yield. The system was developed as part of the Precision Farming for Rice Cultivation Research Program under the Department of Biological and Agricultural Engineering at Universiti Putra Malaysia. The basis of the technology, a microwave solid flow sensor was used in place of the more common force-impetus sensor. In the study, a mild steel chute mounted with the relevant microwave type flow sensors were positioned at the end of the clean grain auger to measure the mass flow rate and moisture content of the grain transferred by the auger into the grain tank. The on-board yield monitoring system on the combine harvester was able to monitor and measure the instantaneous harvested crop yield within the individual paddy plots.
Currently, most of the yield monitoring systems does not quantify measurement errors and therefore the true accuracies of the yield sensors are not known. Crop cut test (CCT) is one of the available techniques normally used to verify the reliability of the instantaneous crop yield map produced from a yield mapping system. In other words, CCT could to be employed to quantify the measurement accuracy of the available sensors that make-up the yield monitoring system on a come. By comparing yield data recorded by the yield monitoring system on-board the combine against yield data from CCT from the same harvested rice plots, the accuracy of the produced yield map from the monitoring system could be check. Rice plant samples for the CCT were taken manually from the field plot a day before the actual harvesting of the field plot with the combine with the yield monitoring system. The objective of this study was to quantify the measurement accuracies of the earlier developed yield monitoring system for rice combine by Ju (2011).
* Corresponding author. Tel.: +603-894466421; fax: +603-894466425 E-mail address:[email protected]
2. Material and Methods
2.1 Description of Study Area
This study was conducted in the rice fields at Blok E5 Parit Timur 5 of Sungai Besar, Selangor at latitude 3o 41'
30.187" N and longitude 101o 01' 41.877" E location. The rice area is located on a flat coastal plain under the
Integrated Agricultural Development Authority (IADA) Rice Granary within the district of Kuala Selangor and Sabak Bernam. The district of Sungai Besar is well known as one of the main rice growing area in Malaysia. Three rice plots with an individual size of 1.09 ha were randomly selected from the 40 available rice plots within the Parit 5 rice area of Sungei Besar. Field observations and data collection on the selected rice plots were done in two consecutive rice cropping seasons.
3
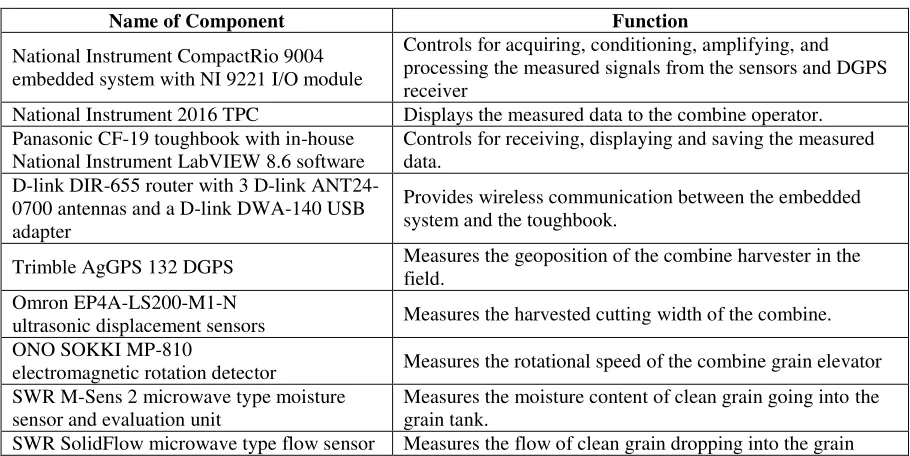
The developed instrumentation system on-board the combine as in figure 1 was make-up of the sensing components for measuring and monitoring combine travel speed, combine cutting width, combine elevator rotational speed, combine geo-position, the flow and moisture content of the clean harvested grain by the combine. The detail functions of the related components within the developed instrumentation system are summarized in table 1.
Fig 1. Monitoring instantaneous yield at on-ground workstation with the instrumentation system on-board the come.
Table 1. Detail components of the instrumentation system and their respective functions
Name of Component Function
National Instrument CompactRio 9004 embedded system with NI 9221 I/O module
Controls for acquiring, conditioning, amplifying, and processing the measured signals from the sensors and DGPS receiver
National Instrument 2016 TPC Displays the measured data to the combine operator. Panasonic CF-19 toughbook with in-house
National Instrument LabVIEW 8.6 software
Controls for receiving, displaying and saving the measured data.
D-link DIR-655 router with 3 D-link ANT24-0700 antennas and a D-link DWA-140 USB adapter
Provides wireless communication between the embedded system and the toughbook.
Trimble AgGPS 132 DGPS Measures the geoposition of the combine harvester in the field.
Omron EP4A-LS200-M1-N
ultrasonic displacement sensors Measures the harvested cutting width of the combine. ONO SOKKI MP-810
electromagnetic rotation detector Measures the rotational speed of the combine grain elevator SWR M-Sens 2 microwave type moisture
sensor and evaluation unit
Measures the moisture content of clean grain going into the grain tank.
4
and evaluation unit tank.
HONDA EU20i generator set with the power distribution box on board
Provides the input power to run the individual units within system.
Source: Yahya et al. (2010)
A special housing box was constructed to keep the National Instrument Compact Rio 9004 embedded system with NI 9221 I/O module, National Instrument touch panel component (TPC2016), Trimble AgGPS 132 DGPS receiver, two evaluation units for the SWR Solid Flow flow sensors and SWR M-Sens 2 moisture sensor. The TPC 2016was flush mounted on front wall of the box with its LCD screen exposing outside. The CompactRIO cRIO-9004 embedded system is a portable rugged industrial computer which is designed for the field applications. The D-link DIR-655 router with 3 D-link ANT24-0700 antennas and Trimble AgGPS 132 DGPS antenna were fixed on the operator console roof using special magnetic supports. The Honda EU20i generating set was fixed at the rear left side of the combine while the power distribution box was located behind the driver seat in the operator console so that it was at close vicinity to the special housing box. The two units of Omron EP4A-LS200-M1-Nultrasonic displacement sensors were located at each sides of the combine header to measure the cutting width of combine during harvesting operation. The ONO SOKKI MP-810 electromagnetic rotation detector was directed coupled to the drive shaft of the grain elevator unit of the combine. An elbow chute unit was located right at the end of the clean grain auger to receive the grains that flow out into the clean grain tank. The SWR M-Sens 2 moisture sensor was positioned at the bottom of the horizontal portion of the elbow shape chute unit while the SWR SolidFlow flow sensor was positioned at the side of the vertical portion of the elbow shape chute unit. The measured data from the embedded system was wirelessly transferred through the router on-board the combine to the receiver adaptor on the toughbook at the ground workstation
All the measured data by the embedded system was made to display on the TPC 2016 for the interest of the operator on the combine. Concurrently, all the measured data received by the toughbook was also made to display on the monitor screen of the toughbook for the interest of the controller at the ground base station and subsequently stored inside the hard disk of the toughbook. Both the TPC 2016on the special housing box and the monitor of toughbook were programmed using Lab view Program to display the universal time coordinated (UTC) time, local time, latitude, north/south (N/S) indicator, longitude, east/west (E/W) indicator, position fix, satellites used, horizontal dilution of precision (HDOP), altitude, DGPS station ID and checksum of DGPS system, left crop position distance, right crop position distance, combine cutting width, grain flow, instantaneous crop yield, total grain, combine elevator rotational speed, grain moisture content and combine travel speed. The saved data in the hard disk of the toughbook were in ASCII format and these data could be retrieved using Microsoft Office Excel, Notepad or WordPad for the purpose of post processing the measured data.
2.3 Estimated Crop Yield Using Crop Cut Test (CCT) Method
5
estimated crop yield within the 0.3 m square for the sub block. Arc GIS 10.1 was used to produce the estimated yield of the plots based on the obtained estimated yield data and the corresponding geoposition locations at the 20 sampling points within the plot.
2.4 Instantaneous Yield Measured from Instrumentation System The combine with the on-board instrumentation was used in the harvesting operations to record the instantaneous yield in unit of tons per hectare for plots 15467, 154661 and 1552. The harvested tonnage rate was calculated from flow rate sensor in kilograms per hour and the area of cut in m2 which was calculated from the cutting width in meter multiplied by the travelled
speed of the combine. With the sampling interval set at one second interval on the instrumentation system, the recorded data would able to show very high spatial variability on the measured instantaneous yield that existed within the harvested plots. However, in order to minimize the variability and to give a much better sense on the plotted yield map, plotted map of instantaneous yield from Arc GIS 10.1 was divided into 20 equal sub blocks. Zonal statistics in the software was then used to get the average instantaneous yield value of each sub block within the plot. Finally, these obtained average instantaneous yield values for each sub-block within each plot were used in producing the yield map of the plot and also in the subsequent statistical analysis.
3. Results and Discussion
3.1. Statistical Analysis of Instantaneous Yield and Estimated Yield
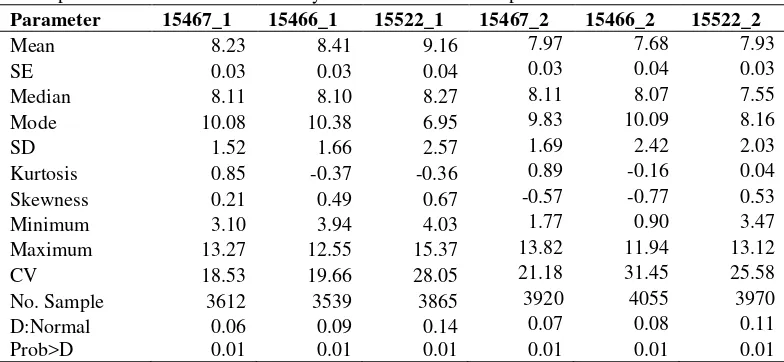
The descriptive statistical summary on the instantaneous yield for first and second seasons of the three plots, namely lot 15467, lot 15466, and lot 15522 is presented in Table 2. Designation 15467_1 refers to lot 15467 for the first season while 15466_2 refers to lot 15466 for the second season, and so forth for the others.
Table 2. Descriptive statistics of instantaneous yield the associated rice plots first season.
Parameter 15467_1 15466_1 15522_1 15467_2 15466_2 15522_2
Mean 8.23 8.41 9.16 7.97 7.68 7.93
SE 0.03 0.03 0.04 0.03 0.04 0.03
Median 8.11 8.10 8.27 8.11 8.07 7.55
Mode 10.08 10.38 6.95 9.83 10.09 8.16
SD 1.52 1.66 2.57 1.69 2.42 2.03
Kurtosis 0.85 -0.37 -0.36 0.89 -0.16 0.04
Skewness 0.21 0.49 0.67 -0.57 -0.77 0.53
Minimum 3.10 3.94 4.03 1.77 0.90 3.47
Maximum 13.27 12.55 15.37 13.82 11.94 13.12
CV 18.53 19.66 28.05 21.18 31.45 25.58
No. Sample 3612 3539 3865 3920 4055 3970
D:Normal 0.06 0.09 0.14 0.07 0.08 0.11
Prob>D 0.01 0.01 0.01 0.01 0.01 0.01
SE: Standard Error, SD: Standard Deviation, and CV: Coefficients Variance
6
distribution test for the measured attributes by the instrumentation system. The D Normal statistic in the tables suggest data set is normally distributed while alternately Prob>D test uncertainly to whether the data are normally distributed. Probability statistic is range between zero to 1 with the value closed to zero indicating that the data are not from a normal distribution. A second method of determining normality is by analyzing the statistical distribution of the data set. A data set is normally distributed if the mean, mode and median are equal, the frequency distribution is symmetrical and smooth “bell-shaped”, and finally if both the kurtosis and skewness values for the distribution are zero. Skewness is positive if the “bell-shape” leans more to the left side than for a normal distribution and negative if the “bell-shape” leans more to the right side than for a normal distribution. Kurtosis is positive if the tails of the “bell-shaped” are heavier than for a normal distribution and negative if the tails of the “bell-shaped” are lighter than for a normal distribution (Sandra and Ramon, 1987).
Results of the statistical test shows instantaneous yield data for three associated rice lot from the two growing seasons tend to follow a normal distribution. Lot 15467 showed right skewed distributions having heavy tails in both growing seasons. Lot 15466 showed right skewed distribution having light tails in first season, while showed left skewed distribution having light tails in second season. Whereas instantaneous crop yield data sets for lot 15522 showed right skewed distributions having light tails in first season while in second season showed right skewed distribution having light tails.
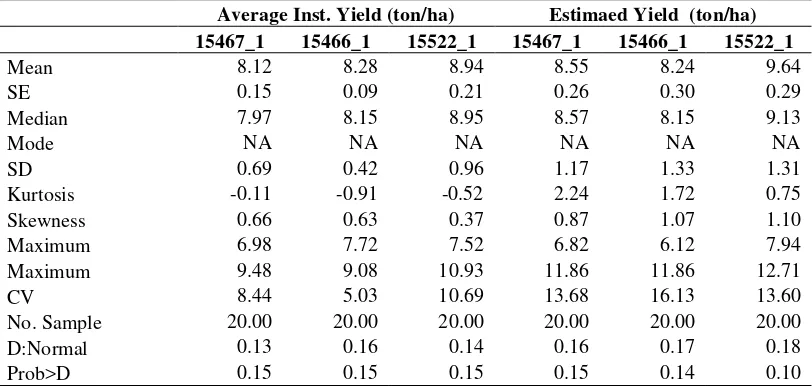
Tables 3 and 4 indicate average instantaneous yield data and estimated yield data for three lots in two growing seasons. All data show some tendency towards a normal distribution. As observed, the first season was the peak season of the year, marked by the highest yield within the calender period. The next section will discuss on some of the factors that directly influence yields. From the field observations, lot 15522 was well management as the owner did all of the field activities by himself with full dedication. This was in contrast with the other two other lots where the field activities were managed by hired labourers with lack of close monitoring by the owner.
Table 3. Descriptive statistics of average instantaneous yield and estimated yield of the associated rice plots from the first growing season.
Average Inst. Yield (ton/ha) Estimaed Yield (ton/ha)
15467_1 15466_1 15522_1 15467_1 15466_1 15522_1
Mean 8.12 8.28 8.94 8.55 8.24 9.64
SE 0.15 0.09 0.21 0.26 0.30 0.29
Median 7.97 8.15 8.95 8.57 8.15 9.13
Mode NA NA NA NA NA NA
SD 0.69 0.42 0.96 1.17 1.33 1.31
Kurtosis -0.11 -0.91 -0.52 2.24 1.72 0.75
Skewness 0.66 0.63 0.37 0.87 1.07 1.10
Maximum 6.98 7.72 7.52 6.82 6.12 7.94
Maximum 9.48 9.08 10.93 11.86 11.86 12.71
CV 8.44 5.03 10.69 13.68 16.13 13.60
No. Sample 20.00 20.00 20.00 20.00 20.00 20.00
D:Normal 0.13 0.16 0.14 0.16 0.17 0.18
Prob>D 0.15 0.15 0.15 0.15 0.14 0.10
SE: Standard Error, SD: Standard Deviation, CV: Coefficients Variance, and NA: Not Available
Table 4. Descriptive statistics of average instantaneous yield and estimated yield of the associated rice plots from the second growing season.
7
SE: Standard Error, SD: Standard Deviation, CV: Coefficients Variance, and NA: Not Available
3.2 Kriged Maps of Measured Instantaneous Yield and Estimated Yield
Yield variability within rice plot still exist for all experimental plots in the two growing seasons even though with the similar cultivation and management practices throughout the field area. The two possible causes for the variability in yield within a plot in accordance to Blackmore (1994) could be classifies as permanent features and variable features. The permanent features include soil type, topography, streams, and high trees while the variable features include ununiformed distribution of seed, fertilizer application rate, and herbicide -pest control application rate. Initially, the obtained data on average instantaneous yield and estimated yield for the rice plots were subjected for the kriging interpolation process in Arc GIS 10.1 for the purpose of producing a surface coverage or spatial distribution of the yield parameter. The classification technique of smart quartiles by ESRI (2001) was selected through visualized variability based on the natural grouping of data values. The entire yield map was divided into five zone areas of yield. The kriged maps were able to show the variations in yield within each individual field plot, and at the same time able to indicate which locations within the field plots showed low yields. These maps will become important management tool for remedial agronomic actions to improve crop yield for the up coming growing season.
The CV of instantaneous yield varied up to 32% as compared to15% with the estimated yield. The high variability of instantaneous yields came from 4000 points data for one lot while the estimated was only from 20 data points. Conseqently, because of this, the interval data between the kriged instantaneous yield and estimated yield were different. The instantaneous yield data interval ranged from 2.5 ton/ha to 10 ton/ha whereas estimated yield data interval was ranged from 6 to 11 ton/ha. Kriged maps of instantaneous yield and the average sub block of instantaneous yield, and the estimated yield of all associated plots are presented in Appendix. The instantaneous yield map was distributed by five classes area. The ranges included: class 1- very low (2.5 to 4 ton/ha), class 2 - low (4 to 5.5 ton /ha), class 3 – moderate (5.5 to 7 ton /ha), class 4 - high (7 to 8.5 ton/ha) and class 5 - very high (8.5 to 10 ton/ha). The high yield zone (class 4) was the most dominant distribution in first growing season for lot 15467, lot 15466 and lot 15522 which covered 57.34%, 56.83% and 47.88% of the total area, respectively. The very high yield range (class 5) covered from 30% to 40% of the total areas for three associated rice lots.
8
mean statistic instantaneous yield data was same with the dominant distribution of kriged yield map. Some of the possible causes of low crop yield for the identified area are low soil nutrient content, low plant populations, high field losses due to disease or pests, high pre-harvest loss due to lodged plants, and high machine losses at harvest.
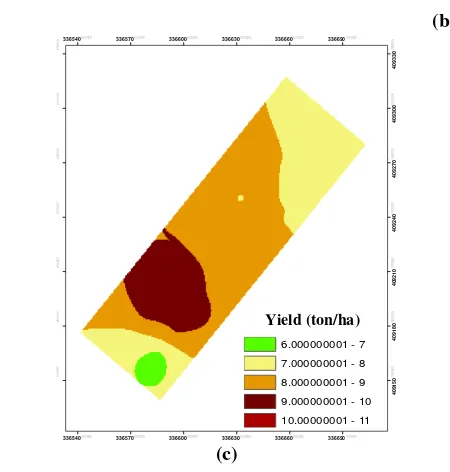
The average instantaneous yield and estimated yield were divided into five classes. These classes were: class 1-very low (6 to 7 kg/ha), class 2 - low (7 to 8kg/ha), class 3 - moderate (8 to 9 kg/ha), class 4 - high (9 to 10 kg/ha) and class 5 - very high (10 to 11 kg/ha). The kriged maps showed that both average instantaneous yield and estimated yield within associated rice plot for two growing seasons exhibited similar patterns. Lot 15467 and lot 15466 in two growing season, class 3 was the most dominant distribution in average instantaneous yield and estimated yield by which covered range of 44.94% to 71.14% ton/ha total area. However the same occurred for Lot 15522 as class 4 was the most dominant distribution for average instantaneous yield and estimated yield which covered 45.43% and 63.57% of the total areas in first growing season, respectively. In second season, the low yield range of 7 to 8 ton/ha was the most dominant distribution for average instantaneous yield and estimated yield which covered 70.71% and 41.61% of the total area in second growing season, respectively.
9
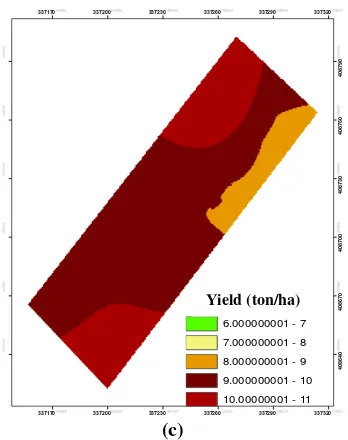
(c)
Fig 2. Kriged yield maps (ton/ha): (a) instantaneous yield, (b) average instantaneous yield and (C) estimated yield at lot 15522_1.
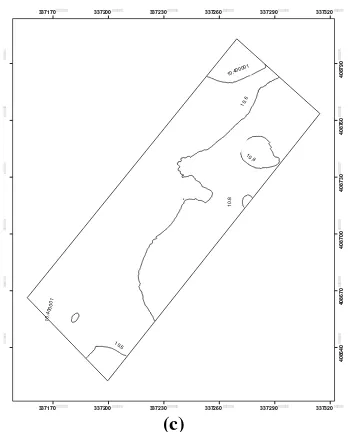
From the krieged yield map of each lot; the low yielding area was in the southern area of the field (border with canal). Alternately, high yield occurred to the north (border with road). This may be attributed to the water level near the canal flows allowing fertilizer and other inputs to accumulate at the north of lot. It was also noted that the plants in this region were healthier than others (Figures 2 and 3). The contour map shows that the south part topography was higher than the north part (Figure 4). Heege (2013) claimed that the topography of the land influences water runoff water and erosion results with distinct differentiation of soil qualities. Yield variations could be used to evaluate the effectiveness of the current management pratices and provide useful information for planning proper fertiliser management in the following years (Chosa, 2006). In high yielding area, farmers may wish to reduce fertilizer application while in low yielding area, they may wish to increase fertility.
10
(a) (b)
(c)
11
(c)
Figure 4. Contour maps: (a) lot 15467, (b) lot 15466 and (c) lot 15522
3.3 Correlation between Average Instantaneous Yield and Estimated Yield
Person's correlations were performed to determine the correlation of average instantaneous yield and estimated yields for each lot over the two growing seasons (Table 5). Pearson’s 2-tailed test for average instantaneous yield and estimated yield correlations showed that the significant positive correlation at significant level 0.01 for three associated rice plots in two growing season. The correlation coefficients (r) at three lots were 0.68775, 0.70379, and 0.78303 for lot 15467, lot 15466, and lot 15522 in the first seasons, respectively. The Pearson's correlation increased in the second season for lots 15467, 15466 and, 15522 with of 0.76308, 0.82937 and 0.81854, respectively. The interpretation of the correlation coefficient was based on a rating scale < 0.20 negligible, from 0.20 to 0.40, low; 0.40 to 0.60, moderate; 0.6 to 0.80, substantial; and 0.80 to 1.0, high to very high (Best and Kahn, 2003). Overall, this indicator showed high correlation between average instantaneous yield with estimated yield with correlation coefficient ranging between 0.6878 to 0.8294. The correlation coefficient would likely increase with more CCT sample points in the estimated yield determination.
Table 5. Pearson’s correlation coefficient for instantaneous yield and estimated yield.
Growing Season Lot Pearson Correlation
Coefficient
significant at 1% significant level or 0.01 probability level
4. Conclusion
Measurement accuracy determination of the newly developed yield monitoring system employing SWR SolidFlow microwave type flow sensor for rice combine had been successfully quantified against the standard Crop Cut Test
12
(CCT). Pearson's correlations ranging from 0.69 to 0.83 were obtained form the crop yield measured by the yield monitoring system as compared to the crop yield by CCT. Conclusively, this newly developed yield monitoring system on-board the rice combine was able to provide measurements with good accuracy not only on the total crop yield of the harvested plot but also the crop yield variability within the plot.
5. Acknowledgement
The authors are very grateful to the Department of Agriculture (DOA) and Integrated Agricultural Development Authority (IADA) Rice Granary within the district of Kuala Selangor and Sabak Bernam for providing us with the technical advices and assistances throughout our field engagement at the paddy fields in Sungai Besar, Selangor.
Reference
Al-Mahasneh, M. A., Colvin, T. S. (2000). Verification of yield monitors performance for on-the-go measurement of yield with an in-board electronic scale. Trans. of the ASAE 34(4): 801-807.
Arslan, S., and T. S. Colvin. (1999). Laboratory performance of a yield monitor. Applied Eng. Agric. 15(3): 189-195.
Arslan, S., F. Inanc, J. M. Gary and T. S. Colvin. (2000). Grain flow measurements with X-ray techniques. Computers and Electronics in Agriculture, 26: 65-80.
Arslan, S. and T. S. Colvin. (2002). Grain yield mapping: yield sensing, yield reconstruction, and errors, Precision Agric. 3: 135–154. Best, W. B. and J. V. Kahn. (2003). Research in Education. New Delhi: Printice-Hall of India Pvt-Ltd.
Blackmore, B. S., Wheeler, P. N., Morris, J., Morris, R. M. and Jones, R.J.A. (1994). The role of precision farming in sustainable agriculture: A European perspective. In: Proceedings of the 2nd International Conference on Precision Agriculture. edited by P. C. Robert, R. H. Rust and W. E. Larson. (ASACSSA-SSSA. Madison, WI, USA) pp. 773–793
Chosa, T., Shibata, Y., Kobayashi, K., Araki, K., and Hosokawa, H. (2006). Yield monitoring system for a head-feeding combine, 40(December 2004), 37–43.
Chosa, T., Shibata, Y. and Omine, M. (2002). A study on yield monitoring system for head-feeding combines. I. Adoption of an Optical Sensor and a Load Cell as a Yield Monitor. Journal Japan Society Agricultural Mechanization 64(6): 145–153.
Heege, H. J. (2013). Precision in crop farming. site specific consept and sensing methods : application and results. Springer. New York. Huddleston (1978). Sampling techniques for measuring and forecasting. economic, statistics and cooperative service US. Department of
Agriculture ESCS No 9.
JICA. (2007). Officers manual, Crop cutting yield per rei, Second rice (dry season). Officer of Agricultural Economics, Ministry of Agriculture and Cooperatives. JICA ASEAD PROJECT
Ju., O. Y. (2011). Development of a portable, real-time, wireless crop yield monitoring system on rice combine. Publish by Mater Thesis. University Putera Malaysia
Sandra D.S. and Ramon, C.L. (1987). SAS System for Elementary Statistical Analysis. SAS Institute Inc. Cary, North Carolina, USA: 107-133. Shoji, K., Kawamura, T. and Horio, H. (2005). Variability of Micro-Elevation, Yield, and Protein Content within a Transplanted Paddy Field.
Faculty of Agriculture, Kobe University, Kobe 657-8501, Japan.
Yahya, M. M. Isa, and S. Abd. Aziz. (2012). Portable Wireless Yield Monitoring System for Rice Combine. Paper Presenter at the