850
Factors Affecting the Migration Decision of
Tsunami Survivors from the Relocation Area
1*
Saiful Mahdi,
1Nany Salwa and
2Cut Mardiana
1
Department of Statistics, Faculty of Mathematics and Sciences, University of Syiah Kuala, Banda Aceh 23111, Indonesia;
2
Survey and Policy Analysis Research Group (SPARG), Department of Statistics, Faculty of Mathematics and Sciences, University of Syiah Kuala, Banda Aceh 23111, Indonesia;
*
Corresponding author: [email protected]
Abstract
The government has undertaken a relocation program to address the housing problems caused by the earthquake and tsunami of December 26, 2004 in Aceh. However, the relocation of tsunami survivors also caused other impacts after the relocation was carried out. If the relocation site is not as desirable, it can cause tsunami survivors to decide to out-migrate the relocation area. This study was conducted to determine factors that significantly affect the decision of migration of tsunami survivors from the relocation area. This research is expected to provide information on post-disaster relocation for consideration in making relocation policy in the future. We use classification tree, which is part of the CART (Classification and Regression Trees) method. The data used is from The Aftermaid of Aid (AoA) survey conducted by International Center for Aceh and Indian Ocean Studies (ICAIOS) and Earth Observatory of Singapore (EOS) during 2014-2015. The results of the research indicate the factors that significantly affect the migration decision of tsunami survivors from a relocation area are gender, age, and job before relocation, total assets, and the distance of relocation house to central market, house modification, and concerns about possible of future tsunami. Most affecting factor of migration decision, however, is the distance of relocation house to the central market, confirming the impact of sosio-economic factor of post-disaster relocation. The optimal classification tree obtained has a classification accuracy rate of 85, 64%.
Keywords: Aceh, tsunami, migration decision, post-disaster relocation, classification trees, AoA Survey, ICAIOS.
Introduction
851 Relocation of tsunami survivors, as expected, also caused other impacts after the relocation was carried out. For example, the location of the relocation is not the same as the location of main livelihood of tsunami survivors. If such matters do not meet the needs and expectation of the relocated survivors, then the i survivors may decide to migrate from the relocation area. This is in accordance with Usamah and Haynes (2012) research on the relocation program after the eruption of Mayon Volcano in the Philippines, where people in the relocation area returned to their original location because of the socio-economic impact they experienced after being in the relocation area.
To examine this, following the tsunami disaster in Aceh, ICAIOS undertook research on the factors that significantly affected the decisions of migration of tsunami survivors from relocation areas. One of the statistical methods that can be used to examine these factors is the tree classification method. Tree classification is one method of CART (Classification And Regression Trees). The dependent variable in this study has a categorical measurement scale, so it will produce a classification tree.
Literature Review
The classification tree is one part of the CART method. CART is a nonparametric method developed to analyze classification problems for categorical and numerical dependent variables (Yohannes and Webb, 1999). Breiman et al. (1984) states, the main purpose of CART is to produce an accurate data group by uncovering the predicted structure of the problem under study. The accuracy of the results of CART is based solely on the accuracy of tree-making (Yohannes and Hoddinott, 1999). Timofeev (2004) and Lewis (2000) mention some of the advantages of CART, including CART does not require identification of which variables will be chosen first. The CART algorithm alone will identify the most significant variables and eliminate the insignificant ones. Here is the tree shape generated by the CART method.
Figure 1.Structure of CART (Source: Majid, in Morgan, 2014).
Figure 1 shows the tree structure consisting of independent variables related to the dependent variable. T1 is the parent node or root node, while t2, t3, and t5 are
internal nodes. The t4, t6, t7, t8, and t9 are terminal nodes that are not branched out
anymore. The variable located at t1 is the most influential variable to the dependent
852
Research Method
The method of analysis used in this research is classification tree. The data used in this study is secondary data, AoA survey conducted by ICAIOS and EOS during 2014-2015 on population mobility, with a sample size of 202 respondents. All of these respondents were survivors of the earthquake and tsunami of Banda Aceh and Aceh Besar who were relocated to other villages. Data processing is done with the help of Microsoft Ecxel and R Studio software. The variables used in this study can be seen in Table 1.
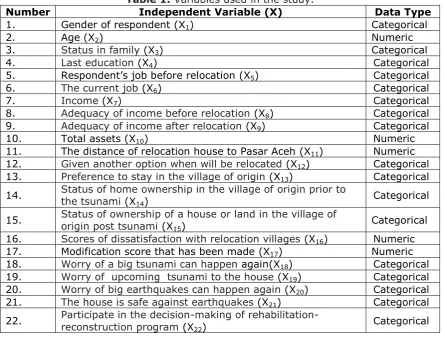
Table 1. Variables used in the study.
Number Independent Variable (X) Data Type
1. Gender of respondent (X1) Categorical
2. Age (X2) Numeric
3. Status in family (X3) Categorical
4. Last education (X4) Categorical
5. Respondent’s job before relocation (X5) Categorical
6. The current job (X6) Categorical
7. Income (X7) Categorical
8. Adequacy of income before relocation (X8) Categorical
9. Adequacy of income after relocation (X9) Categorical
10. Total assets (X10) Numeric
11. The distance of relocation house to Pasar Aceh (X11) Numeric
12. Given another option when will be relocated (X12) Categorical
13. Preference to stay in the village of origin (X13) Categorical
14. Status of home ownership in the village of origin prior to the tsunami (X14)
Categorical
15. Status of ownership of a house or land in the village of
origin post tsunami (X15) Categorical
16. Scores of dissatisfaction with relocation villages (X16) Numeric
17. Modification score that has been made (X17) Numeric
18. Worry of a big tsunami can happen again(X18) Categorical
19. Worry of upcoming tsunami to the house (X19) Categorical
20. Worry of big earthquakes can happen again (X20) Categorical
21. The house is safe against earthquakes (X21) Categorical
22. Participate in the decision-making of
rehabilitation-reconstruction program (X22) Categorical
The steps undertaken in the study are as follows: 1. Establishment of the tree of maximal classification:
a. Sorting of variables at all possible points of sorting. Then the sample is
c. Repetition of steps a and b for each independent variable.
d. Selection of variables and split points with the highest Goodness of Split. e. Repeat steps a until d for each child node that becomes an internal node. The
853 f. The class label determination at the terminal node corresponds to the class of
the most observed number at the terminal node.
2. Pruning tree classification with the smallest cost complexity. ( ) ( ) | ̃|
with | ̃| Is the number of terminal nodes of the T tree, and is the complexity parameter. Tree pruning produces some classified sub-trees.
3. Determination of the optimal classification tree with the smallest error rate of k-fold cross-validation.
4. Calculation of accuracy of optimal classification tree..
Accuracy
TP = True Positives
TN = True Negative
P = Positive
N = Negative
5. Interpretation of the optimal classification tree
Results and Discussion
The classification tree consists of independent variables that significantly affect the dependent variables. The selected variable is the one with the highest goodness of split point for each node. In software R, Goodness of Split multiplied by the number of samples in a node and called improve value. The selected variable on the main node is the relocation distance to Pasar Aceh (X11), with the split point is 13966. The
variable is selected because it has the highest improve value, that is 12,28. For more details, please refer to Table 2 below:
Table 2. Improve score in root node.
Variable Split point Improve
Respondent’s job before relocation (X11)* 13966 12,28 Scores of dissatisfaction with relocation villages (X16) 2,5 8,56 Respondent’s job before relocation (X5) 1; 3; 4; 6 3,98
Preference to stay in the village of origin (X13) 1 3,91
Worry of upcoming tsunami to the house (X19) 2; 3 2,75
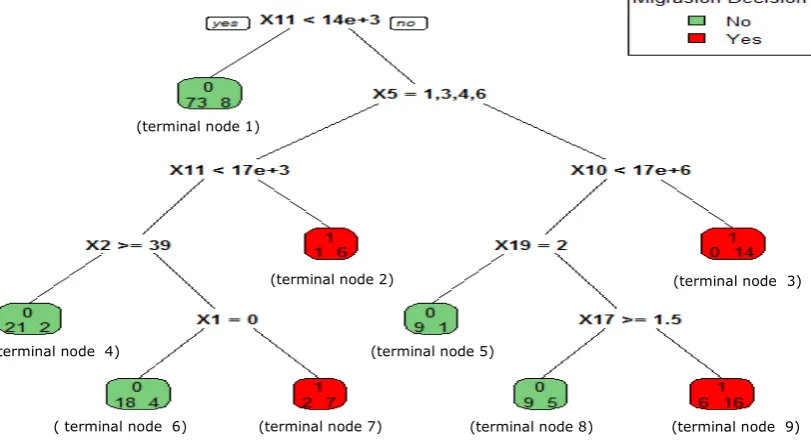
The tree classification can be seen in Figure 2 below:
Figure 2. Maximum classification tree of migration decision.
Note: * selected splitter on the root node
(terminal node 1)
(terminal node 2) (terminal node 3)
( terminal node 4) (terminal node 5)
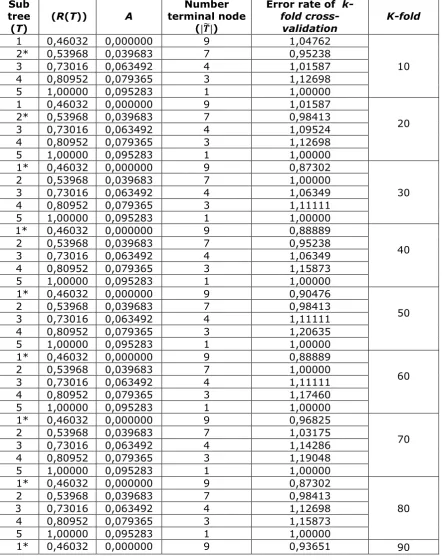
854 In Figure 2, green colour represent when classified as a non migrating class and red color represent when classified as a migrating class. The maximal tree tends to be difficult to interpret and may cause overfitting for new data. Therefore, it is necessary to choose an optimal size tree. Optimal tree determination begins by pruning tree. The trimming process produces 5 sub-trees. A classification tree of 5 sub-trees will be selected, with the smallest cross-validation error rate. Below is the order of the sub-trees that are trimmed from the maximum tree (Tmax) to the smallest tree along with the error rate of k-fold cross-validation.
855
Note: * optimal classification tree
Table 3 shows the minimum error rate is found on 30-fold cross-validation and 80-fold cross-validation, which is 0,87302 with a sub-tree consisting of 9 terminal nodes. Therefore, the first sub-tree is selected as the optimal classification tree, where the tree is also the maximum classification tree. The optimal classification tree also needs to be measured for its classification accuracy to find out how well the prediction class classification results of the actual observation. For more details can be seen in table 4 below:
Table 4. Confusion matrix of optimal classification tree.
Actual class Predicted class
Total
Yes No
Yes 43 20 63
No 9 130 139
Total 52 150 202
Table 4 shows the results of classification of the optimal classification tree. There are 43 observations of migration classified correctly by classification tree. Further, 130 observations do not migrate properly classified by classification trees. The accuracy of the classification tree can be calculated as follows:
Accuracy = (43+130)/202 = 0,8564
Thus, the optimal classification tree has a classification accuracy of 0,8564 or 85,64%. That is, 85,64% predicted results are correctly classified by the optimal classification tree. The optimal classification tree in this study is a tree having 9 terminal nodes. Here is the optimal classification tree selected.
2 0,53968 0,039683 7 1,07937
3 0,73016 0,063492 4 1,15873
4 0,80952 0,079365 3 1,15873
5 1,00000 0,095283 1 1,00000
1* 0,46032 0,000000 9 0,95238
100
2 0,53968 0,039683 7 1,03175
3 0,73016 0,063492 4 1,17460
4 0,80952 0,079365 3 1,17460
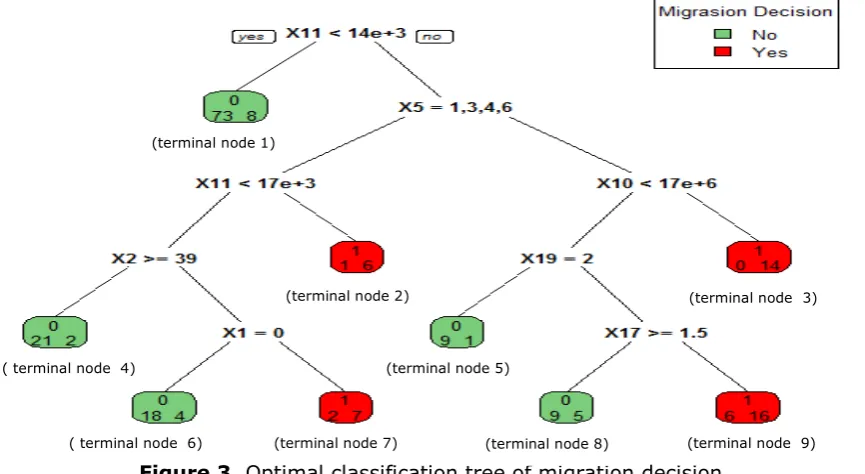
856
Figure 3. Optimal classification tree of migration decision.
In Figure 3 can be seen that the most influential variable on the migration decision of the relocation area is the distance of relocation house to Pasar Aceh (X11). Other variables that significantly affect the migration decisions of the relocation area are
respondent’s job before relocation (X5), total assets (X10), age (X2), worry of upcoming tsunami to the house (X19), gender of respondent (X1), and modification score which has been made (X17).
Table 5. Interpretation of the optimal classification tree.
Terminal
node Description
1
Consists of 81 respondents who are classified as respondents who decide not to migrate. Characteristics of respondent : the respondent whose home distance to Pasar Aceh (X11) is less than 14000 meters
2
Consists of 7 respondents who are classified as respondents who decide on migration. The respondent's characteristic: the respondent with the distance of the house to Pasar Aceh (X11) more than 14000 meters,
respondent’s job before relocation (X5) are farmers, civil servants, private / self-employed, unemployed employees, and house distance to Pasar Aceh (X11) also more than 17000 meters.
3
Consists of 14 respondents who are classified as respondents who decide
on migration. The respondent’s characteristic: the respondent with the distance of house to Pasar Aceh (X11) more than 14000 meter,
respondent’s job before relocation (X5) is fisherman, laborer and respondent having total asset (X11) more than Rp 17.000.000,00.
4
Consists of 23 respondents who are classified as respondents who decide not to migrate. The characteristics of respondents: respondents with the distance of the house to Pasar Aceh (X11) more than 14000 meters,
respondent’s job before relocation (X5) are farmers, civil servants, private / self-employed, unemployed employees, and house distance to Pasar Aceh (X11) also less than 17000 meters, and respondents aged more than equal to 39 years.
5
Consists of 10 respondents who are classified as respondents who decide
not to migrate. The respondent’s characteristic: the respondent with the distance of house to Pasar Aceh (X11) more than 14000 meter,
(terminal node 1)
(terminal node 2) (terminal node 3)
( terminal node 4) (terminal node 5)
857
respondent’s job before relocation (X5) are fisherman, laborer, has total assets (X11) less than Rp 17.000.000,00, and respondent has a little worry of upcoming tsunami to the house.
6
Consists of 22 respondents who are classified as respondents who decide not to migrate. The characteristics of respondents: the respondents with the distance of house to Pasar Aceh (X11) more than 14000 meters,
respondent’s job before relocation (X5) are farmers, civil servants, private / self-employed, unemployed employees, and house distance to Pasar Aceh (X11) also less than 17000 meters, respondents aged less than 39 years, and gender of respondents is female (X1).
7
Consists of 9 respondents who are classified as respondents who decide on migration. The characteristics of respondents: the respondents with the distance of house to Pasar Aceh (X11) more than 14000 meters,
respondent’s job before relocation (X5) are farmers, civil servants, private / self-employed, unemployed employees, and house distance to Pasar Aceh (X11) also less than 17000 meters, respondents aged less than 39 years, and male respondents (X1). This is in accordance with research santoso (2010), that the population of male sex and aged 15-24 years tend to migrate.
8
Consists of 14 respondents who are classified as respondents who decide
not to migrate. The respondent’s characteristic: the respondent with the
distance of house to Pasar Aceh (X11) more than 14000 meter,
respondent’s job before relocation (X5) are fisherman, laborer, respondent has total assets (X11) less than Rp 17.000.000,00, respresent not worried, worried, and very worried about the upcoming tsunami going home (X19), and the modification scorehas been made (X17) by respondents more than equal to 1,5.
9
Consists of 22 respondents who are classified as respondents who decide
on migration. The respondent’s characteristic: the respondent with the
distance of house to Pasar Aceh (X11) more than 14000 meter,
respondent’s job before relocation (X5) are fisherman, laborer, respondent has total assets (X11) less than Rp 17.000.000,00, represent worried, worried, and very worried about the upcoming tsunami going home (X19), and the modification score has been made (X17) by the respondents is less than 1,5.
Conclusions
The conclusions are factors that significantly affect the migration decisions of tsunami survivors from the relocation areas are gender of respondent (X1), age (X2),
respondent’s job before relocation (X5), total assets (X10), the distance of relocation
house to Pasar Aceh (X11), modification score Which has been made (X17), and worry
of upcoming tsunami to the house (X19). The most influential factor on migration
decision is the distance of relocation house to Pasar Aceh (X11).
References
Breiman, L., Freidman, J., Stone, C.J., and Olshen, R.A. (1984). Classification and regression trees. Washington D.C : Chapman and Hall.
Lewis, R. J. (2000). An introduction to Classification and Regression Trees (CART) analysis. Presented at the 2000 Annual Meeting of Society for Academic Emergency Medicine. San Fransisco, California.
858 Santoso, I. (2010). Faktor-Faktor yang mempengaruhi keputusan bermigrasi penduduk Indonesia antara tahun 2000-2007 (Analisis data IFLS 2000 dan 2007)
(Tesis). Jakarta : Universitas Indonesia.
Timofeev, R. (2004). Classification and Regression Trees (CART) Theory and applications (Thesis). Humboldt University, Berlin.
Usamah, M., & Haynes, K. (2012). An examination of the resettlement program at Mayon Volcano: What can we learn for sustainable volcanic risk reduction?
Bulletin of Volcanology, 74(4), 839-859.
Yohannes, Y., & Hoddinott, J. (1999). Classification and Regression Trees: An introduction. Washington D.C.: International Food Policy Research Institute. Yohannes, Y., & Webb, P. (1999). Classification and Regression Trees, Cart™: A user