Document Title Document Version
D1.2 Use Case Specification 1.3
Project Number Project Acronym Project Title
FP7-2011-7-287661 GAMBAS Generic Adaptive Middleware for Behavior-driven Autonomous Services
Contract Delivery Date Actual Delivery Date Deliverable Type Deliverable Access
M4 May 31st, 2012 R (Report) PU (Public)
Document Author or Reviewer Organization Work Package
Manuel Serrano ETRA WP1
Santiago Martínez ETRA WP1
Umer Iqbal UDE WP1
Marcus Handte UDE WP1
Wolfgang Apolinarski UDE WP1
Wolfgang Barth SC WP1
Josiane Xavier Parreira NUIG WP1
Abstract
This document holds the description of the use cases that will support the prototyping and evaluation of the generic adaptive middleware for behavior-driven autonomous services developed in the project. It also provides a first description of the building blocks that will further analyzed during the architecture design in D1.3.1.
Revision Organization Description
0.1 ETRA Created initial template with contents discussed at the KO meeting. 0.2 ETRA Added Use Cases proposal for scenario 2.
0.3 ETRA Added all use cases, 4.1.1 and 4.1.2 completed. 0.4 UDE Added UDE information to the use cases. 0.5 SC Use case definition speech recognition. 0.6 UDE Resolved minor typos, updated use cases.
0.7 ETRA Completed section 4.
0.8 ETRA Completed section 2 and 3. 0.9 ETRA Completed section 5 and 6.
Table of Contents
1 Introduction ...1
1.1 Purpose ...1
1.2 Scope ...1
1.3 Structure ...2
2 Motivating Scenarios ...3
2.1 Vision ...3
2.1.1 Mobility Scenario: “John arrives to town” ...3
2.1.2 Environmental Scenario: “Paul goes jogging” ...4
2.1.3 Shopping Scenario: “Yoko goes shopping”...5
2.2 Key Concepts ...6
2.2.1 Semantic Layer ...7
2.2.2 Citizen Network Layer ...7
2.2.3 Mobility Layer ...8
2.2.4 Environmental Layer ...8
3 Building Blocks ...9
4 Use Cases ... 13
4.1 Mobility Scenario ... 13
4.1.1 Use Case 01M: Adaptive Trip Planner ... 13
4.1.2 Use Case 01.1M: Adaptive Intermodal Trip Planner ... 15
4.1.3 Use Case 01.2M: Adaptive Intermodal Trip Planner with Park and Ride ... 16
4.1.4 Use Case 02M: Predictive Destination ... 17
4.1.5 Use Case 03M: Demand Response in Real Time ... 18
4.1.6 Use Case 04M: Demand Response from Statistics ... 19
4.1.7 Use Case 05M: QoS Indicator through Estimation of Passengers per Bus ... 19
4.1.8 Use Case 05.1M: Added Value Services based on QoS Crowded Bus Metric ... 20
4.1.9 Use Case 06M: Added Value Services based on Shopping Layer ... 21
4.1.10 Use Case 07M: Added Value Services based on Social Layer ... 22
4.2 Environmental Scenario ... 23
4.2.1 Use Case 01E: Running with a Friend ... 24
4.2.2 Use Case 02E: Pollution Map (Noise, Pollen and CO2 from Bus Sensors)... 25
4.2.3 Use Case 02.1E: Pollution Map (Noise Detected by Mobile Devices) ... 26
4.2.4 Use Case 03E: Alert of High Level of Pollen in Area ... 27
4.2.6 Use Case 04E: Urban Tolling Depending on CO2 Pollution ... 29
4.2.7 Use Case 04.1E: Alert If Urban Tolling Higher than a Certain Price in Planned Route... 30
4.2.8 Use Case 05E: Public Transport Incentives Depending on Pollution Levels ... 31
4.2.9 Use Case 06E: Environmental Footprint for Public Transport Passengers ... 32
5 Coverage Analysis and Prioritization ... 34
5.1 Coverage Analysis ... 34
5.1.1 General Requirements ... 34
5.1.2 Adaptive Data Acquisition ... 36
5.1.3 Automated Privacy Preservation ... 37
5.1.4 Intent-aware User Interface ... 39
5.1.5 Interoperable Data Representation and Query Processing ... 40
5.2 Prioritization and Selection ... 41
6 Conclusion ... 44
List of Figures
Figure 1 – Original Vision ...9
Figure 2 – Preliminary Architectural Building Blocks ... 10
Figure 3 – Refined Vision and Building Blocks ... 12
Figure 4 – Adaptive Trip Planner Sequence Diagram ... 14
Figure 5 – Adaptive Intermodal Trip Planner with Park and Ride Sequence Diagram ... 17
Figure 6 – Predictive Destination Sequence Diagram ... 18
Figure 7 – Demand Response in Real Time Sequence Diagram ... 19
Figure 8 – Added Value Services based on QoS Crowed Bus Metric Sequence Diagram ... 20
Figure 9 – Added Value Services based on Shopping Layer Summary ... 21
Figure 10 – Added Value Services based on Social Layer Sequence Diagram ... 23
Figure 11 – Running with a Friend Sequence Diagram ... 25
Figure 12 – Basic Hardware to Capture Environmental Data in Buses ... 26
Figure 13 – Pollution Map (Noise, Pollen and CO2 from Bus Sensors) Sequence Diagram ... 26
Figure 14 – Pollution Map (Noise Detected by Mobile Devices) Sequence Diagram ... 27
Figure 15 – Alert of High Level of Pollen in Area Sequence Diagram ... 27
Figure 16 – Alert of High Level of Pollen in Planned Bus Route Sequence Diagram ... 28
Figure 17 – Urban Tolling Depending on CO2 Pollution Sequence Diagram... 29
Figure 18 – Alert If Urban Tolling Higher than a Certain Price in Planned Route Sequence Diagram ... 30
Figure 19 – Public Transport Incentives Depending on Pollution Levels Sequence Diagram ... 31
List of Tables
Table 1 – Adaptive Trip Planner Summary ... 13
Table 2 – Adaptive Intermodal Trip Planner Summary ... 15
Table 3 – Adaptive Intermodal Trip Planner with Park and Ride Summary ... 16
Table 4 – Predictive Destination Summary ... 17
Table 5 – Demand Response in Real Time Summary ... 18
Table 6 – Demand Response from Statistics Summary ... 19
Table 7 – QoS Indicator through Estimation of Passengers per Bus Summary ... 19
Table 8 – Added Value Services based on QoS Crowded Bus Metric Summary ... 20
Table 9 – Added Value Services based on Shopping Layer Summary ... 21
Table 10 – Added Value Services based on Social Layer Summary ... 22
Table 11 – Running with a Friend Summary... 24
Table 12 – Pollution Map (Noise, Pollen and CO2 from Bus Sensors) Summary ... 25
Table 13 – Pollution Map (Noise Detected by Mobile Devices) Summary... 26
Table 14 – Alert of High Level of Pollen in Area Summary ... 27
Table 15 – Alert of High Level of Pollen in Planned Bus Route Summary ... 28
Table 16 – Urban Tolling Depending on CO2 Pollution Summary ... 29
Table 17 – Alert If Urban Tolling Higher than a Certain Price in Planned Route Summary ... 30
Table 18 – Public Transport Incentives Depending on Pollution Levels Summary ... 31
Table 19 – Environmental Footprint for Public Transport Passengers Summary ... 32
Table 20 – General Requirements Coverage Matrix ... 35
Table 21 – Adaptive Data Acquisition Coverage Matrix... 37
Table 22 – Automated Privacy Preservation Coverage Matrix... 38
Table 23 – Intent-aware User Interface Coverage Matrix... 39
1
Introduction
This document contains the description of the use cases that will support the prototyping and evaluation of the generic adaptive middleware for behavior-driven autonomous services developed in the project. It also provides a first description of the building blocks that will further analyzed during the architecture design. In the following, we first detail the purpose, the scope and structure of the document before we describe the scenarios and use cases.
1.1
Purpose
The purpose of this document is to describe the envisioned applications resulting from this project, and the context where these applications will be used and tested. The goal is to summarize the expectations of the end-users (software developers, public transport operators and citizens) with regards to GAMBAS in a document.
Moreover, the document serves as the common tool to promote the negotiation and discussion within the consortium to set the limits of the research and the final demonstrations at the end of the project. This way, the scenarios proposed in this deliverable follow a twofold objective: guarantee a realistic demonstration of a smart city framework – specifically for mobility and environmental applications – and explore innovative new features and added value services raised from the availability of open and private data in a secure manner.
The scenarios will serve as test beds for the applications and pieces of software tackled in GAMBAS: a data acquisition framework, a privacy middleware, a semantic platform, an intent-aware end-user mobile application, an environmental monitoring and information service and an improved exploitation support system for the bus transport network in Madrid.
Last but not least, the document introduces the building blocks that will be used within the project. They have been drafted based on the specifications derived from the use cases and scenario definitions, as well as the list of requirements in [D11].
1.2
Scope
This deliverable is part of the main results of the requirement analysis phase of the project (WP1), jointly with D1.1 [D11]. Both documents are issued together and have been developed simultaneously. Thus, mutual dependencies exist across the documents. The editors have tried to keep this deliverable self-contained, minimizing the need of reading both documents by repeating part of the information provided in [D11]. However, it is highly recommended to read both deliverables following their natural order – i.e. D1.1 first and later D1.2. In this way, the reader will understand the global research framework defined in this first phase of the project.
All partners of the GAMBAS consortium have participated in the specification of use cases and scenarios. Hence, the non-technical specifications provided by the main end users (EMT), have been used by the technology providers to understand the system requirements and progress towards the design documents that will be developed next in the project. Thus, the top-down approach followed in this deliverable complements the mainly bottom-up approach followed in D1.1.
pre-identified building blocks will be further described and analyzed in the upcoming deliverables that detail the overall architecture.
1.3
Structure
The document is structured around four main sections describing the motivating scenarios and project vision, the basic building-blocks to achieve this vision, the formal specification of use cases to describe the functionalities that are expected by the end of the project, and a coverage analysis and selection of the most relevant – and feasible – use cases.
2
Motivating Scenarios
In the following, the GAMBAS vision is outlined and a number of scenarios are described in order to clarify the vision. Based on the scenarios, a number of strong concepts are we derived to underline the novelty of the approach.
2.1
Vision
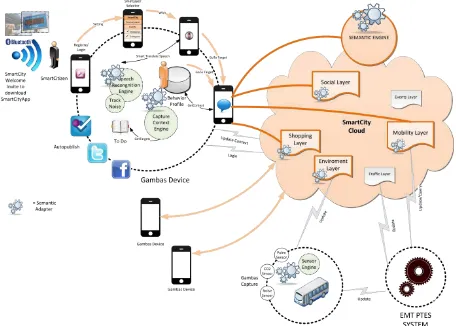
The GAMBAS project fits within the framework of smart cities as a cloud of intelligent digital services which provides adaptive and predictive information to citizens and distributed embedded terminals. The project, from the point of view of innovation and research, tries to make a contribution to the existing takes on smart cities by:
A. Processing information dynamically depending on the behavior of citizens in cities.
B. Considering the citizens not only as consumers of digital services, but also as sources of information providing feedback to the city.
The following sections present the scenarios that motivated the project and extract the key concepts that will be mapped into the building blocks and architecture enabling the GAMBAS approach.
2.1.1 Mobility Scenario: “John arrives to town”
John has just arrived to a new city. At the airport he receives a message on his mobile phone by Bluetooth broadcast welcoming him to the city and inviting him to download an application on his smart phone in order to make his life in the city easier and to make his visit more enjoyable.
He follows the link proposed by the welcome message and downloads the application. When booting the application for the first time, he is requested to provide some data that does not affect his privacy. From that moment on, the application begins to capture the context related to John’s interests including the change of positions, used transport modes, visited shops, etc.
The interface requests John to select which type of information he is interested in. John can choose from different sources of information and services. For this short visit to the city, John selects the mobility, events and shopping layers. The selection of “events” invites John to refine his selection and choose among different kind of events: sports, theatre, exhibitions, conferences, etc. John selects sports and theatre.
The interface also suggests John to connect his smart phone application with social networks such as FourSquare, Facebook and Twitter. John selects Foursquare in order to publish his “check-in” events and share them with his friends in the city.
As it is the first time John visits the city, and he has just downloaded the application, the application is not able to predict the targeted destination of John. His city behavior profile has been just created and the phone's calendar is empty.
Thus, the application asks John “what do you want to do?”
The application then shows John the route through public transport means to reach his destination. John begins his trip first by metro and then continues by bus. The application on his phone is able to detect at any time where John is and alerts John shortly before he has to leave the metro. Thereby, it notifies him about which bus to take next.
If he decides to leave the recommended route, he can do it at any point and at any time. If he decides to go for a walk in the city he can leave the route and get updated route recommendations. At any point, he can look up information on the bus stops and metro stations or other points of interest (POI) making use of speech recognition combined with semantic services.
During the journey the application informs John of the sport and theater events taking place in the next days in the city.
When he is close to his destination and since it is already lunch time, his smart phone suggests three restaurants nearby his hotel. At any point during his visit to the city, John can identify locations with a voice tag. At the location of the selected restaurant he can use the voice recognition system to tag the location “Luigi’s restaurant” or “Good Pasta”. Later one, the voice recognition will be able to use this information to lead John back to the restaurant.
After lunch the application suggests buying in Cortefiel next to his hotel that has a 2 x 1 offer in spring shirts.
Once arrived at his destination the application detects his "check-in" and suggests John to publish the event on his enabled social networks. John accepts the suggestion and according to his settings, his location is published in Foursquare. Once the goal is achieved – i.e. arrival to destination - the application returns to its initial state, “What do you want to do”.
This time, John ignores his smart phone however, while John is in the city, the application keeps analyzing his behavior and suggesting information and services based on his position and preferences.
The application can notify John about shopping deals depending on his position and the proximity of the shops. Thus, the interaction with the end-user becomes more efficient and the GAMBAS framework is capable to filter the offers, resulting in a much less annoying solution (AdGeosense).
2.1.2 Environmental Scenario: “Paul goes jogging”
Paul is a regular user of the smart city application on his mobile phone. He uses it regularly to find out the best options to get around in the city. For this, he is always subscribed to the mobility layer. Today, he has decided to do some sport around the city, and his friend Ringo has explained him how to make use of the smart city application to obtain a jogging route through the less polluted areas of the city (CO2 levels). He indicates the number of kilometers he wants to run, and for how long, he also specifies that if possible he would like to run with some friend.
At the same time Ringo, who was already planning to go jogging, receives an alert asking him if he mobility layer offering him a car pooling services. The urban tolling in the city depends on a number of factors such as type of vehicle used, number of passengers in the car, and level of pollution in the city. Ringo receives a proposal from the application to share the trip with his friend George.
When activating the environmental layer on his mobile phone – in order to access the levels of CO2 in the city – Paul has accepted to join the group of users collaborating with the municipality to study the noise levels in the city. Without any further intervention from his side, its mobile phone records and process measurements of noise level each time Paul is outdoors and changes his position. At the end of the day, Paul can access the city pollution map application and check the noise levels in the route he has being following, including the jogging activity. Moreover, he obtains his environmental footprint due to the trip on public bus.
2.1.3 Shopping Scenario: “Yoko goes shopping”
Yoko has been using the smart city application on her smart phone for several weeks. Her mobile phone is now capable to predict that Yoko is going ot the office every day, from Monday to Friday at 7:00am. The application suggest Yoko a route to the office, she confirms it while having breakfast. Her smartphone responds presenting the following information: time of departure of the bus that Yoko should take, estimated time of arrival (ETA), route, weather conditions, pollen and CO2 levels of locations on her route. Since Yoko is allergic, she requests a new route avoiding the areas of high concentrations of pollen. The application notifies Yoko when to leave the house considering that if she misses the first option – e.g. the bus leaving in five minutes – she would be late to work since the next bus will leave in 20 minutes.
Today is Friday and she decides to go "shopping" downtown when she concludes her working day at noon. Yoko has actually no particular interest in buying anything, she just wants to walk through the city, take a snack and relax whilst visiting some of her most preferred shops.
2.2
Key Concepts
Analyzing the three motivating scenarios detailed in the previous section, a first set of key concepts can be detected. These concepts include
Smart city, as a set of digital services to citizens structured through different data and service layers. The smart city must be also considered as a set of open data gateways to various systems that operate in the city and contribute to the information society through open data interfaces.
Smart city application, as an application that must be downloaded by the citizens to their smart phone.
Smart city layer, as the repository of data and services accessible via the GAMBAS framework. A city could contain different layers organized by domain of application. Actually, within each of the domain of application, different concurrent service providers could establish its own layer.
AdGeosense, as various types of information that are closely linked to the position of the end-user.
Smart agent, as a mobile application on a smart device that can support the user to capture and share relevant and important information to support the operation of the city. This agent is the one enabling the citizen to become not only a consumer of information and services, but also a source of information for the smart city.
Voice tagging, as a way of using speech recognition to indicate any location within the city and provide a semantic reference. Later one this location can be looked up using voice recognition. The information gathered in this way is used in the behavior profile to identify locations.
The behavior profile concept, as a service in the cloud that stores the behavior of citizens on an anonymous basis and constitutes the citizen network layer with its own open data interface in order to provide feedback to the framework operating the city. The behavior profile relies on behavior pattern recognition for shopping, mobility, events, etc. and real time information feeds to detect events in the city, and identify important contexts such as crowed buses or areas as well as polluted areas, etc. The behavior profile can be connected to other profiles on the Internet such as Foursquare, Facebook, etc.
A critical functionality of the system is to suggest users the next target. The smart city application must be able to infer the next destination, or next action to be performed in the city by the citizen. This can be achieved automatically through the use of the behavior profile or interactively via voice or text interaction with the application interface. In any case, it
involves predicting the citizen’s next action in the city such as going to work, eating, shopping, visiting a place, going to the movies, etc. Even if the user has not set a target, the device at each change of context will attempt to infer the next target through access to the Behavior Profile.
the cloud. The cloud profile is used by other layers to offer services or to provide feedback of information to the rest of the smart city layers or to other citizens with a trust relationship. The smart city application interface must be simple and without distractions. This implies a
greater degree of prediction and complexity. This interface will be based primarily on speech recognition. Users select the smart city layers they want to use such as mobility, events, shopping, environment, etc. By accepting suggestions from the smart city application or by specifying their own next target, users can trigger actions. For this, the system must be able to recognize a vocabulary and to compute predicted targets, offering the citizens the most probable targets. Once an action has been triggered, the smart city application begins to infer and present dynamic information to the citizen.
All dynamic actions that can perform a citizen within the city involve the go to concept. It is the action of "go to" which establishes a space and time line characterizing the current and the future context of the citizen. It is this space-time frontier where the smart city interacts dynamically with the citizen, proposing information and alerting of changes in context affecting the user. Additionally, this change of context provides valuable feedback to other smart city layers.
The next target implies the calculation of the user’sfuture context and this context will be the one determining the information and the list of actions suggested to the user. As most objectives involve a "go to" trigger action, mobility will be one of the basic layers involved in most interactions between a citizen and the smart city.
2.2.1 Semantic Layer
The smart city vision adopted by the GAMBAS project requires a semantic layer as one of the key concepts enabling a broad applicability. This is the layer that represents knowledge and provides the basis for inferring reasoning and classification of the information.
A semantic layer involves ontologies with vocabularies and semantic boundaries in a meta-language. This will be the core that will provide basis for the intelligence to the smart city as it will enable the linking and relating of the information and services of different layers.
2.2.2 Citizen Network Layer
Among the different layers acting as gateway to different sources of data and services, one of the most important ones would be the citizen network layer.
This layer will manage the behavior profile of every citizen and would provide the following services: Registration services, citizens logs or patterns of tours.
Time behavior patterns such as shopping, food, entertainment, etc. Detection of incidents by agglomerations of people.
Location of citizens in whenever the citizen agrees on such tracking information, depending on privacy criteria and trust relationship with other users.
The backend of this layer would constantly calculate with each update of context from a smart device and using other layers of the smart city the relevant information for citizens such as the position of friends, for example.
2.2.3 Mobility Layer
The mobility layer in the context of the GAMBAS project will provide a gateway towards the information and services provided by the EMT public transport exploitation system (PTES).
This layer could provide services such as:
Routing between different points of the city. Status of traffic in the city.
Estimated time of arrival (ETA) at destination in real time. Scheduling of buses and lines.
Position of bus stops and lines. Number of passenger per bus.
The layer will not only serve the citizens of Madrid smart city to interact with the bus public network, but also will serve EMT to interact and retrieve information from its users, following one of GAMBAS main challenges – i.e. transform users in both consumers and sources of data.
Out of the context of GAMBAS, this layer would be extended with services from other transport operators and even with services and information from the municipality – e.g. incidents in roads or information about the subway network.
2.2.4 Environmental Layer
The environmental layer will offer services informing about the environmental status of any coordinates in a smart city. This information could be related to CO2 emissions, solar radiation, noise levels, pollen concentration, etc.
This layer could be a gateway to the municipality environmental sensing systems, but in the context of GAMBAS, it could also be the data storage of environmental information collected by public transport buses equipped with environmental sensors.
3
Building Blocks
Following the motivating scenarios and the key concepts identified in the previous section, the GAMBAS consortium has tried to establish a preliminary architecture that would enable the project vision.
The building blocks identified in this document, including its interfaces and the relationship among them, must be considered as a first draft of the reference architecture to be presented in the deliverables D1.3.1 and D1.3.2. Nevertheless, this initial effort must be documented in order to provide a formal description of the uses cases that have been analyzed – see Section 4.
In order to prevent privacy issues, the citizen network layer identified as key concept was transformed into a social layer. Actually, the functionalities – service and data – contained under the citizen layer were distributed among other components hosted on the personal mobile devices – i.e. the behavior profile. This way, the private data is never stored in the cloud, preventing both, the doubts and distrust from end users as well as the legal problems of storing private personal information.
However, even with a distributed behavior profile, the social layer is still needed in order to provide the services establishing the trust relationships between users –e.g. a ‘find my friends’ query. This is a layer that from a practical point of view was not associated with any existing service provider. In other words, and anticipating possible business models, there was no one offering or interested in offering the services associated with such a social layer –i.e. no company, at least within the consortium, would be offering services to track people and store profiles with its preferences.
Actually, a similar problem was observed when looking at the semantic layer, a critical building block that was hard to locate on just a single host. On the one hand, all the elements participating in the GAMBAS vision – mobile devices and layers – should store semantic data and run some basic queries. On the other hand, complex operations – as continuous queries – should exclusively be supported by the information and service layers in a smart city.
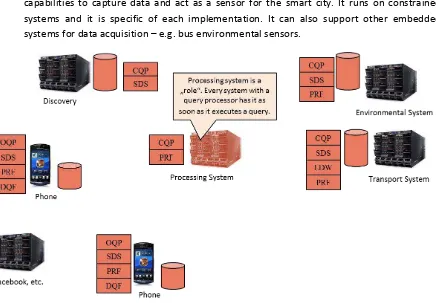
With this in mind, a number of architectural building blocks were identified in order to realize the implementation of the layers required for GAMBAS:
• OQP: One-time query processor. Software component capable of running semantic queries on constrained systems (i.e. smart phones and above).
• CQP: Continuous query processor. Software component capable of running complex queries on traditional systems (i.e. PCs and above).
• SDS: Semantic data storage. Software component capable of storing semantic data on constrained systems.
• LDW: Legacy data wrapper. Software component providing a specific gateway towards existing services and information. This component is specific for each implementation.
• PRF: Privacy framework. Software component capable of granting the privacy levels established by the end-user. It runs on constrained systems.
• DQF: Data acquisition framework. Software component capable of extending smartphone capabilities to capture data and act as a sensor for the smart city. It runs on constrained systems and it is specific of each implementation. It can also support other embedded systems for data acquisition – e.g. bus environmental sensors.
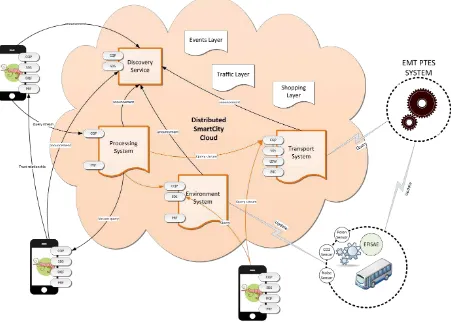
When distributing the building blocks among the different key concepts, some of them disappeared into an aggregation of different components – the semantic layer – and some of them still evolved towards new building blocks. This way, the information and service layers remained as key concepts in this preliminary architecture. Particularly:
The transport layer became the Transport System offering the gateway to the data and interfaces provided by the EMT Public Transport Exploitation System. As already explained in Section 2, this layer could also include information from other transport modes, or even be combined with a “traffic layer” to become a “mobility system”, however, in the context of GAMBAS the scope focuses primarily on the Madrid public bus network.
The environmental layer became the Environmental System offering the gateway to data related to environmental parameters such as CO2 emissions, noise level and pollen concentration. In the context of the project, these are the minimum variables that will be measured through the embedded sensors in the EMT bus network. From a conceptual point of view, the layer could also host other services and act as gateway to other repositories of data – e.g. the municipality network of environmental sensing stations, or any meteorological station.
Other layers that have been analyzed, but are out of the scope of the project, are the shopping layer, the event layer and the traffic layer. Actually, any third party willing to share information and services in the GAMBAS framework could be able to do so as far as it integrates the semantic and privacy building blocks.
A discovery service was pointed out as building block in charge of addressing the GAMBAS mobile application towards the relevant sources of information and services. Moreover this service will be responsible of receiving the manifest of functionalities and data that the rest of layers can provide.
The semantic layer evolved to a group of subcomponents distributed within the rest of the building blocks. In particular the semantic engine functionalities are now contented within the one time and continuous query processors. On the other hand, a semantic storage component was defined to host the semantic data on constraint devices.
in the context of GAMBAS, where queries involving transport and environmental services will make use of a third party processing system to return a response.
This approach has additional benefits, as moving the most complex stream queries to specialized hardware. Moreover, users may rely on these third party processing systems to take care of the semantic queries involving private information. In this way, they could grant certain privileges over its personal data during a specific period of time.
4
Use Cases
The GAMBAS project is tackling two different domains of applications in order to test and validate the building blocks identified in the previous section. These two domains are obviously related and limited by the background, interests and data that each partner within the project can provide to the consortium. Both, the mobility and the environmental scenario, rely on the sensors and data acquisition capabilities deployed at the Madrid bus network operated by EMT.
These capabilities, however, will be enhanced through the use of personal mobile phones to retrieve and capture new pieces of information – e.g. desired destination, predicted destination, noise levels,
event “out of bus”, etc. This will be done using the privacy framework that is developed during the
project, which will guarantee at any time that users willing to share certain bits of data, will be able to decide on which private information could be published and with whom this information could be shared.
The following sections present a breakdown of the motivating scenarios related to mobility and environment described in Section 2 into a number of use cases that can be analyzed individually in order to identify involved building blocks, required pieces of data and finally allocate responsibilities among partners for the later design and development of components. The analysis must be applications to be developed will first produce a design document based on the following use cases.
4.1
Mobility Scenario
The first scenario focuses on the functionalities of a Public Transport Exploitation System (PTES) and a GAMBAS mobile application to take into account the information retrieved directly from the user and to offer citizens customized services – not exclusively related to mobility though – in order to enhance their trip experience.
4.1.1 Use Case 01M: Adaptive Trip Planner
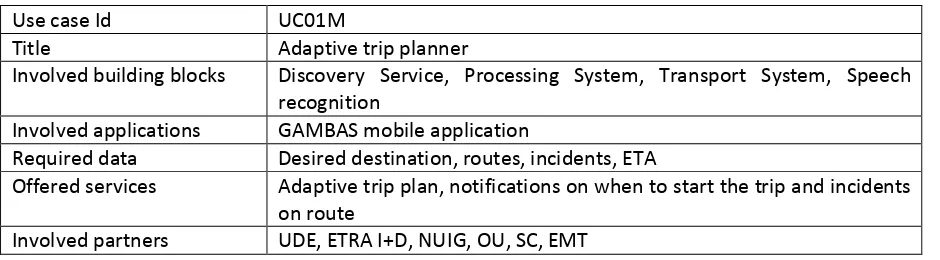
Use case Id UC01M
Title Adaptive trip planner
Involved building blocks Discovery Service, Processing System, Transport System, Speech recognition
Involved applications GAMBAS mobile application
Required data Desired destination, routes, incidents, ETA
Offered services Adaptive trip plan, notifications on when to start the trip and incidents on route
Involved partners UDE, ETRA I+D, NUIG, OU, SC, EMT
Table 1 – Adaptive Trip Planner Summary
the user. Optional, the user can tag this location with a Voice Tag using speech recognition. In this way, the user could have the opportunity to further request this location by the given tag.
The target point is determined by a capture of "GoTo", which may come from a speech analysis interface asking the device for a Point of Interest (POI), from a direct selection on a map, from a predictive inference by the device after analyzing the historical behavior of the user, or from the analysis of the next appointments in its agenda.
Gambas App Discovery Service Processing System Environment System
Select info layers
Stream query route from location to POI/location (CQP)
Public data
Figure 4 – Adaptive Trip Planner Sequence Diagram
Estimated Time of arrival (ETA) and traffic conditions may change during the day. The user will be notified by the device when to start the long route to reach its destination. Since the user origin position may change, it could trigger a new route calculation and an update on the ETA.
The device should allow a Processing System to continuously capture its position as it changes. The
location to the authorized Processing system. The Processing System, identifying a change in the user position, will update the query to the Transport System to recalculate the route. The updated information - route and/or ETA - will be presented to the user as an alert.
This use case actually describes an adaptive trip planner that considers the user position – evolving on time, the actual traffic conditions and the actual times of service of the public bus transportation system.
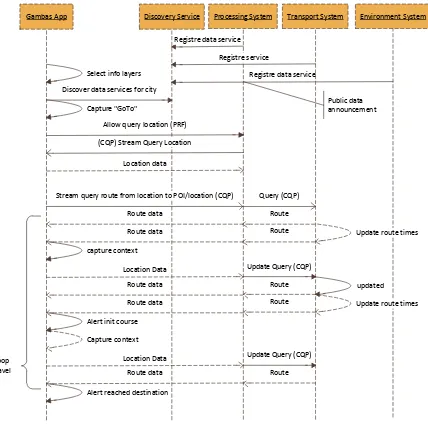
4.1.2 Use Case 01.1M: Adaptive Intermodal Trip Planner
Use case Id UC01.1M
Title Adaptive intermodal trip planner
Involved building blocks Discovery Service, Processing System, Transport System A, Transport System B
Involved applications GAMBAS mobile application
Required data Desired destination, routes, incidents, ETA
Offered services Adaptive trip plan, notifications on when to start the trip and incidents on route
Involved partners UDE, ETRA I+D, NUIG, OU, EMT
Table 2 – Adaptive Intermodal Trip Planner Summary
As an extension of the basic mobility use case, intermodal trips could be considered. To that end, different strategies can be defined:
a) Existence of more than one “Transport System” and a third party Processing System. This is
actually the most probable scenario, closest to real life. Each of the public transport operators in a city maintains its own transport layer to publish data and services that can be used directly by the end-user or queried by a third processing system to establish and offer added value services – as intermodal plans. This is the strategy followed currently by Google. In GAMBAS, any third party could access the open data and services since we are relying on open data specification and discovery services.
b) Existence of a “Transport System” covering more than one mode of transport. In cities where
the public transport operator is responsible of more than one mode of transport – e.g. Paris and Barcelona – the transportation layer could actually be more complex and natively support the queries for intermodal trips – with its ETAs, incidents management, etc.
c) Existence of a “Transport System” willing to support external processing queries. Since a
“Processing System” is basically any engine capable of receive and treat semantic queries, a transport operator could be interested in extending its own processing system – used for its particular transport queries – to interact with other transport systems and offer its clients an enhanced trip planner service.
In all three cases, the feasibility of the use case depends on the capabilities of the query language to be selected and the richness of the available ontologies and data.
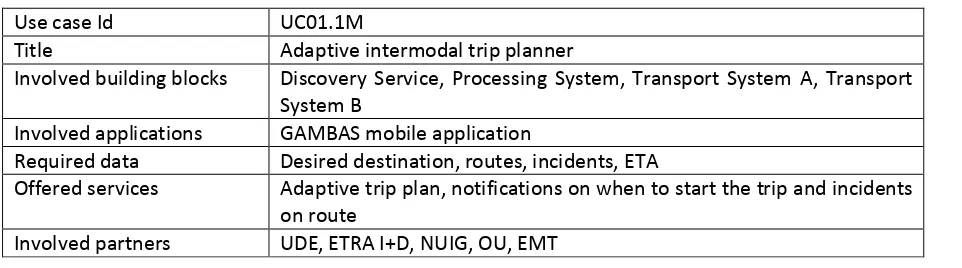
4.1.3 Use Case 01.2M: Adaptive Intermodal Trip Planner with Park and Ride
Use case Id UC01.2M
Title Adaptive intermodal trip planner with park and ride
Involved building blocks Discovery Service, Processing System, Transport System, Parking Layer Involved applications GAMBAS mobile application, Parking Management application
Required data Desired destination, routes, incidents, ETA, position of available parking lots
Offered services Adaptive trip plan, notifications on when to start the trip and incidents on route, automatic booking of parking lot.
Involved partners UDE, ETRA I+D, NUIG, OU, EMT
Table 3 – Adaptive Intermodal Trip Planner with Park and Ride Summary
This case presents an extension of the previous two uses cases, and specifically of UC01.1M. In this use case, the user wants to go by car to a parking area and then continue its trip to its destination by public transport. This is actually a combination of two adaptive route calculations, plus an automatic parking booking procedure.
The automatic booking procedure was already presented at the PECES project [PECES], where the core of the GAMBAS consortium was also involved (UDE, ETRA, and NUIG). First, the mobile application – with navigation capabilities – calculated the route by car to the closest parking to destination. This already relied on a set of ontologies delivered by the project.
The parking management system was adapted to actually publish 1) its location, 2) the number of available parking lots and 3) a booking service.
Second, with this information, the mobile application was able to book a parking lot and lead the user to it. This was done minimizing the user interactions with the system, without distracting the driver from its main driving activity.
Last but not least, the parking was able to detect the user – associated to a car id by its plate number
Gambas App Discovery Service Processing System Parking Layer
Stream query route from to POI (CQP) [mode car]
Route data
Query (CQP)
Stream query route from location to POI/location (CQP) [mode TP]
Route data
Query (CQP)
loop travel ( UC01M )
Figure 5 – Adaptive Intermodal Trip Planner with Park and Ride Sequence Diagram
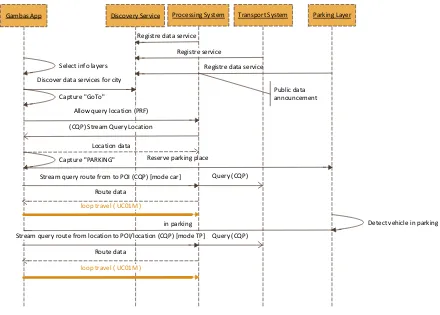
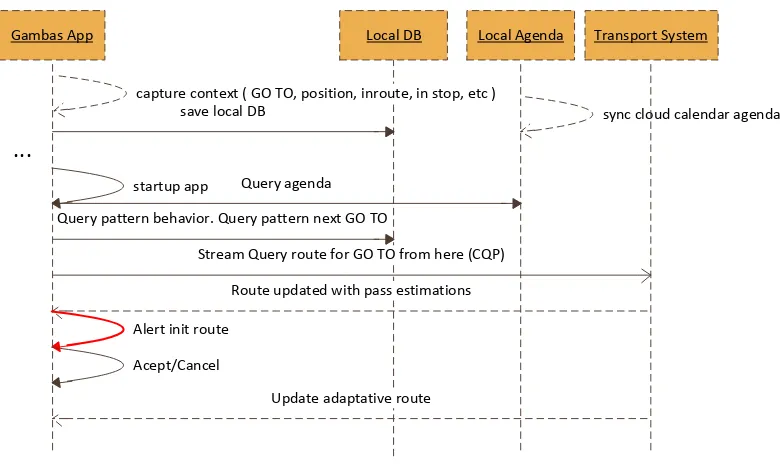
4.1.4 Use Case 02M: Predictive Destination
Use case Id UC02M
Title Predictive destination
Involved building blocks Discovery Service, Processing System, Transport System Involved applications GAMBAS mobile application
Required data User position, routes, historical use of routes and positions
Offered services The GAMBAS mobile application will suggest the user a list of more probable next target actions – in this case next GoTo destinations. Involved partners UDE, ETRA I+D, NUIG, OU, EMT
Table 4 – Predictive Destination Summary
The predictive destination use case presents one of the core functionalities under the GAMBAS vision. The application at the smart phone must be able to infer the possible next destination of its user. This will be done by storing on the mobile device the position and routes the user had been using, and making a statistical analysis at the end of each day.
This information could be later available – making use of the privacy framework – by third parties in order to establish joint routes with users sharing same predicted destination.
Gambas App Local DB Local Agenda
capture context ( GO TO, position, inroute, in stop, etc ) save local DB
startup app
sync cloud calendar agenda
Query agenda
Query pattern behavior. Query pattern next GO TO
Transport System
...
Stream Query route for GO TO from here (CQP)
Route updated with pass estimations
Alert init route
Acept/Cancel
Update adaptative route
Figure 6 – Predictive Destination Sequence Diagram
4.1.5 Use Case 03M: Demand Response in Real Time
Use case Id UC03M
Title Demand response in real time
Involved building blocks Discovery Service, Processing System, Transport System
Involved applications GAMBAS mobile application, EMT Public Transport Exploitation System
Required data Desired destination
Offered services Adaptive trip plan, adaptive operations on bus service – e.g. increase the number of buses
Involved partners UDE, ETRA I+D, NUIG, OU, EMT
Table 5 – Demand Response in Real Time Summary
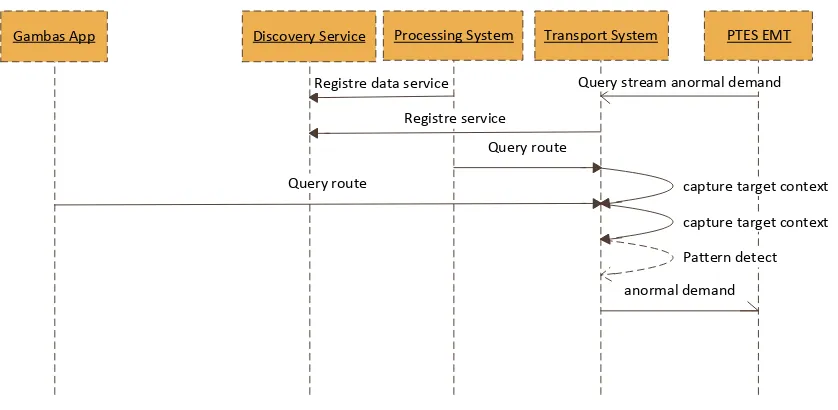
This use case focuses on the feedback that the public transport operator (EMT) could obtain from data mining systems in real time. The layer that offers transport information to the travelers in real time (Transport System) is capable to detect anomalies in the service. This is the case when there are too many users in a given time window requesting the same destination. This could be the case when a big event – a concert or a football match – is programmed in the city.
The Public Transport Exploitation System could react to this anomaly by increasing the number of buses in real time. Furthermore, the network operator could modify some routes to attend the increasing demand in one route.
Gambas App Discovery Service Processing System PTES EMT
Figure 7 – Demand Response in Real Time Sequence Diagram
4.1.6 Use Case 04M: Demand Response from Statistics
Use case Id UC04M
Title Demand response from statistics
Involved building blocks Discovery Service, Processing System, Transport System
Involved applications GAMBAS mobile application, EMT Public Transport Exploitation System
Required data Desired destination
Offered services Adaptive trip plan, Adaptive operations on bus service – e.g. increase the number of buses
Involved partners UDE, ETRA I+D, NUIG, OU, EMT
Table 6 – Demand Response from Statistics Summary
With the same retrieved data as in the previous use case, the public transport operator could not only ask for anomalies but also to analyzed the information a posteriori in order to affect the different bus lines and schedules to improve the quality of the service.
This is particularly important when a new line is opened and the number of buses per line and timings need to be adjusted.
4.1.7 Use Case 05M: QoS Indicator through Estimation of Passengers per Bus
Use case Id UC05M
Title QoS indicator through estimation of passengers per bus Involved building blocks Discovery Service, Transport System
Involved applications EMT Public Transport Exploitation System Required data MAC addresses detected inside the buses Offered services Report on the lines with highest occupancy Involved partners UDE, ETRA I+D, NUIG, OU, EMT
The control unit inside the bus (BIT) is capable of detecting the MAC address of the smart phone entering and leaving the bus – see Figure 8. This will be used to calculate an estimated number of passengers in each bus.
This information will be managed by the Transportation System, and the Public Transport Information System used by the EMT will have access to it to create an indicator on the occupancy level of each bus and line. This is a very interesting metric, not only for end-users, but also for the network operator to adapt the type of vehicles used in the line to the expected demand over time. Thus, UC05M is closely related to the previous use cases UC03M and UC04M. The main difference is in the data acquisition process used to estimate the demand. In the previous two ones, such an indicator was established with the requests coming from the GAMBAS mobile application, whilst in the present use case the indicator is built based on the passively retrieval of information from the smartphones accessing the buses.
4.1.8 Use Case 05.1M: Added Value Services based on QoS Crowded Bus Metric
Use case Id UC05.1M
Title Added value services based on QoS crowded bus metric Involved building blocks Discovery Service, Transport System
Involved applications GAMBAS mobile application
Required data Routes, MAC addresses detected inside the buses Offered services Route with the lowest number of passenger per bus Involved partners UDE, ETRA I+D, NUIG, OU, EMT
Table 8 – Added Value Services based on QoS Crowded Bus Metric Summary
In the same way the crowded metric can be valuable for the transport operator, the GAMBAS mobile application could use this piece of information to establish complex queries, involving not only the desired destination, but also imposing constraints on the how crowded the selected route – specific bus – may be.
In this way, the traveler could use a composite trip planner that would require as input data not only the final destination, but also parameters as “allowed crowd level in a bus”, “preference in travelling
with a friend” or “preference in making use of a low polluted route”
Gambas App Discovery Service Transport System PTES EMT
4.1.9 Use Case 06M: Added Value Services based on Shopping Layer
Use case Id UC06M
Title Added value services based on Shopping layer Involved building blocks Discovery Service, Processing System, Shopping layer Involved applications GAMBAS mobile application, Shopping announce system Required data Offers, shops positions, wish list
Offered services Customized information related to shopping Involved partners UDE, NUIG, OU
Table 9 –Added Value Services based on Shopping Layer Summary
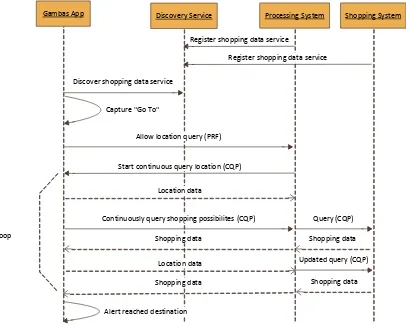
The user is interested in knowing the shopping possibilities (special offers, new shops, sporting equipment etc.) while travelling from point A to point B. This interest can be registered either by user speaking it to the phone or by setting it visually using the GAMBAS shopping application. The user is encouraged to use the shopping layer app by getting discount coupons, e.g. doing grocery from a suggested store will give users discount coupons for filling tanks at particular gas stations. On the other hand, the shopping stores may benefit from announcing themselves on GAMBAS app by having their advertisements send to other users.
Gambas App Discovery Service Processing System
Register shopping data service
Shopping System
Register shopping data service
Discover shopping data service
Allow location query (PRF)
Start continuous query location (CQP)
Location data
Continuously query shopping possibilites (CQP) Query (CQP)
Shopping data Shopping data
Location data Updated query (CQP)
Shopping data Shopping data
Alert reached destination Capture "Go To"
loop
Figure 9 –Added Value Services based on Shopping Layer Summary
During the travel to point B, based on the user’s preferences the user is notified about the shopping possibilities that are nearby and will not require user to alter his path of travel and also those possibilities which are not nearby and will require change in user’s path to the destination. The notification of shopping possibility is announced either on the device’s screen and/or using a device’s speakers. Nevertheless, this scenario was one of the original ones motivating the project, since it describes the use of two completely different sources of information, in order to provide a new functionality to the user: customized shopping information on route from point A to point B.
This use case could also be extended in the context of the mobility scenario by sending the offers directly to the bus information screens, or even to the bus stops, adapting the advertisements to the public interests in real time.
4.1.10 Use Case 07M: Added Value Services based on Social Layer
Use case Id UC07M
Title Added value services based on Social Layer
Involved building blocks Discovery Service, Processing System, Transport System Involved applications GAMBAS mobile application
Required data Desired destination, routes, incidents, ETA, position of people, friend relationship
Offered services Adaptive trip plan, notifications on when to start the trip and incidents on route, position of friends
Involved partners UDE, ETRA I+D, NUIG, OU, EMT
Table 10 –Added Value Services based on Social Layer Summary
The user is interested in knowing the possibilities to meet friends or become part of different social activity groups (reading group, ice hockey playing group etc.) during his movement from point A to point B. The user can specify this interest by speaking it to the phone or by setting it visually using the GAMBAS social layer application, as it was done in UC01M.
During travel to point B, the user is notified of the possibility to meet a friend (listed in the users contact list, retrieved from a social network or explicitly specified by the user). Similarly, the user is also notified about nearby social activity groups.
In order to get the notifications the user will be required to send his current location continuously to the processing system. The user retrieves the location of the friend or the interested social activity group using the Discovery Service and the Processing System. This information can be retrieved from
the user’s online social media profiles. Based on this information the processing system will send a continuous query containing the friend/social activity group to the user. The device can then notify
playing ice hockey are gathered in a bar 800 meters to your left”. The sharing of information from a
friend or any social activity group will be done with their consent. If the friend/social activity group is in immediate vicinity, it is possible to start a peer-to-peer interaction with the device(s).
In order to avoid the explicit existence of a social layer – the citizen network layer identified in section 2 as strong concept – the preliminary architecture that arises from the building blocks defined in section 3 enables GAMBAS to appoint a processing system for a specific period of time as responsible of tracking the user willing to meet friends. In this way, private data is never stored out of the personal GAMBAS mobile phone application, and the user can at any time decide on which data is going to be shared and for how long its position is going to be tracked.
Gambas App Processing System Start the location query on the friend/activity group's location
Retrieve the friends from the user's contact list, social network, etc. (PRF)
Contact friend/activity group for location (PRF)
Update friend/activity group location from continuous query (CQP) Get the route from the user
Figure 10 –Added Value Services based on Social Layer Sequence Diagram
4.2
Environmental Scenario
The following sections introduce a new area of application. However, as already explained, this area
Thus, most of the uses cases described hereafter rely on the data being captured from EMT Public Transport Exploitation System. Nevertheless, the different pollution levels could also be obtained from other sources as the municipality environmental sensing stations. Whenever it has been possible, the description of the use case has been kept independent to the origin of data, making the environmental scenario as independent to the mobility one as possible.
4.2.1 Use Case 01E: Running with a Friend
Use case Id UC01E
Title Running with a friend
Involved building blocks Discovery Service, Processing System, Transport System, Environmental System
Involved applications GAMBAS mobile application
Required data Desired destination, routes, incidents, ETA, position of people, friend relationship, levels of pollution
Offered services Adaptive trip plan based on pollution levels, notifications on when to start the trip and incidents on route, position of friends.
Involved partners UDE, ETRA I+D, NUIG, OU, EMT
Table 11 – Running with a Friend Summary
This use case describes the use of the GAMBAS framework to design the less polluted jogging route and share it with another user.
The trigger action is a user trying to design a circular route for jogging in the less polluted and quieter area of the city. The user will query the environmental map of the city and select the intermediate points to design the route. It would also like to share this route with a friend who lives in another part of town in order to run parts of the route together.
Gambas App Discovery Service Processing System Environment System
Figure 11 – Running with a Friend Sequence Diagram
4.2.2 Use Case 02E: Pollution Map (Noise, Pollen and CO2 from Bus Sensors)
Use case Id UC02E
Title Pollution map (noise, pollen and CO2 from bus sensors) Involved building blocks Environmental System
Involved applications Environmental application
Required data Noise, pollen and CO2 levels, position of bus and time Offered services Pollution map of the city
Involved partners UDE, ETRA I+D, NUIG, EMT
Table 12 – Pollution Map (Noise, Pollen and CO2 from Bus Sensors) Summary
This use case describes how to obtain a map of pollution (C02, noise and pollen) from the city public bus network.
national level conferences [@asLAN] – was originally designed to improve driving efficiency. Its current implementation addresses the data acquisition needs of an eco-driving application for drivers based on data obtained from the bus.
Figure 12 – Basic Hardware to Capture Environmental Data in Buses
As a first step, the EFISAE firmware will be adapted to connect to the new sensors. This information will be processed by the on-board control unit in each bus (BIT) in charge of communication, positioning and ticketing. This unit will feed the environmental system with the retrieved information, positioning and timing. Finally, an environmental application will process the data in order to build environmental pollution maps and offer them in the Internet.
EFISAE BIT Environment System
Capture Co2
Capture Pollen
Capture Noise (FFT )
Update geocoded env. data process noise
Environment App
Request Env Data
Figure 13 – Pollution Map (Noise, Pollen and CO2 from Bus Sensors) Sequence Diagram
4.2.3 Use Case 02.1E: Pollution Map (Noise Detected by Mobile Devices)
Use case Id UC02.1E
Title Pollution map (noise detected by mobile devices)
Involved building blocks Discovery Service, Processing System, Environmental System Involved applications GAMBAS mobile application
Required data Position of people, levels of noise Offered services Noise map
Involved partners UDE, ETRA I+D, NUIG, OU
If the user agrees in the privacy settings to record noise levels on the path through town, the data will be shared to create a noise profile of the city. The noise information in combination with the location and time of the day will be used to create a time depending map of noise levels within the city. This information can be used directly for the selection of jogging routes. The pollution map can also be used by the city government to identify suitable locations for child care centers or retirement homes.
Updated time depend noise level map of the city Processing System
Register system
Forward update
Loop
Figure 14 – Pollution Map (Noise Detected by Mobile Devices) Sequence Diagram
4.2.4 Use Case 03E: Alert of High Level of Pollen in Area
Use case Id UC03E
Title Alert of high level of pollen in area
Involved building blocks Discovery Service, Processing System, Environmental System Involved applications GAMBAS mobile application
Required data Position of people, levels of pollen
Offered services Alerts based on high concentrations on pollen Involved partners UDE, ETRA I+D, NUIG, OU
Table 14 – Alert of High Level of Pollen in Area Summary
The information retrieved thanks to the mechanisms described in the previous two use cases, can not only be used by a third party to build a pollution map of a city, but also directly by a GAMBAS application to subscribe to alerts on high concentration of pollen.
Gambas App Discovery Service Processing System
In this use case, the GAMBAS application asks for the concentration of pollen related to its current position. The query could also be extended to the predicted position of the user, since this information is also available at the mobile application. A processing system is then in charge of obtaining the pollen concentration each time the GAMBAS apps update its position, and pushing an alert whenever the pollen pollution reaches a certain threshold – previously selected by the end user.
Of course, the user could consult at any time the pollution map of an area described in UC02E. However, the purpose of this use case is to automatically inform the user on the levels of pollen, based on the very same data that is used to build the maps, offering a customized service.
4.2.5 Use Case 03.1E: Alert of High Level of Pollen in Planned Bus Route
Use case Id UC03.1E
Title Alert of high level of pollen in planned bus route
Involved building blocks Discovery Service, Environmental System, Transport System Involved applications GAMBAS mobile application
Required data Desired destination, levels of pollen, routes
Offered services Alerts based on high concentrations on pollen on route Involved partners UDE, ETRA I+D, NUIG, OU, ETRA
Table 15 – Alert of High Level of Pollen in Planned Bus Route Summary
As an extension to the previous use case, GAMBAS framework alerts the user about high levels of pollen in certain sections of its route. This is an additional piece if information to the adaptive trip planner functionality presented in the mobility scenario.
Gambas App Discovery Service
Registre data service
Environment System
Registre service Select alert pollution
Transport System
Registre service
Query route (OQP)
Query polutions in points (OQP) Discover services
Alerts
Figure 16 – Alert of High Level of Pollen in Planned Bus Route Sequence Diagram
This use case explores all the capabilities offered by the GAMBAS approach. Neither the Environmental nor the Transport System has all the information to respond to the user query “alert if
one of the constraints to define the trip. It is thanks to the combined use of both sources of data, that a new service can be proposed to the users of the public transport network.
4.2.6 Use Case 04E: Urban Tolling Depending on CO2 Pollution
Use case Id UC04E
Title Urban tolling depending on CO2 pollution
Involved building blocks Discovery Service, Processing System, Environmental System, Tolling Layer
Involved applications GAMBAS mobile application
Required data Desired destination, tolling information, CO2 levels
Offered services Adaptive trip plan based on pollution levels, notifications urban tolling prices depending on CO2 emissions.
Involved partners UDE, ETRA I+D, NUIG, OU
Table 16 – Urban Tolling Depending on CO2 Pollution Summary
Nowadays urban tolling is mainly used to reduce pollution and traffic in the most congested areas of a city. The policies behind it normally rely on statistical or real time information on levels of CO2 and the characteristics of the vehicles – e.g. type of engine, year of manufacturing, etc. With this information, authorities may decide the number and kind of vehicles allowed in a certain area on a certain period of time.
In this use case the objective is to provide the mechanisms to adapt the policies in place and modify the behavior of drivers by affecting the price to access a polluted area depending on the levels of CO2. Thus, the GAMBAS framework serves to calculate a variable toll for private vehicles accessing areas with high pollution levels.
Figure 17 – Urban Tolling Depending on CO2 Pollution Sequence Diagram
policies with High Occupancy Vehicle lanes (HOV) to save CO2 emissions and reduce the number of vehicles in city centers.
Moreover, the tolling could not only depend on the levels of CO2, but also on the noise levels – much more critical in certain areas.
In order to be able to implement this use case, a Smart City Tolling layer should be provided – out of the scope of the project. This layer could also be used by authorities to implement shadow toll policies based on number of vehicles in inter-urban roads.
4.2.7 Use Case 04.1E: Alert If Urban Tolling Higher than a Certain Price in Planned Route
Use case Id UC04.1E
Title Alert if urban tolling higher in a planned route
Involved building blocks Discovery Service, Processing System, Environmental System, Tolling Layer
Involved applications GAMBAS mobile application
Required data Desired destination, tolling information, CO2 levels
Offered services Adaptive trip plan based on pollution levels, notifications urban tolling prices depending on CO2 emissions.
Involved partners UDE, ETRA I+D, NUIG, OU
Table 17 – Alert If Urban Tolling Higher than a Certain Price in Planned Route Summary
As an extension on the previous presented use case, the user may prefer to program an alert whenever the fee to access a certain area with an urban tolling system reaches a certain price. This functionality is actually the natural complement to the functionality presented at UC04E, where the objective was to grant the authorities with the mechanisms to establish new adaptive policies. If such policies were in place, drivers would require not only to access the current cost of the toll, but also to be notified about changing prices in real time. This would be especially critical if the authority adopted complex algorithms to establish the final price.
Gambas App Discovery Service Processing System
Detect near toll area Query Tolling Tax (OQP)
Alert
Both UC04E and UC04.1E could be combined with the following use case to promote the use of public transport and reduce the environmental footprint per passenger (UC06E).
4.2.8 Use Case 05E: Public Transport Incentives Depending on Pollution Levels
Use case Id UC05E
Title Public Transport Incentives depending on Pollution levels Involved building blocks Discovery Service, Processing System, Transport System
Involved applications GAMBAS mobile application, EMT Public transport Exploitation System Required data Desired destination, CO2 levels, prices
Offered services Suggested public transport route with incentives in response to a high pollution level.
Involved partners UDE, ETRA I+D, NUIG, OU, EMT
Table 18 – Public Transport Incentives Depending on Pollution Levels Summary
Complementing the policies at UC04E, this use case could be used by municipalities to incentive the use of public transport whenever a pollution crisis is detected – high levels of CO2 in an urban area. The business case could rely in a sort of shadow tolling for citizens, where the municipality would cover the costs of the incentives, paying the transport operator for each of the citizens moving from private to public modes of transport.
From the point of view of feasibility, this is one of the most difficult use cases to be implemented, since it requires the active involvement of an authority willing to promote this shift in citizens’ mobility behavior. Nevertheless, shadow tolling is a concept extensively employed in transport, and the transferability of this approach to people could be studied.
In the context of GAMBAS, the interest is to explore the feasibility from a technical point of view, thanks to the tools and components provided within the project.
Gambas App Discovery Service Transport System
Registre data service
Environment System
Registre service
Calculate promotion
Discover services Query pollution data
PTES EMT
Publish company info select info layers
Stream Query Transport Notifications [CQP]
Tranport Company Notifications
4.2.9 Use Case 06E: Environmental Footprint for Public Transport Passengers
Use case Id UC06E
Title Environmental footprint for public transport passengers Involved building blocks Discovery Service, Transport System
Involved applications GAMBAS mobile application
Required data Desired destination, routes, number of passengers in bus, CO2 emissions from bus
Offered services Customized Environmental footprint based on real time data from bus Involved partners UDE, ETRA I+D, NUIG, OU, EMT
Table 19 – Environmental Footprint for Public Transport Passengers Summary
Thanks to the already existing eco-driving systems in the public transport network operated by EMT – described in UC02E, it is possible to calculate the CO2 emissions per bus between two different points of a route.
In order to make use of this data and provide the CO2 emissions per passenger, it is necessary to establish the number of passenger in the bus at each time. This can be achieved through different mechanisms. In other mode of transports – such as subway – it is achieved through the use of specific access turnstiles; in GAMBAS it is achieved by the same mechanisms described in UC05x: the onboard control unit (BIT) is capable of detecting passengers getting on and off the bus by detecting the MAC addresses of their smartphones.
At the end of a stretch between two consecutive bus stops, the transport system can update the information on the number of passenger and the CO2 emissions in a specific stretch for a specific bus. These emissions will depend on the conditions of the bus – mainly the use of heat, ventilation and air condition systems, HVAC - the behavior of the driver, and the traffic conditions.
Figure 20 – Environmental Footprint for Public Transport Passengers Sequence Diagram