Efficacy of Propolis Supplementation to Accelerate Healing Process and Body
Weight Recovery of Pulmonary Tuberculosis Patients
Mahani1,2, Ahmad Sulaeman1*, Faisal Anwar1, Muhammad Rizal Martua Damanik1, Hardinsyah1, Angelika Ploeger3
1Department of Community Nutrition, Faculty of Human Ecology, Bogor Agricultural University, Bogor 16680, Indonesia
2Department of Food Technology, Faculty of Agricultural Industrial Technology, Padjadjaran University, Jatinangor 45363, Indonesia
3Department of Organic Food Quality and Food Culture, Faculty of Organic Agricultural Sciences, University of Kassel, D-37213, Germany
ABSTRACT
This study aimed to evaluate the pace of curing process and body weight recovery of pulmonary tuberculosis (Tb) patients receiving propolis supplementation. This study was a randomized controlled trial conducted on 50 pulmonary Tb patients that were assigned into three groups as follows: receiving dose antituberculosis drugs (ATDs) + 20 drops of placebo propolis (P0); receiving standard-dose ATDs + 20 drops of propolis with concentration of 6% (P1); and receiving standard-standard-dose ATDs + 20 drops of propolis with concentration of 30% (P2). The results showed that the mean time ratio needed for sputum smear conversion to negative present of acid resitant bacteria in P0, P1 and P2 groups were weeks 10, 8 and 5, respectively. In the second week, mean body weight of P0 and P1 groups decreased by 2.4% and 0.2%, respectively. In contrast, the mean body weight in P2 group increased by 1.5% (p<0.05; Mann-Whitney test). In the same week, mean body mass index (BMI) of P0 and P1 groups decreased by 1.6 and 0.1, respectively. Conversely, the mean BMI of P2 group increased by 0.3. The changes were significantly different (p<0.05). The results conclusively indicated that supplementation of 20 drops of propolis with a concentration of 30% as an adjuvant to standard ATDs for the treatment of pulmonary Tb patients was beneficial to accelerate treatment effect and body weight recovery.
Keywords: body weight, cure, liquid propolis, pulmonary Tb
*Corresponding Author: [email protected]
ISSN 1978-1059 EISSN 2407-0920
INTRODUCTION
Tuberculosis (Tb) is a global infectious disease problem and becoming the second lead-ing cause of death after HIV/AIDS infection. Indonesia is ranked 2nd out of 30 high burden
countries in the world (WHO 2016). Tb treat-ment and cure requires regular consumption of anti-tuberculosis drugs (ATDs) every day with-out interruption for a substantially long term peri-od. One of the problems faced in the use of ATDs to date is its hepatotoxic properties (Chowdhury et al. 2006; WHO 2013). The hepatotoxic effects of ATDs can cause decrease in appetite, nausea, dizziness, insomnia, fever and weight loss (Ke-menkes 2009; Sudarsanam & Tharyan 2014; Sari et al. 2014). These hepatotoxic effects further cause decline in nutritional status of the patients, whereas good nutritional status strongly supports cure (Semba & Bloem 2001). Thus, the provision of hepatoprotective materials is expected to
duce hepatotoxic effects that eventually may re-store body weight (BW) faster.
num-ber of studies have also revealed that propolis synergizes with ampicillin, gentamycin and strep-tomycin to eradicate M. tuberculosis (Scazzoc-chio et al. 2006); synergizes with streptomycin, rifampicin, isoniazid and ethambutol (Scheller et al. 1999); as well as synergizes with streptomycin and cloxacyllin (Krol et al. 1993). The synergy of propolis with antibiotics commonly use for Tb treatment, lead to potential acceleration of the healing process. However, a study from Halim et al. (2012) suggested that Indonesian propolis had a potential good efficacy, thus needs further study.
Based on the above reasoning, propolis with its dual ability (as hepatoprotector and also fighting M. tuberculosis infection) has a potential properties to accelerate the cure process and BW recovery of pulmonary Tb patients. Thus, this study aimed to evaluate the ability of propolis to accelerate the cure process and BW recovery of pulmonary Tb patients.
METHODS Design, location, and time
The design used was randomized con-trolled trial, consisting of one positive control group and two treatment groups. The study was conducted in 24 public health centers (Puskes-mas) in Bogor City, which lasted from December 1, 2015 to November 29, 2016. ATDs’ packages were obtained from Puskesmas. Liquid propolis used was derived from the extraction of
Geniotri-gona incisa bee propolis from South Sulawesi
that had passed a series of screening process.
Sampling
A total of 50 Tb patients were determined according to sample size table for controlled clin-ical trial with α of 0.05 and 80% power, result -ing in 13 subjects per group (Chow et al. 2008). The subjects were recruited from all Puskesmas in Bogor City with a) inclusion criteria: Tb pa-tients, adults aged 15-60 years, were willing to participate in the study by signing informed
con-sent; and b) exclusion criteria: recurrent Tb pa-tients, smoking, had hepatitis or other diseases that interfered the study, alcohol drinkers, preg-nant, breastfeeding, using contraception, taking other drugs/herbal medicine/supplements. The subjects’ age criterion was based on National Guidelines for Tuberculosis Control (Kemen-kes 2014); i.e. adult patients (15 years or older). However, it was stated in the guidelines that adult patients aged over 60 years old were not able to tolerate drug dose of >500 mg/day, thereby the subjects in this study were adult patients aged 15-60 years. Considering that the age range was too wide and it had the potential to produce dif-ferent responses to the intervention, the adult pa-tients in this study were divided into two groups based on the age groupings by Ministry of Health
(Kemenkes) (2009), namely adolescents (15-25
years) and adults (26-60 years).
The research consisted of one positive control group and two treatment groups (Table 1). Each subject received 6-month intervention according to National Guidelines for Tubercu-losis Control (Kemenkes 2014). Permuted block randomization was used to obtain subjects with equal sex and age groups (Chow & Liu 2004). In-tervention and analysis were double-blinded (not known by the subjects, researchers, assistant or analyst).
Each group (P0, P1 and P2) had an equal number of subjects, either based on sex (male and female) or age groups (adolescents aged 15-25 years and adults aged 26-60 years), by using permuted block randomization. The blocks in each group were made based on sex (male and female) and age groups (adolescents and adults). Thus, each group consisted of four blocks; i.e. 1) male-adolescents, 2) male-adults, 3) female-adolescents and 4) female-adults. Each time a subject was obtained, the placement in the group was done by taking a roll of paper containing P0, P1 and P2 codes. The subjects were placed ac-cording the group code drawn. Placement of the subjects was repeated if there was a sequential placement more than once in the group and the block.
Group Intensive phase every day for 8 weeks RHZE (150/75/400/275)+ Propolis
Continuation phase 3 times a week for 16 weeks RH (150/150) + Propolis
P0 4 4FDC tablets + 20 drops of placebo propolis 4 2FDC tablets + 20 drops of placebo propolis P1 4 4FDC tablets + 20 drops of 6% propolis 4 2FDC tablets + 20 drops of 6% propolis
P2 4 4FDC tablets + 20 drops of 30% propolis 4 2FDC tablets + 20 drops of 30% propolis
Description: FDC = Fixed-Dose Combination. The dose of ATDs used was the dosage for adult patients according to the tional Guidelines for Tuberculosis Control (Kemenkes 2014).
Recruitment and screening of prospective subjects were performed by Tb program officers in all Puskesmas in Bogor City. The screening was conducted by listing, checking the sputum and interviewing the visitors in Tb eradication program section in Puskesmas. If the visitors met the inclusion and exclusion criteria, they were determined as prospective subjects. Prospective subjects were then offered to be research subjects. If they agreed, the Tb program officers in Puskes-mas reported it to the researchers. Subsequently, the signing of informed consent was done by the researchers and the subjects, and continued with baseline data collection immediately before the intervention was conducted.
Distribution of ATDs to the subjects was conducted by Puskesmas’s Tb program officers. Meanwhile, propolis distribution was done by the research assistant who also acted as a drug con-sumption supervisor (DCS). During the intensive treatment period (the first two months), the DCS visited the subjects every day to ensure that they actually consumed the ATDs and propolis. Du-ring the continuation treatment period (the 3rd-6th
months), the DCS visited three times a week. This study had obtained ethical approval from Health Research Ethics Committee, Faculty of Medicine of University of Indonesia number: 1036/UN2.F1/ETIK/2015.
Data collection
The observation parameters covered: 1) M. tuberculosis acid-resistant bacteria (ARB) that included positive 3, positive 2, positive 1 and negative in ARB; 2) anthropometric measure-ments: body height (measured once at the begin-ning), BW and body mass index (BMI). The data were collected in week 0 (before intervention as baseline data), every week during intensive treat-ment phase in the first two months, and every month during continuation treatment phase (from the 3rd month to the 6th month).
The materials used for sputum’s ARB analysis (Ziehl-Neelsen stain method) were spu-tum of the subjects, 70% alcohol, carbol fuchsin, 3% alcohol, water, 0.3% methylene blue solution, 0.1% methylene blue solution and oil immersion. Meanwhile, the tools used were microscope slide, spirit lamp, sterile inoculating loop, staining rack and microscope. The tools used for anthropomet-ric measurements were questionnaires, weight scales and height measurement tools.
Data on sputum’s ARB status were oba-ined at Puskesmas where subjects were asked to bring their collected morning sputum, the sputum
at the time the patients were in Puskesmas was also collected for analysis. Bacteriological col-lection and analysis of ARB were conducted by Puskesmas officers. Body height data were ob-tained by measuring height of the Tb subjects at the beginning of the study using SH-2A height measurement tool, and it was performed by the Puskesmas officers. BW data were obtained by weighing the subjects using Camry EB9005 step-on scale in their respective homes, which was performed by the research assistant. BMI data were obtained by dividing the BW (kg) with the square of height (m2).
Data analysis
Sputum’s ARB status data was processed and presented descriptively. Kruskal-Wallis test was used to analyze mean values of BW and BMI, while Mann-Whitney advanced test with significance level of 0.05 and 0.1 was used to analyze the significance of the difference in mean BW and BMI between treatments.
RESULTS AND DISCUSSION Subjects’ characteristics
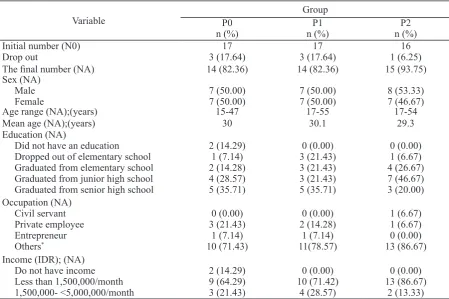
The important characteristics of subjects that affected the response were sex and age. Therefore, this study used permuted block ran-domization to ensure that each group received equal distribution of sex and age resulted in distri-bution of sex (male-female) between the groups; i.e. 50.00%:50.00% in P0 group, 50.00%:50.00% in P1 group and 53.33%:46.67% in P2 group. Meanwhile, in terms of age, the mean age ob-tained were 30 years in P0 group, 30.1 years in P1 group and 29.3 years in P2 group. Thus, sex and age characteristics between groups were rela-tively equal, thereby the response that emerged was the result of the provison of intervention. Detailed subjects’ characteristics are presented in Table 2.
The rate of sputum’s ARB conversion pro-cess in each group was different. In P0 group, the conversion of sputum’s ARB started to occur in the 6th week on one subject (7.1%). The next
conversion in sputum’s ARB occurred at weeks 7, 8, 12 and 24 with conversion accumulation of 28.6%, 64.3%, 92.9% and 100%, respectively. Conversion in sputum’s ARB in P1 began to oc-cur in the 6th week on one subject (7.1%). The
subsequent conversion in sputum’s ARB occurred at weeks 7, 8 and 12 with conversion accumula-tion of 35.7%, 78.6% and 100%, respectively. In
P2 group, sputum’s ARB conversion began to oc-cur in the 3rd week on four subjects (26.7%). The
next conversion happened at weeks 4, 5, 7 and 12 with conversion accumulation of 66.7%, 86.7%, 93.3% and 100%, respectively.
There were differences in conversion rate of sputum’s ARB in the three groups; i.e. the sputum smear conversion in P2 group occurred earlier than the other groups. In the 3rd and 7th
weeks, conversion of sputum’s ARB in P2 group had reached 93.3%. In the same week (the 7th
week), the sputum’s ARB conversion in P0 and P1 groups only reached 28.6% and 35.7% con-version, respectively. Furthermore, when the data was compared to the composition of baseline sputum’s ARB status, the P2 group was in fact more severe than other groups.
Based on mean conversion time the heal-ing of P2 group was the fastest, which was five weeks faster than P0 group and three weeks fast-er than P1 group. Thfast-erefore, the ordfast-er of healing process was P2>P2>P0. The differences in heal-ing rates between groups are presented in Figure 2.
Table 2. Subjects’ characteristics of the randomization results
Variable
Group
P0 P1 P2
n (%) n (%) n (%)
Initial number (N0) 17 17 16
Drop out 3 (17.64) 3 (17.64) 1 (6.25)
The final number (NA) 14 (82.36) 14 (82.36) 15 (93.75)
Sex (NA)
Age range (NA);(years) 15-47 17-55 17-54
Mean age (NA);(years) 30 30.1 29.3
Education (NA)
Did not have an education Dropped out of elementary school Graduated from elementary school Graduated from junior high school 1,500,000- <5,000,000/month
2 (14.29)
Description: *Others=other categories such as casual agricultural laborer, construction worker, etc. P0: ATDs + placebo lis group, P1: ATDs + 6% propolis group, and P2: ATDs + 30% propolis group. All dropped-out (DO) subjects were found in the first two weeks of intervention because the subjects were known not to take the drugs in one day, except one subject in P0 group who resigned and one subject in P1 group who was later defined as not Tb patient by the doctor.
mycobacterial ability. Cantrell et al. (2001) have mentioned that compounds of diterpene, triter-pene and sesquitertriter-pene classes have anti-myco-bacterial activity, even some of their derivatives show anti-tuberculin activity almost similar to ATDs. The compounds are found in propolis. To-reti et al. (2013) have reviewed the compounds contained in the propolis that act as antibacterial and antibiotic; i.e. flavanones, flavones, phenolic acids and esters, prenylated p-coumaric, labdane diterpenes, prenylated flavanones, and prenylat-ed benzophenones. The study results of Katerere et al. (2012) have revealed that pinocembrin has anti-mycobacterial activity, and the activity of this compound is increased when coupled with other phytochemicals.
Body weight (BW)
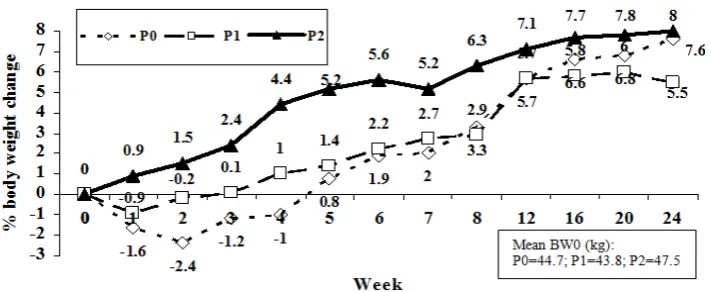
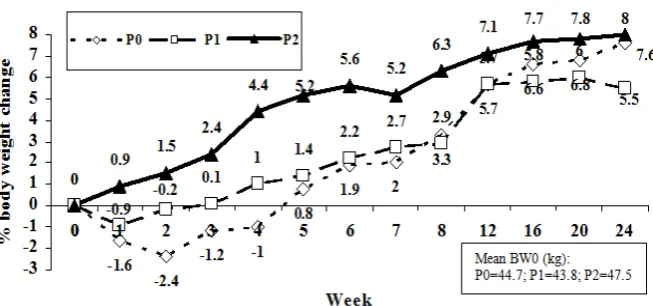
Body weight is a standard measure of nu-tritional status and is sensitive to sudden changes such as infection and food consumption (Gersh-win et al. 2004). The patterns of BW changes in P0 and P1 groups had similarities, whereas the pattern of BW change in P2 group was different. The percentages of mean BW changes are pre-sented in Figure 3.
There was a decrease in BW of the sub-jects in P0 group until the 4th week. Their weight
began to recover (equal or higher than baseline BW) in the 5th week, with an increase of 0.8%.
Decreased BW was thought to be caused by hepatotoxic effects of ATDs (i.e. nausea, dizzi-ness and decreased appetite), thus the food in-take was lower than normal. The data on differ-ences in food intakes between P0 group (ATDs + placebo propolis) and P2 group (ATDs + 30% propolis) in this study have been reported by Pranajaya (2017) as presented in Table 3. These data showed that nutritional adequacy level of P2 group was higher than P0 group.
A faster recovery will give significant ben -efits to the subjects; i.e. nutrient intakes will be fully utilized to restore nutritional status, health and productivity maintenance, and can be used for growth for the subjects who are still in the growth period. Nutrient intakes of the subjects that had not cured were partially mobilized to fight infection. It was seen in the P2 group that directly experienced BW and BMI improvements since the first week. P1 group took three and four weeks to restore BW and BMI. P0 group took five weeks to restore BW and had not been able to restore the BMI until the end of the intervention.
Based on the above sputum smear bacte-riological conversion data, propolis has shown good ability to fight M. tuberculosis infection. This result is in agreement with the study results of Syamsudin et al. (2008) and Pranandaru et al. (2011). The result also strengthens the study re-sults of Scazzocchio et al. (2006), Scheller et al. (1999), and Krol et al. (1993) who have suggest-ed that propolis synergizes with ATDs in fighting M. tuberculosis infection. The ability of propolis to fight M. tuberculosis is influenced by the active components in it, which is known to have
anti-Figure 3. Percentage of mean body weight changes of the subjects in P0, P1 and P2 groups during intervention
Table 3. Mean nutritional adequacy level of the subjects (pulmonary Tb patients) receiving propolis supplementation and placebo before and after the intervention
Before intervention
After
intervention Mean change
Placebo group
Energy Protein Fat
Carbohydrates
56.6 ± 17.7a 34.4 ± 15.6a 48.8 ± 23.6a 66.0 ± 24.4a
62.3 ± 13.7a 40.9 ± 16.1a 57.9 ± 22.7a 66.5 ± 14.3a
5.7 ± 13.61 6.5 ± 14.91 9.1 ± 27.81 0.6 ± 21.81
Treatment groups
Energy Protein Fat
Carbohydrates
52.3 ± 21.8a 31.1 ± 15.6a 48.7 ± 27.7a 59.1 ± 25.3a
65.1 ± 16.1b 48.8 ± 12.0b 61.6 ± 28.1a 68.1 ± 17.9b
12.8 ± 20.71 17.8 ± 13.21 12.9 ± 29.41 9.0 ± 27.21
Description: 1Different figures in the same column indicate significant differences between groups (p<0.05); adifferent letters in the same row show significant differences between time (p<0.05).
The subjects in the P1 group lost weight during the first two weeks. Their weight began to recover in the 3rd week with an increase of 0.1%.
If compared with the changes in BW of P0 group, the BW of P1 group recovered two weeks earlier. It was allegedly due to the effect of hepatoprotec-tive activity of propolis so that the hepatotoxic ef-fects of ATDs decreased which leaded to appetite recovery, thereby the BW recovered faster.
In contrast to the other groups, the P2 group did not experience weight loss and immediately gained weight from the start of intervention. The BW continued to increase until the end of
inter-vention. The increase in BW was proposed as the cause of propolis supplementation with a dose of 30% that effectively reduced the hepatotoxic effects of ATDs. The BW changes shown by all groups proved that 30% propolis supplementa-tion was able to reduce the hepatotoxic effects of standard-dose ATDs. The differences in BW changes were particularly prominent, observed from the 2nd week to the 6th week of intervention.
Statistically, BW changes in the 2nd week were
significantly different (p<0.05) (Table 4).
Based on the observation on weight chang-es, there was a strong indication that intensive
Response
Model test
(Kruskal-Wallis) Mann-Whitney advanced test
p Treatment p Description
BWW1-BW0 difference
0.028* P0-P1 0.454 Not significantly different P0-P2 0.158 Not significantly different
P1-P2 0.029 Significantly different at 5% level
BWW2-BW0 difference
0.006* P0-P1 0.635 Not significantly different P0-P2 0.002 Significantly different at 5% level P1-P2 0.023 Significantly different at 5% level
BWW6-BW0 difference
0.000* P0-P1 0.062 Significantly different at 10% level P0-P2 0.000 Significantly different at 5% level P1-P2 0.000 Significantly different at 5% level
BWW8-BW0 difference
0.000* P0-P1 0.104 Not significantly different P0-P2 0.000 Significantly different at 5% level
P1-P2 0.000 Significantly different at 5% level
BWW24-BW0
0.229 P0-P1 0.804 Not significantly different P0-P2 0.186 Not significantly different
P1-P2 0.134 Not significantly different
*Significantly different at 5% level.
use of ATDs caused a decrease in BW through the hepatotoxic mechanism. Hepatotoxic effects includes decreased in appetite, nausea and diz-ziness (Sari et al. 2014), thus the food intake de-creased drastically that led to weight loss. The weight recovery was noticeable after entering continuation treatment period (the 9th week until
the 24th week), either in the group not receiving
propolis supplementation (P0) or the groups re-ceiving propolis supplementation (P1 and P2). It indicated that the subjects could recover from the toxic effects of ATDs. Statistically, the mean BW in all groups at the end of intervention were not significantly different.
Propolis supplementation in this study pro-vided additional benefit of liver protection from the toxic effects of ATDs, especially in the first two weeks of intensive treatment phase. Liver protection by the propolis was ultimately useful to accelerate the BW recovery of the subjects. The results of this study strengthened the study results of Bhadauria et al. (2007), Hasmi et al. (2013) and Cevik et al. (2012) who stated that propolis was hepatoprotective. It was also seen that the higher the dosage of propolis supplemen-tation, the faster and higher the BW recovery is. In this study, the BW recovery of the patients in P2, P1 and P0 groups occurred at weeks 1, 3, and 5, respectively.
Body mass index (BMI)
BMI is one of the adult nutritional status indicators. Based on the changes in mean differ-ence of BMI, P0 group experidiffer-enced a decrease in BMI since the beginning of intervention and had not recovered until the end of intervention (24 weeks). The final BMI remained negative (-0.2).
The decrease in BMI was very drastic during the 1st and 2nd weeks (W1 and W2) and it continued
until the 8th week (W8). In continuation treatment
period (from the 9th week to the end of
interven-tion), BMI had increased slowly. These data in-dicated that intensive provision of ATDs could suppress the nutritional status of the subjects as a result of its hepatotoxic effects. The changes in mean BMI are presented in Figure 4.
In the continuation treatment phase (ATDs administered only 3 times a week), the strength of pressure on nutritional status was also reduced. In the P1 group, the decrease in BMI occurred during the first three weeks and started to be posi -tive in the 4th week (0.1). In the 24th week, BMI
increased by 0.9. When compared to P0 group, the decrease in nutritional status in P1 group was smaller, and it occurred in shorter duration. It means that supplementation of 20 drops of 6% propolis in ATDs provide benefits for nutritional status recovery of the subjects.
Unlike the other groups, the P2 group im-mediately experienced an increase in BMI from the beginning of intervention and it continued to increase until the end of intervention. In the first week, the BMI increased by 0.2. BMI continued to increase until the 8th week (W8) and the
in-crease reached 1.2. Therefore, the BMI inin-creased by 1.2 during the intensive treatment period. The final BMI (W24) reached 1.5. Thus, it could be said that the BMI increased only by 0.3 during the four months of continuation treatment peri-od. These data showed that P2 group had a rap-id increase in nutritional status in the intensive period. It showed a strong indication that daily supplementation using 20 drops of 30% propolis in ATDs could accelerate the nutritional status re-covery of the subjects.
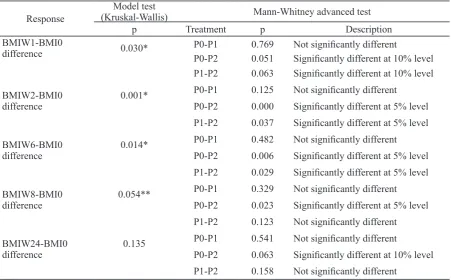
The statistical evidence of benefit from propolis supplementation to restore BMI was also reinforced by Kruskal-Wallis test and Mann-Whitney advanced test, which showed that the changes in BMI in P2 and P0 groups were sig-nificantly different from the first week until the 24th week (p<0.05 and p<0.1) (Table 5).
Observation on the pattern of BMI chang-es showed that the BMI recovery of P1 and P2 groups occurred at week 4 and week 1, respec-tively. Meanwhile, BMI of the P0 group had not recovered until the 24th week. It was also seen that
intensive use of ATDs might cause a decrease in nutritional status (as shown from the decreased in BMI of P0 and P1 groups within the intensive treatment period). Conversely, the supplementa-tion of 20 drops of 30% propolis alongside the ATDs could reduce the effect of decreased nu-tritional status due to ATDs consumption. More-over, it also could improve nutritional status of the subjects.
In line with the results of this study, Shetty (2010) stated that there was an interaction be-tween undernutrition and infection. The BMI data above showed that M. tuberculosis infec-tion might decrease the nutriinfec-tional status of the subjects through certain mechanism. The results of this study were also in agreement with the
re-search results of Moses et al. (2009); Tungdim and Kapoor (2008); Lombardo (2012); Patra et al. (2010), Sultan et al. (2012), and Chung-Del-gado et al. (2014), who found that Tb patients significantly had lower nutritional status com -pared to the healthy population.
CONCLUSION
Based on the sputum smear ARB conver-sion, the propolis supplementation groups (P1 and P2) recovered faster than the placebo propo-lis supplementation group (P0). Higher concen-tration of propolis lead to faster sputum’s conver-sion. Similarly with the changes in mean BW, in which higher concentration of propolis supple-ment result in faster BW recovery. Furthermore, BW of P2 group had increased immediately from the beginning. Thus, supplementation of 20 drops of propolis with a concentration of 30% along with ATDs during the treatment are effective to accelerate the cure and BW recovery processes of pulmonary Tb patients. Considering that propolis is clinically proven to be able to accelerate cure and BW recovery of pulmonary Tb patients, it has a potential to be used as a supplement for na-tional Tb control.
Table 5. Kruskal-Wallis test and Mann-Whitney advanced test on the difference in mean BMI of the subjects at weeks 1, 2, 6, 8 and at the 6th month
Response
Model test
(Kruskal-Wallis) Mann-Whitney advanced test
p Treatment p Description
BMIW1-BMI0
difference 0.030* P0-P1 0.769 Not significantly different
P0-P2 0.051 Significantly different at 10% level P1-P2 0.063 Significantly different at 10% level
BMIW2-BMI0 difference
0.001* P0-P1 0.125 Not significantly different P0-P2 0.000 Significantly different at 5% level
P1-P2 0.037 Significantly different at 5% level
BMIW6-BMI0 difference
0.014* P0-P1 0.482 Not significantly different P0-P2 0.006 Significantly different at 5% level
P1-P2 0.029 Significantly different at 5% level
BMIW8-BMI0 difference
0.054** P0-P1 0.329 Not significantly different P0-P2 0.023 Significantly different at 5% level
P1-P2 0.123 Not significantly different
BMIW24-BMI0 difference
0.135 P0-P1 0.541 Not significantly different
P0-P2 0.063 Significantly different at 10% level
P1-P2 0.158 Not significantly different
ACKNOWLEDGEMENTS
We would like to thank the Directorate General of Research and Development Rein-forcement - Ministry of Research, Technology and Higher Education for the research funding through the International Research Collabora-tion and Scientific PublicaCollabora-tion scheme Number: 079/SP2H/LT/DRPM/II/2016 dated 17 February 2016. We also would like to express our grati-tude to Health Office of Bogor City, especially dr. Eddy Darma, MKKK, dr. Siti Robiah Mubarokah and Mr. Budi Wibowo, Amd, Kep and all Puske-mas’s Tb program officers in Bogor City for the support of this research integration in Tb preven-tion in Bogor City.
REFERENCES
Bhadauria M, Nirala SK, Shukla S. 2007. Dura-tion-dependent hepatoprotective effects of propolis extract against carbon tetrachlo-ride-induced acute liver damage in rats. Adv Ther 24:1136-1145.
Cantrell CL, Franzblau SG, Fischer NH. 2001. Antimycobacterial plant terpenoids. Planta Med. 67:685-694.
Cevik MU, Acar A, Tanriverdi H, Varol S, Arik-anoglu A, Yucel Y, Akil E, Yunce M, Ek-inci A. 2012. Toxic Effects of Isoniazid and Rifampicin on Rat Brain Tissue: The Preventive Role of Caffeic Acid Phenethyl Ester. Int J Pharmacol 8:555-560.
Chow SC, Liu JP. 2004. Design and Analysis of Clinical Trials : Concepts and Methodolo-gies. 2nd ed. John Wiley & Sons, Inc. New Jersey : Hoboken.
Chowdhury A, Santra A, Bhattacharjee K, Ghatak S, Saha DR, Dhali GK. 2006. Mitochon-drial oxidative stress and permeability transition in Isoniazid and Rifampicin in-duced liver injury in mice. J. Hepatol. 45, 117-126. doi:10.1016/j.jhep.2006.01.027 Chung-Delgado K, Revilla-Montag A,
Guillén-Bravo S, Bernabe-Ortiz A. 2014. Weight variation over time and its relevance among multidrug-resistant tuberculosis patients. Int. J. Infect. Dis. 23, 20–24. doi:10.1016/j.ijid.2014.01.001
[Depkes] Departemen Kesehatan. 2009. Profil Kesehatan Indonesia 2008. Departemen Kesehatan Republik Indonesia, Jakarta. Gershwin ME, Nestel P, Keen CL. 2004.
Hand-book of Nutrition and Immunity. Humana Press Inc. Totowa, New Jersey.
Halim E, Hardinsyah, Sutandyo N, Sulaeman A, Artika M, Harahap Y. 2012. Kajian Bio-aktif dan Zat Gizi Propolis Indonesia dan Brasil. J Gizi Pangan 7(1):1-6.
Hashmi N, Muhammad F, Javed I, Khan JA, Khan MZ, Khaliq T, Aslam B. 2013. Nephro-protective effects of Ficus religiosa linn (peepal plant) stem bark against isoniazid and rifampicin induced nephrotoxicity in albino rabbits. Pak Vet J 33:330-334. Katerere DR, Gray AI, Nash RJ, Waigh RD.
2012. Phytochemical and Antimicrobial Investigations of Stilbenoids and Flavo-noids Isolated from Three Species of Com-bretaceae.Fitoterapia 83 (2012) 932–940 [Kemenkes] Kementerian Kesehatan Republik
Indonesia. 2009. Keputusan Menteri Ke-sehatan Republik Indonesia Nomor 364/ Menkes/Sk/V/2009 Tentang Pedoman Penanggulangan Tuberkulosis (Tb).
[Kemenkes] Kementerian Kesehatan Republik Indonesia. 2014. Pedoman Nasional Pen-gendalian Tuberkulosis. Kementerian Ke-sehatan Republik Indonesia. Direktorat Jenderal Pengendalian Penyakit dan Pe-nyehatan Lingkungan.
Krol W, Scheller S, Shani J, Pietsz G, Czuba Z. 1993. Synergistic Effect of Ethanolic Ex-tract of Propolis and Antibiotics on The Growth of Staphylococcus aureus. Arz-neimittelforschung. 43(5):607-9.
Lombardo CC. 2012. The nutritional status of patients with tuberculosis in comparison with tuberculosis-free contacts in Delft, Western Cape. South Afr J Clin Nutr 25: 180-185.
Moses AO, Emmanuel OO, Ganiyu AO, Fidelis AA, Dickson AO. 2009. Assessment of an-tioxidants and nutritional status of pulmo-nary tuberculosis patients in Nigeria. Eur J Gen Med 5(4):208-211
Patra SK, Jain A, Sherwal BL, Khanna A. 2010. Nutritional Status in Multi Drug Resis-tance-Pulmonary Tuberculosis Patients . Int. J. Pharma and Bio Sciences V 1(2). Pranandaru HA, Sembodo J, Choirina, Wijaya
FK, Sewaka SW. 2011. Propolis Sebagai Suplemen Bagi Penderita Tuberkulosis Dewasa. PKM Penelitian. Dikti Kemen-dikbud.
dan Pengemb Kesehat 24:28-35.
Scazzocchio F, D’Auria FD, Alessandrini D, Pantanella F. 2006. Multifactorial Aspects of Antimicrobial of Propolis. Microbiolog-ical Research 161(4):327-333.
Scheller S, Dworniczak S, Waldemar-Klimmek K, Rajca M, Tomczyk A, Shani J. 1999. Synergism between ethanolic extract of propolis (EEP) and anti-tuberculosis drugs on growth of mycobacteria. Naturforsch C 54(7-8):549-53.
Semba RD, Bloem MW. 2001. Nutrition and Health in Developing Countries. New Jer-sey: Humana Press.
Shetty P. 2010. Nutrition, Immunity and Infec-tion. CABI Head Office Nosworthy Way 875.
Sudarsanam TD, Tharyan P. 2014. Rifampicin compared to isoniazid for preventing active Tb in HIV-negative people at risk of devel-oping active Tb: Implications for public health. Clin. Epidemiol. Glob. Health 2, 28–36. doi:10.1016/j.cegh.2013.11.003 Sultan KM, Alobaidy MW, Al-Jubouri AM,
Nas-er AA, Al-Sabah HA. 2012. Assessment of body mass index and nutritional status in pulmonary tuberculosis patients. J Fac Med Baghdad 54:204-208.
Syamsudin, Dewi RM, Kusmardi. 2008.
Immu-nomodulatory and in vivo Antiplasmo-dial Activities of Propolis Extracts. Global Journal of Pharmacology 2(3):37-40. Toreti VC, Sato HH, Pastore GM, Park YK.
2013. Recent Progress of Propolis for Its Biological and Chemical Compositions and Its Botanical Origin. Hindawi Publish-ing Corporation, Evidence-Based Comple-mentary and Alternative Medicine. Vol-ume 2013, Article ID 697390, 13 pages. Tungdim MG, Kapoor S. 2008. Tuberculosis
treatment and nutritional status among the tribals of Northeast India. Acta Biol. Sze-ged 52:323-327.
Wahyunitisari MR, Mertaniasih NM, Rach-mawati D. 2006. Antimicrobial activities of andrographolide and propolis against intracellular Mycobacterium tuberculosis phagocytosed by monocytes derived mac-rophages. Folia Medica Indones 42:22-27. [WHO] World Health Organization, 2016.
Glo-bal Tuberculosis Report 2016. World Health Organization, Geneva, Switzerland. [WHO] World Health Organization, 2013.