*Corresponding author:
E-mail: [email protected]
Strengthening No: 36b/E/KPT/2016 Available online at http://medpet.journal.ipb.ac.id/
Changes in
in Vitro
Methane Production and Fatty Acid Profiles in Response to
Cakalang
Fish Oil Supplementation
E. H. B. Sondakh*, M. R. Waani, & J. A. D. Kalele Faculty of Animal Science, Sam Ratulangi University
Manado, North Sulawesi, Indonesia (95115)
(Received 08-10-2017; Reviewed 20-11-2017; Accepted 14-12-2017)
ABSTRACT
This experiment was conducted to determine the effect of cakalang fish oil addition in ruminant
feed on in vitro methane production and fatty acid profiles. This experiment consisted of four treat -ments which were R0 : feed composing of forage and concentrate at a ratio of 60% : 40% without
cakalang fish oil (CFO) addition as control feed; R1: R0 added with CFO at 2.5%; R2: R0 added with
CFO at 5%, and R3: R0 added with CFO at 7.5%. Fermentation with rumen fluid was done using the Hohenheim Gas Test (HGT); feeds were incubated at 39 oC for 72 hours. At the end of fermenta -tion, samples were obtained and methane production and fatty acid profiles were determined. The experiment was conducted in completely randomised design with four replications. Data were anal -ysed using analysis of variance and differences among treatment means were anal-ysed using Duncan multiple range test. Results showed that CFO supplementation affected (P<0.05) methane production, protozoa numbers and NH3 concentration; whereas the other parameters, i.e. VFA concentration, pH, and microbial protein were not affected. Some fatty acid profiles were influenced by treatments, such as palmitic, stearic, oleic, linoleic, and linolenic (P<0.05), while others, i.e. lauric and miristic were not affected. It is concluded that the best level of CFO supplementation is 5% as this level reduces methane production and increases unsaturated fatty acids without any negative effects on other vari -ables measured.
Keywords: cakalang fish oil, fatty acids, in vitro fermentation, methane, gas test
ABSTRAK
Penelitian ini dilaksanakan untuk menguji pengaruh suplementasi minyak ikan cakalang ke dalam ransum ternak ruminansia terhadap produksi gas metan dan profil asam lemak in vitro. Perlakuan terdiri atas empat perlakuan ransum, yaitu R0: ransum yang terdiri atas hijauan dan kon -sentrat dengan rasio 60% : 40% tanpa penambahan minyak ikan cakalang (MIC) sebagai ransum kon -trol; R1: R0 yang disuplementasi dengan 2,5% MIC; R2: R0 yang disuplementasi dengan 5% MIC; R3: R0 yang disuplementasi dengan 7,5% MIC. Fermentasi in vitro dilakukan dengan menggunakan tes
gas Hohenheim (TGH); ransum perlakuan difermentasi pada suhu 39 oC selama 72 jam. Pada waktu akhir fermentasi, dilakukan pengambilan sampel untuk pengukuran produksi gas metan dan profil asam lemak. Rancangan percobaan yang digunakan adalah rancangan acak lengkap dengan empat replikasi. Data dianalisis dengan analisis ragam, dan perbedaan di antara perlakuan diuji dengan uji jarak berganda Duncan. Hasil percobaan menunjukkan bahwa perlakuan mempengaruhi produksi gas metan, jumlah protozoa, dan konsentrasi NH₃ (P<0,05); sedangkan peubah lainnya, seperti kon -sentrasi VFA, pH, and sintesis protein mikrobia tidak memberikan pengaruh yang nyata. Beberapa profil asam lemak yang dipengaruhi oleh perlakuan adalah palmitat, stearat, oleat, linoleat, dan lino -lenat, serta konsentrasi SAFA dan UFA (P<0,05). Beberapa asam lemak lainnya, seperti asam laurat dan miristat, menunjukkan tidak berbeda nyata. Dapat disimpulkan bahwa taraf terbaik suplemen -tasi MIC adalah 5 % karena dapat menurunkan produksi gas metan dan meningkatkan asam lemak tak jenuh tanpa menyebabkan efek negatif pada variabel lainnya.
INTRODUCTION
Methane is gas compound produced as a result of feed fermentation by rumen microbes. Methane is produced by protozoa as one of microbes in the rumen (Dohme et al., 1999). Methanogenic bacteria are the oth -er rumen microbes producing methane and are found
to attach to ciliate protozoa to obtain a constant supply of hydrogen for producing methane (Kamra, 2005). In
their symbiosis, the protozoa released the hydrogen which were then transferred to the methanogenic bac-teria to produce methane. To reduce methane produc-tion needs to inhibit growth of protozoa (Machmuller,
2006; Bhatta et al., 2013; Sondakh et al., 2015). However,
several researchers indicated that reduction of methane production through protozoal defaunation caused some problems. This was because of the role of protozoa in
fibre fermentation and in maintaining rumen pH at the normal pH (Bhatta et al., 2013). In addition, protozoa
was capable of using fermentable carbohydrate to sustain its life, and the protozoa was able to slow down the conversion of fermentatble carbohydrate into lactic
acid by the bacteria; as a result, the rumen pH could be controlled or maintained at normal pH.
Methane formation in the rumen was influenced
not only by the methanogenic microbes, but also by the presence of hydrogen to react with carbon which was then oxidized to produce methane (Morgavi et al., 2010).
The hydrogen was also used by the propionic bacteria
producing propionate (Sondakh et al., 2015). These
resulted a competition between methanogenic bacteria and propionic bacteria in using the hydrogen; and this
was known as hydrogen - sink mechanism (HSM).
Competition for hydrogen use was not only for methane production in which methanogenic microbes competed with propionic bacteria, but also for
hydroge-nation of unsaturated fatty acid in the rumen. Rumen bacteria (lipolitic bacteria) in the rumen hydrolyzed fats yielding saturated and unsaturated fatty acids. The unsaturated fatty acids were then hydrogenated to C:18 saturated fatty acids. This hydrogenation process needs
hydrogen and enzymes. This situation caused competi-tions for hydrogen among the methanogenic microbes, propionate bacteria and the bacteria hydrogenating
un-saturated fatty acids. It is expected methane production can be reduced when cattle are fed with feed containing unsaturated fatty acids.
Cakalang fish oil containing fatty acid consists of capric acid 1.62%, oleic acid 3.15%, stearic acid 21.12%, palmitic acid 0.63%, elaidic acid 13.98%, palmitoleinic
acid 0.48%, linoleic acid 1.33%, arachidonic acid 24.78%,
and lignoceric acid 0.49%. Among these fatty acids, unsaturated fatty acid dominated content of fatty acid in fish oil for about 43.72%. Therefore, it can be probable
for hydrogenazing process by supplementation of
caka-lang fish oil. Therefore, the objective of this experiment
is to reduce methane production through hydrogenation process.
MATERIALS AND METHODS
Materials
Materials used in this experiment were ruminal
fluid, cakalang fish oil (CFO), feed consisting of forage
(napier grass) and concentrate (rice bran), and materials (solutions) for fermentation gas test, and analysis of gas production and fatty acid profiles. Ruminal fluid was
taken from the rumen of ruminant. The CFO was taken from the extraction of CFO industry. Feeds composing of napier grass and rice bran at a ratio of 60 : 40.
Treatments
Treatments applied in this experiment were R0: feed composing of forage and concentrate at a ratio of 60% : 40% with 0% CFO as control ration; R1: R0
supplemented with 2.5% CFO; R2: R0 supplemented with 5% CFO; and R3: R0 supplemented with 7.5% CFO. All treatments of CFO were in dry matter (DM) and
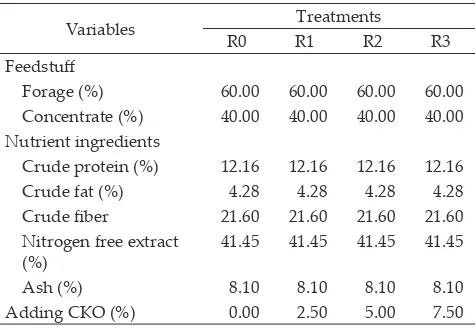
every treatments were conducted in four replications. Composition of experimental ration was listed in Table 1.
Procedure
Medium for fermentation was prepared by mixing 474.0 mL of distilled water, 0.12 mL of trace mineral, 237
mL of buffer, 1.22 mL of resazurin, and 49.5 mL of re -ducer solution. All the materials were homogenized and
flowed with CO2 to achieve anaerobic conditions. The
medium solution was then mixed with ruminal fluid at a ratio of 2 : 1 (v.v) (Menke & Steingass, 1988).
Each treatment feed (300 mg) was placed into a fer -mentation syringe which was subsequently added with
a mixture of rumen fluid and fermentation medium (30 mL). All syringes containing treatement feeds were incubated at 39 oC for 72 hours. At the end of
fermenta-tion time, the fluids were filtered to separate the fluids
Note: CFO: cakalang fish oil; R0: feed added with 0% CFO; R1: R0 add-ed with 2.5% CFO; R2: R0 addadd-ed with 5% CFO; and R3: R0 addadd-ed with 7.5% CFO; CFO in dry matter.
Variables Treatments
R0 R1 R2 R3
Feedstuff
Forage (%) 60.00 60.00 60.00 60.00
Concentrate (%) 40.00 40.00 40.00 40.00
Nutrient ingredients
Crude protein (%) 12.16 12.16 12.16 12.16
Crude fat (%) 4.28 4.28 4.28 4.28
Crude fiber 21.60 21.60 21.60 21.60
Nitrogen free extract
(%) 41.45 41.45 41.45 41.45
Ash (%) 8.10 8.10 8.10 8.10
Adding CKO (%) 0.00 2.50 5.00 7.50
from the solid matter. The fluids were then used for analysing methane gas production, pH, fatty acid pro
-file, and protozoal numbers.
Methane gas was measured with gas
chromatogra-phy (GC, Hitachi 263 - 50). Sample of fermentation fluid (1 mL) was injected into GC using a spoit. The GC was
conditioned as follows: 1 mm height of active carbon
column, 0.5 m diameter, 190 oC detector temperature,
190 oC injector temperature, 150 oC column temperature,
and 50 mL/min nitrogen gas. The methane gas produc -tion was measured using this formula: (area of standard
x area of sample)/area of standard (Lopez et al., 1996).
pH was measured using pH meter. Fatty acid profiles were analyzed with GC. Protozoal numbers
were counted using 1 mL of samples that were mixed
previously with formal ssaline solution (1 : 9 ratio).
Formal saline solution was prepared by mixing 0.8 mL
formaldehyde (37 % v.v) with 0.9 % (w/v) NaCl solution
up to 100 mL. Each sample was then put in a hemacy-tometer using a Pasteur pipet, and was placed under a
microscope with 40 x magnification (Diaz et al., 1993).
After taking the fluid samples for measuring meth
-ane production and fatty acid profiles, the samples were then centrifuged at 3,000 g for 15 minutes. Supernatants were used to determine VFA and NH3 concentrations.
The filtrates were then centrifuged at 10,000 g for 15 minutes; supernatants were discarded, and the filtrates
were used to measure microbial protein synthesised.
Concentration of NH3 was analysed using 0.5 mL of samples centrifuged at 3,000 g following Charney & Marbach (1962) method. That sample was centrifuged at
10,000 g for 10 min, then 20 µL supernatant was added
with 2.5 mL LC and 2.5 mL LD, and mixed homog -enously. That mixture was incubated in a waterbath at 40 oC for 30 minutes. After blue colour was formed, the
samples were taken to cool down in room temperature, then the absorbance of samples were measured using a
spectrophotometer at λ 630 nm. LC was a mixture of Na - nitroprusside (50 mg) and phenol crystal (10 g) added
with distilled water up to 1 L volume. LD was made up
with NaOH pellet (5 g) an), Na2HPO4 2H2O solution
(36.7125 g diluted in 100 mL of distilled water) and 25 mL of 5% sodium hypochloride, which was then mixed
homogenously and added with distilled water up to 1 L volume.
VFA concentrations were determined using GC
(Doreau et al., 1993). Samples previously prepared
by centrifuging at 3,000 g for 15 minutes were used as
much as 0.2 mL which were added with
metaphos-phoric acid (1 mL). After mixing homogenously, the
samples were centrifuged at 10,000 g for 10 minutes.
Supernatants were used as samples injected into GC
with 1 mL and was then read VFA after 6 minutes. Filtrates produced after centrifuging at 10,000 g were used for analysing microbial protein synthesis
measured with Lowry method (Plummer, 1987). Sample (0.5 mL) was put into a test tube which was then added with 2.5 mL of Lowry I solution and was kept at room
temperature for 10 minutes. This mixture was then
added with 0.25 mL of Lowry II solution. After keeping
the smaples at room temperature for 30 minutes, the sample absorbances were then read using
spectropho-tometer at λ 750 nm. Lowry I solution contained 2%
Na2CO3 in 0.1 N NaOH solution, 2% sodium tartrate, and 1% CuSO4.5H2O and was mixed in a ratio of 100 : 1 : 1. Lowry II solution composed of 1 N Folin mixed with distilled water at a ratio of 1 : 1.
Experimental Design, Variables Measured, and Data Analysis
The experiment was carried out in completely randomized design with four treatments as described above and four replications. Variables measured were
methane production, fatty acid profiles, pH, protozoal numbers, NH3 concentration, VFA concentration and
microbial protein synthesis. Analysis of variance
(ANOVA) was used for analyzing the data. Differences
among treatment means were examined with Duncan
multiple range test (Steel & Torrie, 1980).
RESULTS
Table 2 shows effects of treatments on methane
production, protozoal numbers, total and partial VFA
concentrations, NH3 concentration, microbial protein
synthesis and pH of rumen fluid. Treatments affected significantly protozoal numbers (P<0.05). Protozoal numbers reduced linearly from 0% to 2.5% and 2.5% to 5% and 7.5% CKO additions. There were no differences in protozoal numbers when CFO was added at 5% and 7.5%.
Methane productions was reduced significantly with the addition of CFO in feeds at different levels (P<0.05). Methane production was the highest in feed added with 0% CFO (P<0.05), but this did not differ from that of feed added with 2.5% CFO. Methane production then decreased significantly (P<0.05) at 5% and 7.5% CFO addition without any significant differ
-ences in methane production between 5% and 7.5% CFO
addition.
Small fluctuations were observed in acetic, pro -pionic, butyric, and total VFA concentrations when
feeds were added with 0%, 2.5%, 5%, and 7.5% CFO. However, differences among the levels of CFO additions were not statistically significant. These results did not cause any significant differences in acetate : propionate
ratios among the treatments.
NH3 concentrations were influenced by addition of CFO at different levels into feeds (P<0.05). The highest
NH3 concentration was produced by feed containing 0%
CFO, and the lowest NH3 concentration was yielded by
feed added with 7.5% CFO. NH3 concentrations did not
differ significantly when CFO was added at 0%, 2.5% and 5%, or when CFO was added at 2.5%, 5% and 7.5%.
There were no significant effects of adding CFO at 0%, 2.5%, 5%, and 7.5% into the feeds on microbial
protein synthesis. The same results were also observed
in rumen fluid pH.
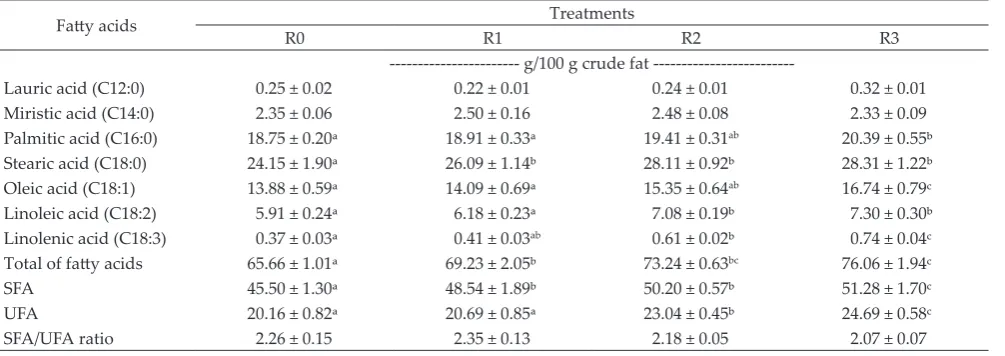
fatty acid productions (P<0.05) by increasing produc
-tions of palmitic (C16:0), stearic (C18:0), oleic (C18:1), linoleic (C18:2) and linolenic (C18:3) acids.
Production of palmitic acid (C16:0) were not dif
-ferent when feeds were added with 0%, 2.5%, and 5%.
This palmitate production then increased to the highest
level when 7.5% CFO was added into the feed (P<0.05); however, there were no significant differences in palmi
-tate productions between 5% and 7.5% CFO additions. The same effects of CFO addition at different levels as
those found in palmitic acid production were also
ob-served in oleic acid (C18:1) production.
Stearic acids (C18:0) were produced at the low -est level when feed was added with 0% CFO. Adding
CFO from 2.5% up to 7.5% in feed increased stearic acid productions (P<0.05), but the differences in stearic
acid productions among the three treatments were not
significant. The trends in stearic acid productions as
affected by CFO addition were also observed in linoleic acid (C18:2) productions.
Addition of CFO at different levels affected sig
-nificantly (P<0.05) linolenic acid (C18:3) production. The
lowest linolenic acid production was obtained when
CFO was added at 0%. Adding 2.5% CFO increased
linolenic acid production, but this increase was not dif-ferent from that of 0% CFO addition. A further increase in linolenic acid production was obtained by increasing
the CFO level to 5%, but there were no differences in linolenic acid production between CFO addition at 2.5% and at 5%, or between CFO addition at 5% and 7.5%. Differences in linolenic acid production were observed between CFO addition at 2.5% and that at 7.5% (P<0.05).
Addition of CFO from 0%, to 2.5%, 5%, and up to 7.5% affected total fatty acid production (P<0.05). The lowest production of total fatty acid was obtained from feed added with 0% CFO (P<0.05), this production Table 2. Methane production, protozoal numbers, total and partial VFA concentrations, NH3 concentration, microbial protein
synthe-sis, and rumen fluid pH treated with cakalang fish oil addition
Variables Treatments
R0 R1 R2 R3
Protozoal number (x 10³ mL) 23.57 ± 0.87c 21.57 ± 0.25ᵇ 18.77 ± 0.50ᵃ 18.67 ± 0.18ᵃ
Methane production (mL/g) 23.77 ± 0.75c 22.44 ± 0.27c 20.83± 0.78ab 20.37 ± 0.93ᵃ
VFA concentration (mMol)
Acetic acid 22.87 ± 0.31 23.24 ± 0.91 22.02 ± 0.67 23.19 ± 0.55
Propionic acid 7.93 ± 0.54 8.97 ± 0.54 8.51 ± 0.12 8.67 ± 0.09
Butyric acid 2.85 ± 0.18 3.02 ± 0.05 3.04 ± 0.17 3.18 ± 0.23
Total VFA 33.65 ± 0.71 35.23 ± 1.39 33.57 ± 0.91 35.04 ± 0.42
Acetate/propionate ratio 2.89 ± 0.18 2.59 ± 0.07 2.58 ± 0.05 2.67 ± 0.07
Microbial protein synthesis (mg/mL) 0.50 ± 0.08 0.48 ± 0.07 0.42 ± 0.03 0.41 ± 0.06 NH3 concentration (mg/100 mL) 15.19 ± 0.48ᵇ 14.08 ± 0.20ab 13.12 ± 0.42ab 12.40 ± 0.21ᵃ
Rumen fluid pH 6.28 ± 0.06 6.47 ± 0.17 6.49 ± 0.07 6.41 ± 0.15
Note: Means in the same row with different superscript differ significantly (P<0.05). R0: feed added with 0% CFO; R1: R0 added with 2.5% CFO; R2: R0 added with 5% CFO; and R3: R0 added with 7.5% CFO.
Table 3. Fatty acid profile as affected by cakalang fish oil addition at different levels
Fatty acids Treatments
R0 R1 R2 R3
--- g/100 g crude fat
---Lauric acid (C12:0) 0.25 ± 0.02 0.22 ± 0.01 0.24 ± 0.01 0.32 ± 0.01
Miristic acid (C14:0) 2.35 ± 0.06 2.50 ± 0.16 2.48 ± 0.08 2.33 ± 0.09
Palmitic acid (C16:0) 18.75 ± 0.20ᵃ 18.91 ± 0.33ᵃ 19.41 ± 0.31ab 20.39 ± 0.55ᵇ
Stearic acid (C18:0) 24.15 ± 1.90ᵃ 26.09 ± 1.14ᵇ 28.11 ± 0.92ᵇ 28.31 ± 1.22ᵇ
Oleic acid (C18:1) 13.88 ± 0.59ᵃ 14.09 ± 0.69ᵃ 15.35 ± 0.64ab 16.74 ± 0.79c
Linoleic acid (C18:2) 5.91 ± 0.24ᵃ 6.18 ± 0.23ᵃ 7.08 ± 0.19ᵇ 7.30 ± 0.30ᵇ
Linolenic acid (C18:3) 0.37 ± 0.03ᵃ 0.41 ± 0.03ab 0.61 ± 0.02ᵇ 0.74 ± 0.04c
Total of fatty acids 65.66 ± 1.01ᵃ 69.23 ± 2.05ᵇ 73.24 ± 0.63bc 76.06 ± 1.94c
SFA 45.50 ± 1.30ᵃ 48.54 ± 1.89ᵇ 50.20 ± 0.57ᵇ 51.28 ± 1.70c
UFA 20.16 ± 0.82ᵃ 20.69 ± 0.85ᵃ 23.04 ± 0.45ᵇ 24.69 ± 0.58c
SFA/UFA ratio 2.26 ± 0.15 2.35 ± 0.13 2.18 ± 0.05 2.07 ± 0.07
then increased when feed was added with 2.5% CFO (P<0.05). Further increases in total fatty acid production were obtained by adding 5% and 7.5% CFO, but there were no differences in total fatty acid production ob
-tained from 5% and from 7.5% CFO addition.
Saturated fatty acid (SFA) production was affected by adding CFO at different levels (P<0.05). Adding
0% CFO produced the lowest SFA. SFA production
in-creased with CFO addition levels, but differences in SFA production between 2.5% and 5%, or between 5% and 7.5% CFO additions were not significant.
Unsaturated fatty acid production (UFA) was also affected by addition of CFO at different levels (P<0.05).
The lowest UFA was produced when CFO was added at 0%, and the highest was obtained by adding CFO at
7.5%. Similar UFA productions were obtained between 2.5% and 5%, or between 5% and 7.5% CFO additions.
Although there were effects of CFO addition of
SFA and UFA productions. these did not cause any
significant differences in the ratio between SFA and UFA
among the levels of CFO addition.
DISCUSSION
Reduction in protozoal numbers by adding CFO at
different levels had been indicated in this experiment
meaning that supplementing with CFO as unsaturated
fatty acids from animal products had reduced the pro
-tozoal numbers, and this became another attempt of defaunation. The effects of CFO supplementation as unsaturated fatty acid source were similar to those obtained by Hristov et al. (2004) and Cieslak et al. (2006)
using unsaturated fatty acids from plant sources. Hristov et al. (2004) stated that the use of unsaturat
-ed fatty acid containing more double bonds was capable
of reducing protozoal numbers in the rumen. Those researchers also reported that supplementationwith
monounsaturated fatty acid (MUFA) such as oleic acid, and polyunsaturated fatty acid such as linoleic acid, had
reduced protozoal numbers, respectively, by 10.74% and
14.90%. In addition, Cieslak et al. (2006) showed that
protozoal numbers also reduced by 30.77% and 36.15%, respectively, by supplementing feed at a level of 7.5%
with rapeseed oil containing 62% oleic acid or linseed oil
containing 53% linolenic acid. Reductions in protozoal numbers were due to ability of unsaturated fatty acid
to inhibit protozoal growth (Gao et al., 2016), and the
unsaturated fatty acids containing C18 in high amount
could be toxic for protozoa in the rumen (Varadyova et
al., 2007). These reductions in protozoal numbers may
contribute to the reductions in methane productions. Reductions in methane productions was due to
the effects of CFO additions. This CFO contained high amounts of unsaturated fatty acids composing of oleic,
linoleic and linolenic acids having double bonds in its structures. These double bonds became the site for
hy-drogenation after lipids were hydrolyzed into fatty ac
-ids. Hydrogenation of double bonds in unsaturated fatty
acids produced hydrogens that were used for saturated
fatty acid formation. However, hydrogens were not only used for saturated fatty acid formation, but also for pro -ducing methane gas by methanogenic bacteria and for
propionate production by propionic bacteria (Sondakh
et al., 2015). This may cause a competition for hydrogen
utilization.
Additions of CFO at different levels as the source of unsaturated acids did not affect concentrations of total
and partial VFA. Ratios of acetate to propionate in this
study were in the range of 2.58–2.89 which were less than 3.125 for normal rumen condition as suggested by Hungate et al. (1975). Low ration in this study can
be due to the increase of propionic acid after adding of
feed substrate in CFO. The effect of unsaturated fatty
acid addition on total and partial VFA concentrations was not in an agreement with Sitoresmi et al. (2009) and
Harwanto et al. (2014). This was because addition of
unsaturated fatty acids, types, and substrate proportion affected total VFA concentrations. Other factors, such as
the ratio of napier grass and concentrate in 60% : 40%,
may also affect total and partial VFA concentrations.
Microbial protein synthesis in this study were in
the range of 0.41–0.50 mg/mL indicating no effects of
CFO addition on microbial protein synthesis. Those microbial protein synthesis were still higher than those
obtained by Sondakh et al. (2015) which were 0.24–0.27
mg/mL by supplementing with VCO (a medium-chain
fatty acid source) at 8%. Higher microbial protein synthesis (0.39–0.40 mg/mL) were obtained by using vegetable oil supplementation at 7.5% (Sitoresmi et al., 2009). The precursors needed for microbial protein
synthesis were carbon, NH3, and energy in sufficient amount (Orskov, 1992).
The NH3 concentration in this study were
12.40–15.19 mg/100 mL. Although, it was indicating that there was decrease of NH3 after adding CFO, the range
of NH3 in this study were still in normal range. This
agreed with Harfiah (2006) stating that normal activity of microbia needed ammonia concentration of 8.5 to 30 mg/100 mL. These NH3 concentrations were less than that obtained by Sitoresmi et al. (2009) which were in the
range of 33.24–34.53 mg/100 mL by supplementing with coconut oil, palm oil, and sunflower oil at 7.5%.
Addition of CFO at increasing levels could still
manage rumen fluid pH at its normal range. Owen & Zinn (1988) stated that normal rumen fluid pH was
5.5-7.6 for supporting normal activity of rumen micobes in degrading and fermenting the feeds. Sung et al. (2007)
stated that the range of normal pH to ruminal metabo
-lism were 6-7. This could relate to the pH for optimum enzyme activity in the rumen, such as 5.5–7.0 for pepti
-dase and 6.2–7.0 for cellulose, and other processes, such as VFA productions at 6.8–7.0 (Keidane & Birgele, 2003), and increase in unesterified fatty acids at 6.97 and 7.35 (Hristov et al., 2004).
In this study, the addition of 5% CFO has been able
to reduce methane production, whereas the number of
protozoa decreased at the addition of 7.5%. Highest de -crease in the number of protozoa will exacerbate rumen
metabolism process. It was also indicated by NH3
con-centration which was decreased at addition 7.5% CFO. Addition of 7.5 CFO indicated a bad condition due to low amount of NH3.
CFO addition, especially at the highest levels
were in relation to the contents and amounts of
unsatu-rated fatty acids that affected biohydrogenation in the
rumen. Wasowska et al. (2006) stated that the presence of
unsaturated fatty acids inhibited biohydrogenation.
CONCLUSION
The addition of CFO reduced protozoal numbers,
methane gas production, NH3 concentration and fatty acid profile without any effects on total and partial VFA
concentrations, microbial protein synthesis and rumen
fluid pH. The greater effects were produced by CFO addition at 7.5%, and the effects were similar to those obtained by CFO addition at 5%. Therefore, it is recom
-mended to use CFO at 5% as unsaturated fatty acid
source in feed composing of napier grass and concen-trate at 60% : 40% ratio.
ACKNOWLEDGEMENT
Directorate General of Higher Education, Ministry of Research and Higher Education, is acknowledged
for the funding support through the scheme of Fundamental Research 2017. Appreciation also present
to Ir. Anita S. Tjakradidjaja, M.Rur.Sc. for her contribu -tion on improving the language of this manuscript.
REFERENCES
Bhatta, R., M. Saravanan, L. Baruah, K.T. Sampath, & C.S. Prasad. 2013. Effect of plant secondary compounds on in
vitro methane, ammonia production and ruminal
proto-zoa population. J App. Microbiol. 115: 455-465.
Chaney, A.L., & E.P. Marbach. 1962. Modified reagents for de -termination of urea and ammonia. Clin. Chem. 8:130-132.
Cieslak, A., R. Miltko, G. Belzecki, & E. Kwiatkowska. 2006.
Effect of vegestable oils on the methane concentration and
population density of the rumen ciliate, Eremoplastron
di-lobum, grown in vitro. J. Anim. Feed Sci. 15: 15-18. https:// doi.org/10.22358/jafs/70132/2006
Diaz, A., M. Avendano, & A. Escobar. 1993. Evaluation of sap
-indus saponaria as a defaunating agent and its effects on different ruminal digestion parameters. Livest. Res. Rural Dev. 5: 1-6.
Dohme, F., A. Machmuller, B.L. Esterman, P. Pfister, A. Wasserfallen, & M. Kreuzer. 1999. The rule of the ru -men protozoa for methane suppression caused by
co-conut oil. Lett. App. Microbiol. 29:87-192. https://doi. org/10.1046/j.1365-2672.1999.00614.x
Doreau, M., B. Salem, & R. Krezminski. 1993. Effect of rapeseed
oil supply on in vitro ruminal digestion in cows: compari-son of hay and maize silage diets. Anim. Feed Sci. Technol.
44:181-189. https://doi.org/10.1016/0377-8401(93)90046-M Gao, J., M.Z. Wang, Y.J. Jing, X.Z. Sun, T.Y. Wu, & L.F. Shi.
2016. Impacts of the unsaturation degree of long-chain
fat-ty acids on the volatile fatfat-ty acid profiles of rumen micro -bial fermentation in goats in vitro. J Integrative Agric. 15:
2827–2833. https://doi.org/10.1016/S2095-3119(16)61418-1 Harfiah. 2006.Perbandingan daya cerna in vitro bahan kering
rumput gajah dan hasil fermentasi campuran rumput la -pangan dengan isi rumen. J. Sci. Ethiol. 6: 67-70
Harwanto., L.M. Yusiati, & R. Utomo. 2014. Pengaruh kayu manis (Cinnamomumburmanni Ness ex BI.) sebagai sumber sinamaldehid terhadap parameter fermentasi dan akti-vitas mikrobia rumen secara in vitro. Buletin Peternakan 38:71-77
Hristov, A.N., M. Ivan, & T. McAllister. 2004. In vitro effects on individual fatty acids on protozoal numbers and on fer
-mentation products in ruminal fluid from cattle fed a high concentrate, barley-based diet. J. Anim. Sci. 82:2693-2704. https://doi.org/10.2527/2004.8292693x
Hungate, R.E. 1975. The rumen microbial ecosystem. Anim. Rev. Ecology Systematics 6:39-66. https://doi.org/10.1146/ annurev.es.06.110175.000351
Kamra, D.N. 2005. Rumen microbial ecosystem. Special edition: Microbial Diversity. Current Sci. 89:124-135.
Keidane, D., & E. Birǵele. 2003. The efficacy of feed on the intra abomasal pH dynamics in goats. Veterinarija IR Zootechnica 22:58-61
Lopez, P., M.L. Kung Jr., & J.M. Odom. 1996. In vitro of mi
-crobial methane production by 9,10-anthraquinone. Anim.
Feed Sci. Technol 71: 117-130
Machmuller, A. 2006. Medium-chain fatty acids and their poten -sial to reduce methanogenesis in domestic ruminants. Agr. Ecosyst. Environ. 112:107-114. https://doi.org/10.1016/j.
agee.2005.08.010
McDonald, P., P.A. Edwards, & J.F.D. Greenhalg. 1988. Animal
Nutrition. 4th ed. Longman Sci. and Tech. New York. Menke, K.H., & H. Steingass. 1988. Estimation of energetic
feed value obtained from chemical analysis and in vitro
gas production using rumen fluid. Anim. Res. Develop. 28: 7-55
Morgavi, D.P., E. Forano, C. Martin, & C.J. Newbold. 2010. Microbial ecosystem and methanogenesis in
rumi-nants. Animal 4: 1024–1036. https://doi.org/10.1017/ S1751731110000546
Orskov, E.R. 1992. Protein Nutrition in Ruminant. Academic
Press Limited. London
Owen, F.N., & R. Zinn. 1988. Protein metabolism of Ruminant animals. In: D.C. 314 Church (Ed), The Ruminant animal Digestive physiology and Nutrition. Reston 315 Book Prentice Hall, Englewood Cliffs, New Jersey.
Plummer, D.T. 1987. An Introduction to Practical Biochemistry. 3rd ed. McGraw-Hill Book Company. London.
Sitoresmi, P.D., L.M. Yusiati, & H. Hartadi. 2009. Pengaruh penambahan minyak kelapa, minyak biji matahari, dan
minyak kelapa sawit terhadap penurunan produksi metan di dalam rumen secara invitro. Buletin Peternakan 33:
96-105. https://doi.org/10.21059/buletinpeternak.v33i2.122 Sondakh, E.H.B., L. M. Yusiati, H. Hartadi, & E. Suryanto.
2012. The effect of methanogenic inhibitor feed on propi -onic acid and lamb meat chemical quality. J. Indonesian Trop. Anim. Agric. 37: 183-188. https://doi.org/10.14710/
jitaa.37.3.183-188
Sondakh, E.H.B., J.A. Rorong, & J.A.D. Kalele. 2015. Methane
gas reduction using virgincoconut oil supplementation in rumen fermentation through in vitro. J. Anim. Prod. 17:144-148. https://doi.org/10.20884/1.anprod.2015.17.3.511
Steel, R.G.D., & J.H. Torrie. 1980. Principles and Procedures of Statistics. McGraw-Hill Book Co. Inc. New York.
Sung, H.G., Y. Kobayashi, J. Chang, A. Ha, I.H. Hwang, & J.K. Ha. 2007. Low ruminal pH reduces dietary fiber digestion via reduced microbial attachment. J. Anim. Sci. 20: 200-207. https://doi.org/10.5713/ajas.2007.200
Varadyova, Z., S. Kišidayova, P. Siroka, & D. Jalč. 2007. Fatty acid profiles of rumen fluid from sheep fed diets supple
-mented with various oils and effect on the rumen ciliate
population. Czech J. Anim. Sci. 52: 399–406.
Wasowska, I., M.R.G. Maia, K.M. Niedźwiedzka, M. Czauderna, J.M.C. Ramalho Ribeiro, & E. Devillard.