SIMILARITY BASED ENTROPY ON FEATURE SELECTION FOR HIGH DIMENSIONAL
DATA CLASSIFICATION
Jayanti Yusmah Sari, Mutmainnah Muchtar, Mohammad Zarkasi, dan Agus Zainal Arifin
Department of Informatics, Faculty of Information Technology, Institut Teknologi Sepuluh Nopember,
Jl. Teknik Kimia, Kampus ITS Sukolilo, Surabaya, 60111
E-mail: [email protected], [email protected]
Abstract
Curse of dimensionality is a major problem in most classification tasks. Feature transformation and feature selection as a feature reduction method can be applied to overcome this problem. Despite of its good performance, feature transformation is not easily interpretable because the physical meaning of the original features cannot be retrieved. On the other side, feature selection with its simple com-putational process is able to reduce unwanted features and visualize the data to facilitate data understanding. We propose a new feature selection method using similarity based entropy to over-come the high dimensional data problem. Using 6 datasets with high dimensional feature, we com-puted the similarity between feature vector and class vector. Then we find the maximum similarity that can be used for calculating the entropy values of each feature. The selected features are features that having higher entropy than mean entropy of overall features. The fuzzy k-NN classifier was im-plemented to evaluate the selected features. The experiment result shows that proposed method is able to deal with high dimensional data problem with mean accuracy of 80.5%.
Keywords: classification, entropy, feature selection, high dimensional data, similarity
Abstrak
Curse of dimensionality merupakan masalah yang sering dihadapi pada proses klasifikasi. Trans-formasi fitur dan seleksi fitur sebagai metode dalam reduksi fitur bisa diterapkan untuk mengatasi masalah ini. Terlepas dari performanya yang baik, transformasi fitur sulit untuk diinterpretasikan ka-rena ciri fisik dari fitur-fitur yang asli tidak dapat diperoleh kembali. Di sisi lain, seleksi fitur dengan proses komputasinya yang sederhana bisa mereduksi fitur-fitur yang tidak diperlukan dan mampu me-representasikan data untuk memudahkan pemahaman terhadap data. Pada penelitian ini diajukan metode seleksi fitur baru yang berdasarkan pada dua pendekatan filter, yaitu similarity (kemiripan) dan entropi untuk mengatasi masalah data berdimensi tinggi. Tahap awal metode ini adalah meng-hitung nilai similarity antara fitur dengan vektor kelas dari 6 data berdimensi tinggi. Kemudian diperoleh nilai similarity maksimum yang digunakan untuk menghitung nilai entropi untuk setiap fitur. Fitur yang dipilih adalah fitur yang memiliki nilai entropi lebih tinggi daripada entropi rata-rata seluruh fitur. Fuzzy k-NN diterapkan untuk tahap klasifikasi data hasil seleksi fitur. Hasil percobaan menunjukkan bahwa metode yang diajukan mampu mengklasifikasi data berdimensi tinggi dengan rata-rata akurasi 80.5%.
Kata Kunci: klasifikasi, entropi, seleksi fitur, data berdimensi tinggi, similarity
1.
Introduction
Curse of dimensionality
with regard to the
presen-ce of large number of features is widely known as
a major obstacle in classification task, because it
is practically impossible to adequately populate
the feature space with the available data.
Reduc-tion of feature dimensionality is considerably
im-portant to overcome this high dimensional data
problem. The purpose of dimensionality reduction
is to improve the classification performance
thro-ugh the removal of redundant or irrelevant
fea-tures. Dimensionality reduction can be achieved
in two different ways, which are feature
transfor-mation and feature selection. Feature
transforma-tion methods construct new features out of
ori-ginal variables and feature selection methods keep
only useful features and discard others.
Feature transformation aims to build a new
feature space of reduced dimensionality, produce
a compact representation of the information that
may be distributed across several of the original
features. Ravi et al
.
[1]
have developed an
appro-ach by using feature transformation method,
call-ed PCA-Ravi for deriving fuzzy rules to handle
high-dimensional classification problems.
gh it has shown promising results in many
appli-cations [2], feature transformation is not easily to
interpret because the physical meaning of the
ori-ginal features cannot be retrieved. On the other
side, feature selection, as a preprocessing step to
machine learning, is efective in reducing
dimensi-onality, removing irrelevant data, increasing
lear-ning accuracy, and improving result
comprehen-sibility [3].
Feature selection has important role in
clas-sification because it can simplify the model and
make the model more transparent and more
com-prehensiv. There are three types of feature
selec-tion approaches: embedded, filters, and wrappers
approaches. In embedded techniques, feature
sel-ection can be considered to be a part of the
lear-ning itself. By testing the values of certain
featu-res, algorithms split the training data into subsets.
Filter techniques are designed to filter out
unde-sirable features by checking data consistency and
eliminating features whose information content is
represented by others. The filter approach was
al-so usually performs al-some statistical analysis
with-out employing any learning model. Zhang et al.
[4] have developed Constraint Score method. This
is a filter method for feature selection with
pairwi-se constraints, which specifies whether a pair of
data samples belong to the same class (
must- link
constraints) or different classes (
cannot-link
cons-traint). Also, Luukka [5] has proposed a filter
te-chnique based on fuzzy entropy measures and
tes-ted it together with similarity classifier to do the
feature selection in high dimensional medical
da-tasets.
On the other hand, wrapper technique
invol-ves a learning model and uses its performance as
the evaluation criterion. A research in wrapper
te-chnique was conducted by Aydogan et al. [6]
whi-ch proposed a hybrid heuristic approawhi-ch (called
hGA) based on genetic algorithm (GA) and
inte-ger-programming formulation (IPF) to solve high
dimensional classification problems in linguistic
fuzzy rule-based classification systems. Tsakonas
[7] has designed a genetic programming
(GP)-based Fuzzy Rule Based Classification System as
a learning process, called GP-PITT-Tsakonas, to
generate complete fuzzy rule sets. Berlanga et al.
[8] have proposed a GP-COACH method, a
Gene-tic Programming-based method for the learning of
COmpact and ACcurate fuzzy rule-based
classify-cation systems for high-dimensional problems.
Although the wrapper approach is known to be
more accurate compared to the filter approach
[9,10]. But, it also tends to be more
computatio-nally expensive since the classifier must be
train-ed for each candidate subset and do not scale up
well to large, high-dimensional datasets.
In [5] all the features that having the higher
entropy than the mean entropy are removed, but
Jaganathan and Kuppuchamy [11] have stated that
features with highest entropy values were the
mo-st informative ones. In this paper, we propose a
new selection feature method based on two types
of filter techniques, which are similarity and
en-tropy measure. Our idea is to use the highest
si-milarity as membership value in entropy measure
and keep the features that have higher entropy
than the mean entropy. This idea is proposed to
overcome the complexity of learning algorithm
while still preserving the good accuracy of the
overall system, especially on high dimensional
data classification. For classification step, we
con-sidered the fuzzy
k
-NN [12] to be a suitable
clas-sifier since it does not need any learning
algo-rithm and the membership assignments to classify
samples tend to possess desirable qualities.
2.
Methods
Dataset
The datasets were downloaded from UCI Machine
Learning Repository [13]. The fundamental
pro-perties of the datasets are shown in Table 1.
Ecoli
Ecoli dataset was created by Kenta Nakai from
Osaka University. The dataset patterns were
char-acterized by attributes calculated from the amino
acid sequences. Each pattern has 7 attributes and
336 labeled examples.
Glass
The study of classification of types of glass was
motivated by criminological investigation. Glass
dataset was coming from USA Forensic Science
Service, which contains 9 types of glass, defined
in terms of their oxide content (Mg: Magnesium,
Al: Aluminum, 6. Si: Silicon, etc.).
Heart Disease
The heart disease dataset was coming from V.A.
Medical Center, Long Beach and Cleveland Clinic
TABLE 1
DATASETS AND THEIR PROPERTIES
Foundation. It composed of 297 measurements
and 9 attributes. There are no missing values. The
heart disease dataset includes 12 attributes and 2
classes.
Ionosphere
Ionosphere dataset was mostly used for
classify-cation of radar returns from the ionosphere. With
34 continuous attribute, this radar data was
collec-ted by a system in Goose Bay, Labrador.
"Good"
radar returns are those showing evidence of some
type of structure in the ionosphere.
"Bad"
returns
are those that do not; their signals pass through
the ionosphere.
Parkinsons
The dataset was created by Max Little from the
University of Oxford. Dataset is composed of a
range of biomedical voice measurements from
he-althy people and people with Parkinsons disease
(PD). Each column in the table is a particular
voi-ce measure, and each row corresponds one of 195
voice recording from people who participated in
collection of this data.
Wine
The dataset were the result of a chemical analysis
of wines grown in the same region in Italy but
derived from three different cultivars. The
analy-sis determined the quantities of 13 features found
in each of the three types of wines. All attributes
are continuous.
Data Preprocessing
All datasets have
t
number of different kinds of
features (feature vectors)
f
1, . . . ,
f
tand a label
class (class vectors)
v
i= (
v
i(
f
1), . . . ,
v
i(
f
t)). We
suppose that the values for the magnitude of each
attribute are normalized so that they can be
pre-sented as a value between 0 to 1. In order to attain
this task, we should convert class vectors into a
non-zero labeled class and normalize the feature
vectors. Once the class vectors
v
has been
conver-ted, we used similarity and entropy measure to
se-lect the most informative features.
Similarity Measure
Let sample data
x
= (
x
(
f
1), …,
x
(
f
t)),
x
∈
X,
f
∈
v
in
feature vector
v.
The decision to which class an
arbitrarily chosen
x
belongs is made by comparing
it to each class vector
v
. The comparison can be
done by using similarity as given by equation(1)
in the generalized Luka-siewicz structure [14]:
S(x,v) = (∑𝑡𝑡𝑟𝑟=1𝑤𝑤𝑟𝑟(1−|𝑥𝑥(𝑓𝑓𝑟𝑟)𝑝𝑝− 𝑣𝑣(𝑓𝑓𝑟𝑟)𝑝𝑝|))1/𝑝𝑝
(1)
for
x
,
v
∈
[0,1]. Here,
p
is a parameter coming
fr-om the generalized Łukasiewicz structure [15] (
p
in (0, infinity) as default p=1) and
w
ris a weight
parameter, which set to one. If the sample belongs
to class
i
, we get the similarity value between the
class vector and sample being S(
x
,
v
) = 1. If the
sample does not belong to this class in class
vec-tor, we got 0 from the similarity value. The
decisi-on to which class the sample beldecisi-ongs was made
according to which class vector the sample has the
highest similarity value [5]. The similarity value
is calculated using equation(2).
S
(
x
,
v
i) = max
𝑖𝑖=1…𝑁𝑁
𝑆𝑆
(
𝒙𝒙
,
𝒗𝒗
𝒊𝒊)
(2)
This highest similarity was used as membership of
x
,
µ
A(
x
j), for calculating its entropy.
Entropy Measure
We calculated the fuzzy entropy values for each
features by using similarity values between the
class vectors and feature vectors we want to
clas-sify. Entropy is a measure of the amount of
uncer-tainty in the outcome of a random experiment, or
equivalently, a measure of the information
obtain-ed when the outcome is observobtain-ed.
De Luca [16] suggested the formula to
mea-sure fuzzy entropy that corresponded to concept
of fuzzy sets and Shannon probabilistic entropy
[17] in the following equation(3)
H(A)
=
− ∑
𝑛𝑛𝑗𝑗=1(
µ
A(
x
j) log
µ
A(
x
j) + (1-
µ
A(
x
j))
log (1-
µ
A(
x
j))
(3)
where
H(A)
is the measure of fuzzy entropy and
µ
A(
x
j) is the maximum similarity from the
previ-ous step, similarity measure. This fuzzy entropy
measure was used to calculate the relevance of the
features in feature selection process.
Feature Selection
We used the maximum similarity value from
simi-larity measure as entropy value
µ
A(
x
j) of each
fea-ture. The highest fuzzy entropy value of the
featu-re is featu-regarded as the most informative one [14]. A
feature
f
∈
F
is selected if it satisfies the following
condition of Mean Selection (MS) Strategy as
sh-own by equation(4).
𝜎𝜎
(
𝑓𝑓
)
≥ ∑
𝜎𝜎(𝑓𝑓)|𝐹𝐹|
𝑓𝑓∈𝐹𝐹
(4)
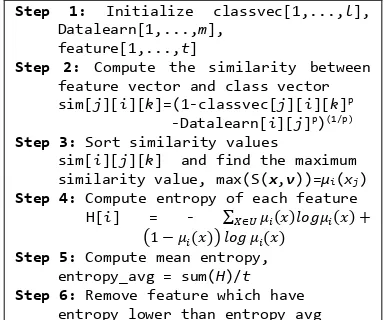
Step 1: Initialize classvec[1,...,l], Datalearn[1,...,m],
feature[1,...,t]
Step 2: Compute the similarity between feature vector and class vector sim[j][i][k]=(1-classvec[j][i][k]p
-Datalearn[i][j]p)(1/p) Step 3: Sort similarity values
sim[i][j][k] and find the maximum similarity value, max(S(x,v))=µi(xj) Step 4: Compute entropy of each feature H[i] = - ∑𝑋𝑋∈𝑈𝑈𝜇𝜇𝑖𝑖(𝑥𝑥)𝑙𝑙𝑙𝑙𝑙𝑙𝜇𝜇𝑖𝑖(𝑥𝑥) +
�1− 𝜇𝜇𝑖𝑖(𝑥𝑥)� 𝑙𝑙𝑙𝑙𝑙𝑙 𝜇𝜇𝑖𝑖(𝑥𝑥)
Step 5: Compute mean entropy, entropy_avg = sum(H)/t
Step 6: Remove feature which have entropy lower than entropy_avg
Figure 1. The algorithm of proposed feature selection method
Set k
{Calculating the NN}
for i = 1 to t
Calculate distance from x to mi if i<=k
then add mi to E
else if mi is closer to x than any
previous NN
then delete the farthest neighbor and include mi in the set E
Figure 2. Pseudo-code of fuzzy k-NN classifier.
High Dimensional Dataset
Data Preprocessing
Similarity Measure
Entropy Measure
Feature Selection
Fuzzy K-NN Classification
Figure 3. Proposed method’s scheme.
entropy relevance measure. Our proposed feature
selection method is presented in Figure 1.
In the algorithm, we have
m
samples,
t
featu-res and
l
classes. We measure the similarities
bet-ween feature vectors and class vectors using
equ-ation(1), and find the entropy value of each
fea-ture using equation(3). The mean entropy from all
of entropy values is then calculated. The feature
whose entropy value is lower than mean entropy
value is removed from the dataset while the
featu-re with higher entropy value is selected and used
for classification.
Fuzzy
k
-NN Classification
After selecting the best features
t
, we classify the
sample dataset
x
using fuzzy
k
-NN classifier. The
basic concept of this classifier is to assign
mem-bership as a function of the object’s distance from
its
k
-nearest neighbors and the memberships in the
possible class
l
. The pseudo-code of fuzzy
k
-NN
classifier is presented in Figure 2.
Consider
W
={
w
1,
w
2, ...,
w
m} a set of
m
la-beled data,
x
is the input for classification,
k
is the
number of closest neighbors of
x
and
E
is the set
of
k
nearest neighbors (NN). Let
µ
i(
x
) is the
mem-bership of
x
in the class
i
,
m
be the number of
ele-ments that identify the classes
l
, and
W
be the set
that contain the
m
elements. To calculate
µ
i(
x
), we
use equation(5) [12].
𝜇𝜇
𝑖𝑖(
𝑥𝑥
) =
∑ 𝜇𝜇𝑖𝑖𝑖𝑖� 1 �𝑥𝑥−𝑚𝑚𝑖𝑖�2/(𝑚𝑚−1)� 𝑘𝑘
𝑖𝑖=1
∑ � 1
�𝑥𝑥−𝑚𝑚𝑖𝑖�2/(𝑚𝑚−1)� 𝑘𝑘
𝑖𝑖=1
(5)
Since we use fuzzy
k
-NN method, each
ele-ment of
x
testing data is classified in more than
one class with membership value
µ
i(
x
). The
deci-sion to which class the elemen of
x
testing data
belongs is made according to which class the
ele-ment of
x
testing data has the highest membership
value
µ
i(
x
). Figure 3 shows the overall steps of
our proposed method.
3.
Results and Analysis
The experiment was conducted to prove that
fea-ture selection method using similarity and
entro-py, can be used to classify high dimensional data.
The performances of the proposed method were
evaluated using 10-fold cross validation. All
data-sets were split into 10 data subdata-sets. One subset
was used for testing and the other nine subsets
were used as sample. This procedure was repeated
10 times for all of datasets. The sample subset
was used to select feature based on similarity and
entropy value, while the testing subset is applied
to evaluate the feature selected that obtained by
the proposed method. The result of feature
selecti-on in Table 2 shows all the selected features from
six different datasets. The lowest proportion of
se-lected feature belongs to Ionosphere dataset and
the highest one belongs to E-coli dataset.
nu-TABLE 2 CLASSIFICATION RESULT
Dataset Nb.of k
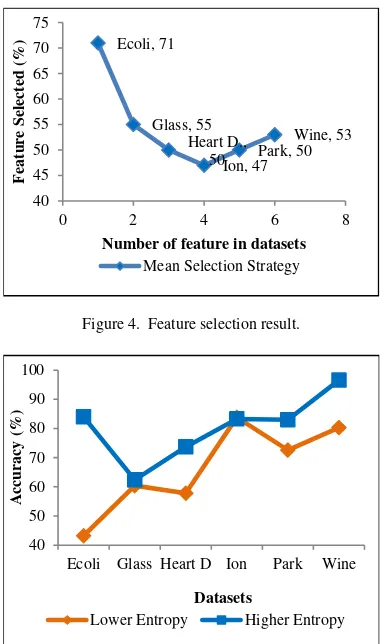
Figure 4. Feature selection result.
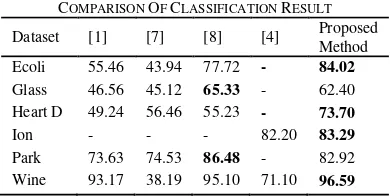
Figure 5. Comparison of accuracy. Ecoli, 71
Number of feature in datasets
Mean Selection Strategy
Ecoli Glass Heart D Ion Park Wine
Accura
mber of correctly classified data and misclassified
data. Accuracy is calculated using equation(6).
𝐴𝐴𝐴𝐴𝐴𝐴𝐴𝐴𝐴𝐴𝐴𝐴𝐴𝐴𝐴𝐴=𝑛𝑛 .𝑐𝑐𝑐𝑐𝑟𝑟𝑟𝑟𝑐𝑐𝑐𝑐𝑡𝑡𝑐𝑐𝑐𝑐𝑐𝑐𝑐𝑐𝑐𝑐𝑐𝑐𝑐𝑐𝑖𝑖𝑓𝑓𝑖𝑖𝑐𝑐𝑐𝑐𝑐𝑐𝑐𝑐𝑡𝑡𝑐𝑐
𝑛𝑛.𝑚𝑚𝑖𝑖𝑐𝑐𝑐𝑐𝑐𝑐𝑐𝑐𝑐𝑐𝑐𝑐𝑖𝑖𝑓𝑓𝑖𝑖𝑐𝑐𝑐𝑐𝑐𝑐𝑐𝑐𝑡𝑡𝑐𝑐 𝑥𝑥 100
% (6)
Since we use 10-fold cross-validation
proce-dure, the predictive accuracies on the testing set of
the 10 runs of each dataset is averaged and
report-ed as the prreport-edictive accuracies. In Table 3,
classi-fication results with predictive accuracy are
re-ported for all of the datasets. To prove that feature
with higher entropy value is the most informative
features, we also performed an experiment using
lower entropy value as a comparison.
Table 3 shows the performance of feature
se-lection methods for classification using fuzzy
k
-NN classifier. The second column shows the
num-ber of
k
used for each dataset which is equal to the
total of its classes. The third column is the result
of feature selection method by using entropy
va-lues lower than the mean entropy. The fourth
co-lumn is the result of feature selection method by
using entropy values higher than the mean entropy
value. The highest classification result obtained
from Wine dataset with 96.6% of accuracy, while
the lowest is obtained by Glass dataset with 62.4
% of accuracy.
The proposed feature selection method has
reduced the number of features instead of using
all the features to perform the classification. The
number of features (x-axis) in Mean Selection
(MS) strategy is plotted against the percentage of
features selected (y-axis) in the dataset in Figure
4.
Most of the datasets are getting the selected
features approximately half of their features (54.3
%). This is because our proposed method
implem-ents the Mean Selection strategy which selecting
the features with entropy values greater than or
equivalent to the mean of the relevant values. The
remaining features that cannot satisfy this
thres-hold were then ignored. Except for E-coli dataset,
we get more than half of the overall features
(71%). This is because the E-coli dataset is having
the largest class compared to other datasets. Large
class tends to create the smaller similarity
betwe-en features. Small similarity thbetwe-en leads to high betwe-
en-tropy value that causes too many features to be
se-lected.
whi-TABEL 4