The Effect Of Fiscal Potential, Fiscal Needs And Internal Control On The Provincial Intergovernmental
Transfer Allocation In The Districts/Cities In North Sumatera
–
Indonesia.
Author’s Details: (1) Iskandar Muda*, (2) Erlina, (3) Rina Bukit, (4) Rahmanta 1Universitas Sumatera Utara, Medan, Indonesia
Abstract.
This study aims to look at the effect of fiscal potential, fiscal needs, internal control on the provincial intergovernmental transfer allocations in the North Sumatra province with the financial and economic performance as the intervening and contingency variables. The sample in this study covers 25 districts/cities in the North Sumatra province throughout the year of 2005-2012, that is selected using the purposive sampling method. The variables are analyzed using a pooling of data with eviews 7.0 tools and non-linear structural equation models with WarpPLS 3.0 software.
The results conclude that for the first hypothesis, the variable of fiscal potential in the form of the realization of the BPHTB and PBB, the fiscal needs of a regional size, total number of villages, CCI, total population in the form of internal control, weakness on the accounting and reporting control systems, weakness on the control and budget implementation system, and weaknesses on the internal control structure, the financial Performance in the form of the increase in the PAD, the increase in DAU, DAK, DBH and the opinion of the audit board and economic performance are proxied by the increase in the GDP, decrease in poverty, decrease in unemployment and the human development index and inflation affect simultaneously the provincial intergovernmental transfer allocation. While the second hypothesis concludes that the variable of the GDP is the only variable that serves as a moderating variable and the third hypothesis concludes that the variables of the increase in PAD, increase in DAU, increase in DBH and the opinion of the audit board serves as the intervening variables to the provincial intergovernmental transfer allocation, the variable of DAK does not function as an intervening variable.
Keywords: Fiscal Potential, Fiscal Need, Internal Control, Provincial Intergovernmental Transfer, Financial Performance and Economic Performance.
1. INTRODUCTION
In the context of fiscal decentralization, the changes on the map of the fiscal management accompanied by a high flexibility in the utilization of the main financial sources. Shah and Qureshi (1994) in Aziz (2009) mention six (6) goals which are achieved by a balancing system, namely; (i) to reduce the fiscal gap; (ii) to have the ability to overcome inequality fiscal and the inequality level of fiscal efficiency in a region; (iii) to reap compensation spillover benefits; (iv) to support the implementation of minimum service standards; (v) to support the achievement of national priorities; and (vi) to achieve certain goals. This phenomenon has created an inequality on the provincial intergovernmental transfer allocation which is received from the North Sumatra provincial government to the respective districts/cities.
Devas (1988) in Aziz (2009) suggests that there are seven criteria which need to be taken into account in designing the system's financial balance, that equates the regional financing on its needs. This system, according to Devas (1988) in Aziz (2009) consists of: simplicity, adequacy - to finance the basic regional needs, elasticity - adjustment on inflation, stability and predictability - the allocation amount that is relatively stable and predictable, equity – present among the inter-regional and level of the government, economic efficiency - able to ensure the use of funds efficiently, decentralization and accountability. With this financial balance system, it results in the rise of the financial and economic performance of the region. In other words, the system's financial balance can increase the successful implementation of the regional autonomy.
In this case, there are some basic things that should be
requirements, internal control, financial performance and condition of economic performance where they are the variables that play a dominant role in the transfer scheme. The fiscal needs are related to the geographical conditions of the region. The North Sumatera province has a wide area and some of them are difficult to reach causing the difficulty in the distribution of building materials. The difference of the geographical location impacts directly the price level in those regions. The fiscal needs consist of the size of the region, the number of villages, the highest average value of the construction cost index (CCI) used as the indicators of the fiscal needs.
According to Ramli (2008), Ilahi (2006) and Aziz (2009), the population and the direct expenditure are part of the fiscal needs that need to be formulated and considered with an ideal formula scheme on the provincial fund allocation. In his study, Ramli (2008) uses the variables of fiscal potential and needs. Both variables have also been used by Ilahi (2006) in his study. Thus, this motivates the author to investigate using other variables such as internal control and regional financial performance.
http://www.ijmsbr.com
Page 23
weaknesses of the internal control after the implementation ofthe Sarbanes-Oxley Act. Meanwhile, a study by Petrovits et al. (2011) which is based on the sample of 261 companies, reveals similar findings as Ge ad McVay (2006). Based on this argument, it is found that the weakness of the internal control is usually associated with less commitment in the accounting control. The weakness on the material of the internal control is related to the weakness on the policies of revenue recognition, lack of separation on responsibilities, the drawback on the process of final report period and accounting policies, and inaccurate accounting reconciliation. So is the case with the financial performance with the variables’ indicators of increase in PAD, DAU, DAK, DBH and the opinion of the audit board which are to be considered to be included in the provincial intergovernmental transfer allocation model (Aziz, 2009).
Based on the observation of the audit board of the republic of Indonesia on the improvement of the financial performance indicators in the North Sumatera province, it is found that the Medan and Sibolga cities as well as the Humbahas district have the best performance compared to other cities/districts (there are 34 cities/districts in the North Sumatera province). With regards to the balancing funds, the provincial government distributes funds to all districts/cities besides the one given by the central government.
Several studies have been done, among others by Boex and Vazquez (2004) whereby the design of the inter-governmental balancing fund mechanism, is a key element of the local government financial reform in the world, while the basic elements and principles of the said design are universally
applicable. The need of the formula reflects the efficiency, equitability and transparency on the government system implementation. The stated mechanism is explored based on the fiscal potential, fiscal requirements, internal control, financial performance and economic performance as an absolute requirement for an ideal formulation. In addition, similar research have been conducted by Kawasaki (2004) and Kalb (2010) also Maarten & Ishemoi (2011). Meanwhile, a study by Ramli (2008) looks into the analysis of financial fund allocation in the North Sumatra province. The study reveals the use of formulas and variables’ weight on the fiscal potential and needs. Moreover, the researcher uses the indicator of internal control as a variable to determine the provincial allocation’s fund and adopts the financial indicator as a form of appreciation for the local government to implement good governance. Finally, the economic indicators are the decisive factors that strengthen and weaken the relationship between several indicators on the provincial allocation’s fund that has been stated proportionally based on the potential of the region, thus it supports the principle of justice.
This study attempts to offer an appropriate model of fund allocation of the province to the cities/districts by using certain formula. Some of the variables under consideration consist of: fiscal potential, fiscal need, internal control, financial and economic performance. Given the arguments, the author conducts a study with the title "The Effect of Fiscal Potential, Fiscal Need, Internal Control of the provincial intergovernmental transfer allocation with Financial and Economic Performance as the intervening and contigency variables in the districts/cities in the North Sumatra province.
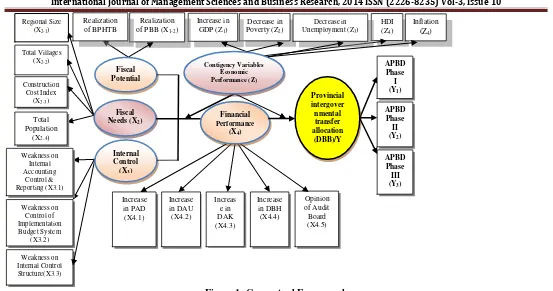
2. REVIEW OF LITERATURE 2.1. Theoritical Framework
Figure 1. Conceptual Framework 2.1.1. The Bureaucracy Theory
In the bureaucratic model, Niskanen (1971) attempts to connect between the bureau and its sponsor or other types of funding agencies in the form of a bilateral monopoly. The sponsors are represented by the local government which agrees on the given budget allocation for the public agency in order to buy goods or services from the bureau on the activities implemented. In addition, the budget allocations for the regular programs are used differently from the urgent programs. The total budget and available sponsors to be agreed, are considered as a square function of public output which is public expenditure that can be formed in the equation as follows (Kalb, 2010):
Ǫ: TBN = aQ - bǪ2.
Where Q is the total budget to form a concave function, reflecting the diminishing marginal utility that decreases the output of the public output. TBN is the bureaucrats’ efforts to maximize the budget-output function. In addition, the TC is the total cost of the production of minimum output to produce the public output.
2.1.2. The Government Agency Theory
According to Lane (2003), the agency theory can be applied in public organizations. He claims that a modern democratic state is based on a series of principal-agent relationships. The similar view is proposed by Moe(1984) which explains that the concept of the economics of the public sector organizations adopts the agency theory. The framework of the principal-agent relationship is a very important approach to analyzing public policy commitments. The preparation and implementation of public policy revolve around some contractual matters, namely asymmetric information, moral hazard, and adverse selection.
Moreover, the agency theory that explains the principal –agent relationship is rooted in the economic theory, decision theory, sociology and organizational theory. It also analyzes the contractual arrangement between two or more individuals, groups or organizations. One party (the principal) will tend to make a contract, either implicitly or explicitly, with the other party (the agent) with the expectation that the agent will act/do the job as desired by the principal.
3. RESEARCH METHODOLOGY
3.1 Research Design, Population and Sample
This study examines the theories by measuring the variables with numbers and it conducts the data analysis with statistical procedures. Meanwhile, the population consists of all 34 cities/districts in the North Sumatra province. The sample is 25 cities/districts in the province with the range of data from the year 2005 to 2012.
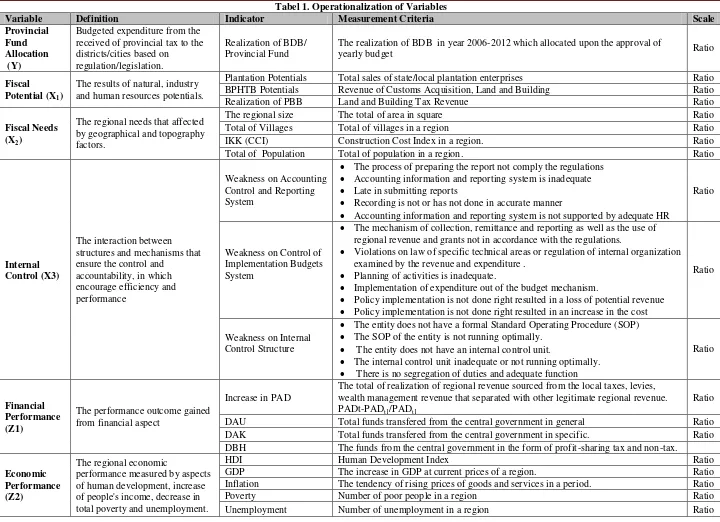
3.2 Definition and Operationalization of Research Variables
The variables of this study are in the following table:
Tabel 1. Operationalization of Variables
Variable Definition Indicator Measurement Criteria Scale
Provincial Fund Allocation (Y)
Budgeted expenditure from the received of provincial tax to the districts/cities based on
regulation/legislation.
Realization of BDB/ Provincial Fund
The realization of BDB in year 2006-2012 which allocated upon the approval of
yearly budget Ratio
Fiscal Potential (X1)
The results of natural, industry and human resources potentials.
Plantation Potentials Total sales of state/local plantation enterprises Ratio
BPHTB Potentials Revenue of Customs Acquisition, Land and Building Ratio
Realization of PBB Land and Building Tax Revenue Ratio
Fiscal Needs (X2)
The regional needs that affected by geographical and topography factors.
The regional size The total of area in square Ratio
Total of Villages Total of villages in a region Ratio
IKK (CCI) Construction Cost Index in a region. Ratio
Total of Population Total of population in a region. Ratio
Internal
The process of preparing the report not comply the regulations
Accounting information and reporting system is inadequate
Late in submitting reports
Recording is not or has not done in accurate manner
Accounting information and reporting system is not supported by adequate HR
Ratio
Weakness on Control of Implementation Budgets System
The mechanism of collection, remittance and reporting as well as the use of regional revenue and grants not in accordance with the regulations.
Violations on law of specific technical areas or regulation of internal organization examined by the revenue and expenditure .
Planning of activities is inadequate.
Implementation of expenditure out of the budget mechanism.
Policy implementation is not done right resulted in a loss of potential revenue
Policy implementation is not done right resulted in an increase in the cost
Ratio
Weakness on Internal Control Structure
The entity does not have a formal Standard Operating Procedure (SOP)
The SOP of the entity is not running optimally.
The entity does not have an internal control unit.
The internal control unit inadequate or not running optimally.
There is no segregation of duties and adequate function
Ratio
The total of realization of regional revenue sourced from the local taxes, levies, wealth management revenue that separated with other legitimate regional revenue. PADt-PADt1/PADt1
Ratio
DAU Total funds transfered from the central government in general Ratio
DAK Total funds transfered from the central government in specific. Ratio
DBH The funds from the central government in the form of profit-sharing tax and non-tax.
Economic
HDI Human Development Index Ratio
GDP The increase in GDP at current prices of a region. Ratio
Inflation The tendency of rising prices of goods and services in a period. Ratio
Poverty Number of poor people in a region Ratio
3.3. Model Analysis
3.3.1. Method of Analysis of Panel Data
The data were analyzed using the panel pooled data analysis method. In econometrics, a model which states the time series and cross section data is called panel pooled data. Thus, in the panel data they have a time series T> 1 and slices of latitude N> 1. According to Baltagi (2005), the panel data are a combination of data between the data/time series, which have observations on the unit analysis at a given point in time.
Moreover, Baltagi (2005) states that, in the Hausman test, if the results X2< X2 table, then the model must use a random effect. In the random effect, it is assumed that the individual error components are uncorrelated with each other and there is no autocorrelation either in the cross-section or time series. The variables of the cross section and time series are assumed to have been normally distributed with a free degree that is not reduced. A random effect model is estimated as the GLS regression (Generalized Least-Square) that will result in the estimators which fulfill the nature of the Best Linear Unbiased Estimation (BLUE). Thus, a disturbance in the classical assumptions of this model has normally been distributed, so that the treatment is no longer required, namely; the assumption of autocorrelation, multicollinearity and heterocedastity.
3.3.2. Pooled Least Square Approach
The least squares approach uses the panel data by collecting all data of time series and cross-section, before conducting the pooling. The data in each of the observations have a single regression. From the panel data, N is the number of cross-section units and T is the number of time periods. Using a pooling in all observations as many as N.T, thus the least square model is written as:
Yit= αi + β1X1it +β2X2it………….+ β19X19it + eit--- (1.)
for i = 1, 2,. . . , And t = 1, 2,. . ., where i is the cross-section identifiers and t is the time-series identifiers.
The simplest approach to estimate the equation is by ignoring the cross-section and time series dimensions from the panel data and to estimate the data using the ordinary least squares (OLS) method that has been applied in the pool of data.
3.4 Model Tests 3.4.1 Hausman Test
According to Baltagi (2005), the selection of either the fixed effect model or random effect model is based on these following conditions, namely:
If the value of the chi-square statistics in the Hausman test is significant, it means the model can be estimated with a fixed effect model.
If the value of the chi-square statistics in the Hausman test is not significant, it means the model can be estimated with a random effect model.
3.4.2 Hypothesis Testing Model
The models which are influenced by the moderating and mediating variables are tested and transformed in the form of the Structural Equation Modeling (SEM), where:
1 = y11 1+ y11 2+ y11 3+ y11 4+ y11 1.Z+ y11 2.Z + y11 3.Z + y11 4.Z + ç
ɳiY= Realization of Provincial Fund Allocation (Rp) Z1 = Financial performance
X1 = Fiscal potential Z2 = Economic performance
X2 = Fiscal need Ƴ= Gama, coefficient of exogenous on endogenous indicator
X3 = Internal control ç = Zeta, error models
http://www.ijmsbr.com
Page 27
Tabel 2. Index of Feasibility Model
No Goodness Of Fit Index Particular Cut-Of Point
1. Effect size To see the effect of latent variable predictors Low (0.02), Medium (0.15) dan High (0.35) 2. Output combined loadings
and cross loadings
To test the convergent validity from measured instruments (questionnaire)
Loading above 0.70 and p value significant (<0.05)
3. Output patern loading and cross loading
Looking at the correlation matrix among the latent variables
Loading value above 1
4. Output indicator weight Indicator weight on latent variables measurement Indicator Table 5. Output laten variable
coeffecient
To see the determinant coeffecient, instrument reliability, discriminant validity, full collinearity test and predictive validity.
Indicator Table
6. Q squared (Stoner-Geisser coeffecient)
Predictive validity or relevancy from a group of predictor latent variables on criterion variables
Positive value, 0-100 %
7. Full collinierity test Multicollinearity test < 3.3
8. Output correlations among latent variables
Correlation among latent variables <0.05
9. Output block VIF Vertical collinearity test < 3.3
10. Output correlation among indicator
Correlation among indicators < 1
11. Output indirect and Total Effect
Calculation the effect of mediating variables or causal relationship among indicators by looking the direct, indirect & total effect
<0.05
Source: Sholihin & Ratmono (2013).
For the second hypothesis, the moderating variable of the non-linear equation test is done using the interaction method. As for the third hypothesis, the intervening test is done with the approach of Baron and Kenny (1986) and Kock (2013) which is an estimate of the indirect effects, direct effect and the total effect.
4. FINDINGS
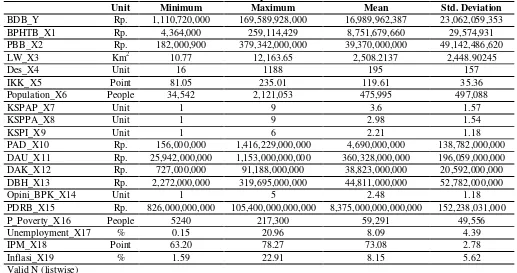
4.1. Description Analysis
The data that are analyzed descriptively are based on n=200 depicted in the Table below:
Table 3. Descriptive Statistics
Unit Minimum Maximum Mean Std. Deviation
BDB_Y Rp. 1,110,720,000 169,589,928,000 16,989,962,387 23,062,059,353
BPHTB_X1 Rp. 4,364,000 259,114,429 8,751,679,660 29,574,931
PBB_X2 Rp. 182,000,900 379,342,000,000 39,370,000,000 49,142,486,620
LW_X3 Km2 10.77 12,163.65 2,508.2137 2,448.90245
Des_X4 Unit 16 1188 195 157
IKK_X5 Point 81.05 235.01 119.61 35.36
Population_X6 People 34,542 2,121,053 475,995 497,088
KSPAP_X7 Unit 1 9 3.6 1.57
KSPPA_X8 Unit 1 9 2.98 1.54
KSPI_X9 Unit 1 6 2.21 1.18
PAD_X10 Rp. 156,000,000 1,416,229,000,000 4,690,000,000 138,782,000,000
DAU_X11 Rp. 25,942,000,000 1,153,000,000,000 360,328,000,000 196,059,000,000
DAK_X12 Rp. 727,000,000 91,188,000,000 38,823,000,000 20,592,000,000
DBH_X13 Rp. 2,272,000,000 319,695,000,000 44,811,000,000 52,782,000,000
Opini_BPK_X14 Unit 1 5 2.48 1.18
PDRB_X15 Rp. 826,000,000,000 105,400,000,000,000 8,375,000,000,000,000 152,238,031,000
P_Poverty_X16 People 5240 217,300 59,291 49,556
Unemployment_X17 % 0.15 20.96 8.09 4.39
IPM_X18 Point 63.20 78.27 73.08 2.78
Inflasi_X19 % 1.59 22.91 8.15 5.62
Valid N (listwise)
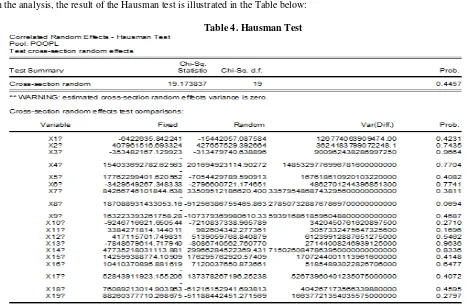
4.2. Data Analysis 4.2.1. Hausman Test
Based on the analysis, the result of the Hausman test is illustrated in the Table below:
Table 4. Hausman Test
Source: Data Output. 2014.
Based on Table 4, the value of the cross-section random statistic of the Hausman test is not significant at the amount of 19.173837 with a significance level of 5% above α = 0.4457, and this means that the model can be estimated with a model of fixed effect or random effect (REM) because it has no difference in the substance. This justifies the researcher’s use of a model of the random effect due to the consistency with the Hausman test and this is aligned with an opinion by Ghazali (2008) who states that if the panel of data has a number of time (T) smaller than the number of individuals (N), it is advisable to use a model of random effects.
4.3. Hypothesis 4.3.1. First Hypothesis
The first hypothesis in this study is the variables of fiscal potential in the form of the realization of BPHTB and PBB, the fiscal needs
of a regional size, total number of villages, CCI, total population in the form of internal control, weakness on accounting and reporting control systems, weakness on the control and budget implementation system, and weaknesses on the internal control structure, the financial Performance in the form of increase in the PAD, increase in the DAU, increase in the DAK, increase in the DBH and the opinion of the audit board and economic performance are proxied by the increase in the GDP, the decrease in poverty, the decrease in the unemployment and the human development index and inflation which affect the provincial intergovernmental transfer allocation is acceptable.
The suitability test was conducted to determine the feasibility of a regression model, where it can be seen from the value of R Square. The R Square value obtained 0.139598. This indicates that 13.95% of the provincial intergovernmental transfer allocation variable can be explained by the independent variables which consist of the fiscal potential in the form of realization of BPHTB and PBB, the
http://www.ijmsbr.com
Page 29
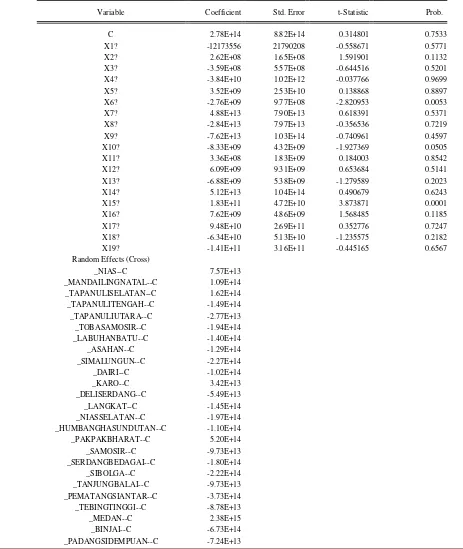
Table 5. The Statistical Test Results
Dependent Variable: Y?
Method: Pooled EGLS (Cross-section random effects) Sample: 2005 2012
Included observations: 8 Cross-sections included: 25
Total pool (balanced) observations: 200
Swamy and Arora estimator of component variances
Variable Coefficient Std. Error t-Statistic Prob.
C 2.78E+14 8.82E+14 0.314801 0.7533
X1? -12173556 21790208 -0.558671 0.5771
X2? 2.62E+08 1.65E+08 1.591901 0.1132
X3? -3.59E+08 5.57E+08 -0.644516 0.5201
X4? -3.84E+10 1.02E+12 -0.037766 0.9699
X5? 3.52E+09 2.53E+10 0.138868 0.8897
X6? -2.76E+09 9.77E+08 -2.820953 0.0053
X7? 4.88E+13 7.90E+13 0.618391 0.5371
X8? -2.84E+13 7.97E+13 -0.356536 0.7219
X9? -7.62E+13 1.03E+14 -0.740961 0.4597
X10? -8.33E+09 4.32E+09 -1.927369 0.0505
X11? 3.36E+08 1.83E+09 0.184003 0.8542
X12? 6.09E+09 9.31E+09 0.653684 0.5141
X13? -6.88E+09 5.38E+09 -1.279589 0.2023
X14? 5.12E+13 1.04E+14 0.490679 0.6243
X15? 1.83E+11 4.72E+10 3.873871 0.0001
X16? 7.62E+09 4.86E+09 1.568485 0.1185
X17? 9.48E+10 2.69E+11 0.352776 0.7247
X18? -6.34E+10 5.13E+10 -1.235575 0.2182
X19? -1.41E+11 3.16E+11 -0.445165 0.6567
Random Effects (Cross)
_NIAS--C 7.57E+13
_MANDAILINGNATAL--C 1.09E+14
_TAPANULISELATAN--C 1.62E+14
_TAPANULITENGAH--C -1.49E+14
_TAPANULIUTARA--C -2.77E+13
_TOBASAMOSIR--C -1.94E+14
_LABUHANBATU--C -1.40E+14
_ASAHAN--C -1.29E+14
_SIMALUNGUN--C -2.27E+14
_DAIRI--C -1.02E+14
_KARO--C 3.42E+13
_DELISERDANG--C -5.49E+13
_LANGKAT--C -1.45E+14
_NIASSELATAN--C -1.97E+14
_HUMBANGHASUNDUTAN--C -1.10E+14
_PAKPAKBHARAT--C 5.20E+14
_SAMOSIR--C -9.73E+13
_SERDANGBEDAGAI--C -1.80E+14
_SIBOLGA--C -2.22E+14
_TANJUNGBALAI--C -9.73E+13
_PEMATANGSIANTAR--C -3.73E+14
_TEBINGTINGGI--C -8.78E+13
_MEDAN--C 2.38E+15
_BINJAI--C -6.73E+14
Effects Specification
S.D. Rho
Cross-section random 6.41E+14 0.1721
Idiosyncratic random 1.41E+15 0.8279
Weighted Statistics
R-squared 0.139598 Mean dependent var 1.47E+14
Adjusted R-squared 0.048778 S.D. dependent var 1.47E+15
S.E. of regression 1.43E+15 Sum squared resid 3.68E+32
F-statistic 1.537085 Durbin-Watson stat 2.943582
Prob(F-statistic) 0.047565
Unweighted Statistics
R-squared 0.156168 Mean dependent var 2.41E+14
Sum squared resid 4.56E+32 Durbin-Watson stat 2.372566
Source: Result Test Eviews 7.
The test is significantly differentiated over the simultaneous significant test (F test) and partial significant test (t test) with the significance level α = 5%. As depicted in the Table, the regression equation is formed with a constant, thus the following model is established as follows:
Y = 2.78E+14 -12173556_X1 + 2.62E+08_X2 - 3.59E+08_X3+3.84E+10_X4-3.52E+09_X5 - 2.76E+09_X6 - 4.88E+13_X7 -
2.84E+13_X8 - 7.62E+13_X9-8.33E+09_X10+3.36E+08_X11+6.09E+09_X12
-6.88E+09_X13+5.12E+13_X14+1.83E+11_X15+7.62E+09_X16+9.48E+10_X17-6.34E+10_X18+-1.41E+11_X19 + e
Thus the model specification means as follows:
1. A constant value of 2.78E + 14 means that if the value of a variable fiscal potential of BPHTB realization and the PBB, fiscal needs on the regional size, the number of villages, IKK, the total population, the internal control
in the form of weakness on accounting and reporting control systems, weakness on the control systems of the budget implementation, and weaknesses of the internal control structure, financial performance for increased revenue, increase in the DAU, increase in the DAK, increase in the DBH and the observation of the audit board of the Indonesian republic and economic performance are proxied by an increase in the GDP, decrease in the poverty, decrease in the unemployment and the human development index and inflation valued of zero, then the value of the provincial fund of aid allocation is 2.78 units.
2. The variable of the BPHTB (X1) affects the provincial intergovernmental transfer allocation with the coefficient value of -12.173.556, meaning that every 1 unit increase in the variable of the BPHTB will lower the value of the provincial intergovernmental transfer allocation by 12.173 units.
3. The variable of the PBB (X2) positively affects the provincial intergovernmental transfer allocation with the coefficient value of 2.62E + 08, which means that for every 1 unit increase in the variable of the DAU, it will raise the ADBP by 2.62E + 08.
4. The variable of the regional size (X) negatively affects
the coefficient value of -3.59E + 08, meaning that for every 1 unit increase in the variable of the DAU it will decrease the ADBP by 3.59 units.
5. The variable of the number of villages (X4) negatively affects the provincial intergovernmental transfer allocation with the coefficient value of -3.84E + 10, which means that for every 1 unit increase in the variable of the DAU it will decrease the ADBP by 3.84 units. 6. The variable of the construction cost index (X5) has a
positive effect on the provincial intergovernmental transfer allocation with the coefficient value of 3.52E + 09, meaning that for every 1 unit increase in the variable of the DAU it will raise the ADBP by 3.52 units. 7. The variable of the total population (X6) negatively
affects the provincial intergovernmental transfer allocation with the coefficient value of -2.76E + 09, which means that for every 1 unit increase in the variable of the DAU, it will decrease the ADBP by 2.76 units. 8. The variable of weakness on accounting and reporting
control system (X7) has a positive effect on the provincial intergovernmental transfer allocation with the coefficient value of 4.88E + 13, and this means that for every 1 unit increase in the variable of the DAU it will increase the ADBP by 4.88 units.
http://www.ijmsbr.com
Page 31
10. The variable of the weakness on the internal controlstructure (X9) negatively affects the provincial intergovernmental transfer allocation with the coefficient value of -7.62E + 13, and it means that for every 1 unit increase in the variable of the DAU, it will increase the ADBP by 7.62 units.
11. The variable of the increase in the PAD (X10) negatively affects the provincial intergovernmental transfer allocation with the coefficient value of -8.33E + 09, meaning that for every 1 unit increase in the variable of the DAU, it will decrease the ADBP by 8.33 units. 12. The variable of the increase in the DAU (X11) has a
positive effect on the provincial intergovernmental transfer allocation with the coefficient value of 3.36E + 08, meaning that every 1 unit increase in the variable of DAU will raise the ADBP at 3.36 units.
13. The variable of the increase in DAK (X12) positively affects the provincial intergovernmental transfer allocation with the coefficient value of 6.09E + 09, which means that every 1 unit increase in the variable of DAU will raise ADBP at 6.09 units.
14. The variable of the increase in DBH (X13) negatively affects the provincial intergovernmental transfer allocation with the coefficient value of -6.88E + 09, meaning that every 1 unit increase in the variable DBH will decrease the ADBP by 6.88 units.
15. The variable of the BPK (the Audit Board) opinion (X14) positively affects the provincial intergovernmental transfer allocation with the coefficient value of 1.83E + 11, meaning that every 1 unit increase in the variable of DBH will raise the ADBP by 1.83 units.
16. The variable of the opinion on GDP (X15) positively affects the provincial intergovernmental transfer allocation with the coefficient value of 7.62E + 09, meaning that every 1 unit increase in the variable of DBH will increase the ADBP by 7.62 units.
17. The variable of poverty (X16) positively affects the provincial intergovernmental transfer allocation with the coefficient value of 9.48E + 10, meaning that for every 1 unit increase in the variable of DBH it will raise the ADBP by 9.48 units.
18. The variable of unemployment (X17) positively affects the provincial intergovernmental transfer allocation with the coefficient value of 9.48E + 10, meaning that for every 1 unit increase in the variable DBH it will raise the ADBP by 9.48 units.
19. The variable of the IPM (X18) negatively affects the provincial intergovernmental transfer allocation with the coefficient value of -6.34E + 10, which means that every 1 unit increase in the variable of DBH will decrease the ADBP by 6.34 units.
20. The variable of inflation (X19) negatively affects the provincial intergovernmental transfer allocation with the coefficient value of -1.41E + 11, and this means that every 1 unit increase in the variable of DBH will decrease the ADBP by 1.41 units.
It can be concluded that the largest constant is the Nias district with the value of 7.57E and the smallest one is the Samosir district and Tanjungbalai city for -9.73E + 13. The larger the
constant, the greater the regression equation in strengthening the prediction of a model. For the regions which receive a negative constant coefficient, they need to win the attention by the provincial government of North Sumatera.
4.3.1.1.First Hypothesis Test Model
4.3.1.1.1.Simultaneous Significance Test (F test)
Simultaneously the variable of fiscal potential in the form of the realization of BPHTB and PBB, the fiscal needs of a regional size, total number of villages, CCI, total population in the form of internal control, weakness on accounting and reporting control systems, weakness on the control and budget implementation system, and weakness on internal control structure, the financial performance in the form of increase in the PAD, increase in the DAU, increase in the DAK, increase in the DBH and the opinion of the audit board and
economic performance are proxied by the increase in the GDP, decrease in poverty, decrease in unemployment and the human development index and inflation all affect the provincial intergovernmental transfer allocation. The indicator significancy of the Adjusted R2 coefficient can be tested with the aid of the statistical methods of Fisher's test (F test) with a level of confidence by 95%. The test criteria apply when the F> Ftable then Ho is rejected, and if F ≤Ftable then Ho is acceptable. This is shown in Table 4.4 above.
From Table 5.4 above, it had obtained the value of F at 1.537085 while the Ftable at the 95% confidence level (= 0.05) was 1.52. This means that the value of F> Ftable (1.537085> 1.52). This gives the sense that there is a simultaneous positive effect of fiscal potential variables in a form of realization of BPHTB and PBB, the fiscal needs in a form of size of a region, number of villages, CCI, total population, internal control in the form of weakness on accounting and reporting control systems, weakness on the control and implementation budget system and weaknesses on the internal control structure, financial performance in a form of an increase in revenue, increase in the DAU, increase in the DAK, increase in the DBH and the audit board’s opinion and economic performance which are proxied by the increase of the GDP, decrease in poverty and unemployment and the human development index and inflation, all affecting the provincial intergovernmental transfer allocation. Thus the hypothesis Ho is rejected, while H1 is accepted.
4.3.1.1.2.Partial Significance Test (t test)
4.3.2. The Second Hypothesis
The second hypothesis with a statement of the fiscal potential in the form of realization of BPHTB and PBB, the fiscal needs in a form of the size of a region, number of villages, CCI, total population, internal control in the form of weakness on accounting and reporting control systems, weakness on the control and implementation budget system and weaknesses on the internal control structure, financial performance in the
form of an increase in the PAD, increase in the DAU, increase in the DAK, increase in the DBH and audit board’s opinion, all affecting the provincial intergovernmental transfer allocation with the economic performance which are proxied by the increase of the GDP, decrease in the poverty and unemployment and the human development index and inflation as the contingency variables. The test results are shown below:
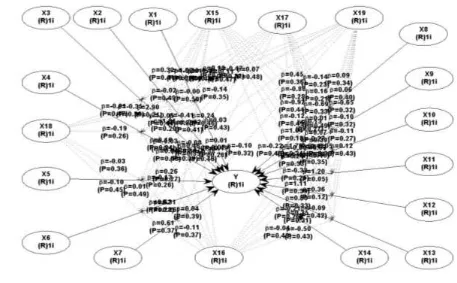
Source: Output WarpPLS 3.0 (2014)
Figure 2. Moderating Test Result
Based on the test results, they indicate that the effect of moderating variables of an increase in the GDP, decrease in poverty, decrease in unemployment, human development index and inflation influence the relationship between the variables of the realization of BPHTB and PBB, the fiscal needs in a form of size of a region, number of villages, CCI, total population, internal control in the form of weakness on accounting and reporting control systems, weakness on the control and implementation budget system and weaknesses on the internal control structure, financial performance in the form of an increase in the PAD, increase in the DAU, increase in the DAK, increase in the DBH and the audit board’s opinion on the provincial intergovernmental transfer allocation only occured on the variables of the DAU towards the provincial intergovernmental transfer allocation with moderating variables of GDP ((X15). It has found that the path coefficient coefficient value is 1,204 with a p-value of 0.050 (≤ 0.05), thus the Ho is rejected and Ha accepted. Meanwhile, the variables of poverty reduction (X16), reduction in unemployment (X17) and the human development index (X18) and inflation (X19) do not function as a moderating variable in which the p-value is greater than 0.050 alpha (≥ 0.05), thus Ho is accepted and Ha rejected.
4.3.3. The Third Hypothesis
http://www.ijmsbr.com
Page 33
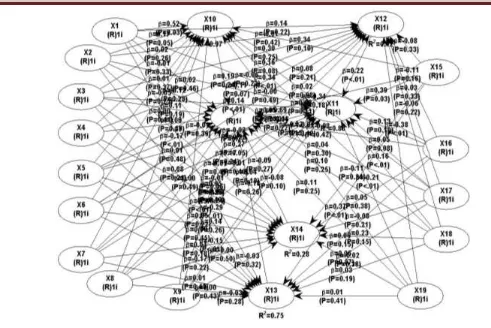
Source: Output WarpPLS 3.0 (2014)Figure 3. Result of Intervening Test
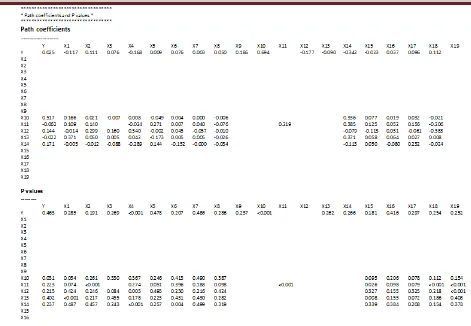
Source : Output WarpPLS 3.0 (2014)
Figure 4. Path Coeffecient Intervening Test
The value of the path coefficientof the PAD variable (X10), an increase in the DAU (X11), an increase in the DBH (X13) and the opinion of the audit board (X14) are 0.694, 0.219, 0.371 and -0289 respectively with a p-value of 0.001 (≤ 0.01), thus the Ho is rejected and Ha is accepted. Meanwhile, another variable of an increase in the DAK (X12) does not function as an intervening variable in which the p-value isgreater than 0.050 alpha (≥ 0.05), thus Ho is accepted and Ha is rejected. Meanwhile, the amount of R square coefficients of each of the intervening variables are; PAD (X10) = 0.970 (97%), an increase in the DAU (X11) = 0.878 (87.8%), an increase in the DBH (X13) = 0754 (75.4%) and the opinion of audit board (X14) = 0.278 (27.8%). The benefits of the WarpPLS application is to help the researchers avoid the manual calculation of the coefficient of indirect effects and its significance. The total effect of the PAD variable (X10) is 18.6%, an increase in the DAU (X11) is 69.4%, an increase in the DBH (X13) is - 0.177 (17.7%) and the opinion of the audit board (X14) is -0090 (9%).
5. CONCLUSION AND RECOMMENDATION
The conclusions in this study are as follows:
1. Simultaneously, the variable of fiscal potential in the form of the realization of the BPHTB and PBB, the fiscal needs of a regional size, total villages, CCI, total population in the form of internal control, weakness on accounting and
internal control structure, the financial Performance in the form of increase in the PAD, increase in the DAU, increase in the DAK, increase in the DBH and the opinion of the audit board as well as the economic performance are proxied by the increase in the GDP, decrease in poverty, decrease in unemployment and the human development index and inflation affect the provincial intergovernmental transfer allocation. The result of this study is importantly useful in developing a formula or the process of the local government budgeting system. Moreover, it reflects the spirit of implementation of regional autonomy as stated in Law 33 of 2005 in Indonesia as well as the elaboration of Act No.33 of 2004 on the fiscal balance between the central and regional governments. The results of this study are aligned with the researches done by Boex and Vazquez (2002), Maarten & Ishemoi (2011), Kawasaki (2004) and Ilahi (2006).
2. Partially only 2 independent variables of total population (X6), total of PAD (X10) and GDP (X15) affect the provincial intergovernmental transfer allocation.
http://www.ijmsbr.com
Page 35
internal control structure, financial performance in theform of an increase in the PAD, increase in the DAU, increase in the DAK, increase in the DBH and the audit
board’s opinion on the provincial intergovernmental
transfer allocation. On the other hand,other moderating variables of decrease in the poverty and unemployment and human development index havenot functioned as the moderating variables.
4. The third hypothesis concludes that only the variable of the PAD (X10), increase in the DAU (X11), increase in the DAK (X12), increase in the DBH (X13) and the audit board’s opinion (X14) serve as an intervening variable to the provincial intergovernmental transfer allocation. Meanwhile, a variable of the DAK does not function as an intervening variable.
Limitations of Research. The limitations of this study are: 1. The sample in this study is limited to certain districts/cities
that is 25 out of 34 districts/cities in the North Sumatra Province. This has led the research results to apply only to those selected districts/cities, thus it cannot be generalized to all districts/cities in Indonesia.
2. The indicators used in the test in this study directly influence the indicator of the provincial intergovernmental transfer allocation, while the patterns and weight indicator distributions are not discussed specifically.
Recommendation. This study recommends several points as follows:
1. For further researchers, they may need to perform the examination in a wider scale, especially across all the districts/cities in Indonesia due to the importance of such similar research in this era of autonomy/decentralization which enablesthe goverment agency theory to be strengthened in future.
2. It suggests to expand the component and indicators of the fiscal potential, fiscal needs, internal control, financial and economic performance.
3. Finally, the demographic and socio-economic aspects need to be considered in order to implement the intergovernmental transfer mechanism mainly on the local government,which is more representative in justice.
Reference
Azis, H. A. (2009). Reformulasi Model Transfer Pusat ke Daerah dalam mendorong Kinerja Daerah. DPR RI Jakarta. www.dpr_ri.go.id. Accessed on 14 November 2011.
Baron , R.M & D. Kenny. (1986). The Moderator-Mediator Variable Distinction in Social Psychological Research; Conceptual, Strategic and Statistical Consideration.
Journal of Personality and Social Psychology. 51(60), 1173-1182.
Baltagi, B.H. (2005). Econometric Analysis of Panel Data, Third edition. Chichester: Wiley
Boex, J., & Jorge Martinez-Vazquez, J. (2004). Designing Intergovernmental Equalization Transfers with Imperfect Data: Concepts, Practices, and Lessons. Georgia State University, Working Paper 04-21. www.iset-pi.ge. Access on 01 Juli 2014.
Ge, W., & McVay, S. (2005). The Disclosure of Material Weaknesses in Internal Control After the Sarbanes-Oxley Act. Accounting Horizon, 19(3), 137-158. Ghazali, I. (2008). Model Persamaan Struktural, konsep dan
aplikasi dengan program Amos (Structural Equation Model; Concepts and Application on AMOS Program). Badan Penerbit Universitas Diponegoro,Semarang.
Ilahi, R. (2006). Pengaruh Variabel Kebutuhan Fiskal dan Potensi Fiskal Terhadap Realisasi Dana Alokasi Umum Tahun 2005 (The Effect on Variables of Fiscal Needs and Fiscal Potential towards the Realizationof Fund Allocation). Sekolah Tinggi Ilmu Statistik. Jakarta. Kawasaki, H. (2004). Budget Formulation Process and Local
Autonomy in Japan - The Role of the Council on Economic and Fiscal Policy and Modeling Analysis.
Journal of Economic and Social Research Institute.
Japan.
Kalb, A. (2010). The Impact of Intergovernmental Grants on Cost Efficiency: Theory and Evidence from German Municipalities. Economic An Analysis & Policy Journal, 40(1).
Kock, N. (2013). Advanced Mediating Effects Tests, Multi-Group Analyses, and Measurement Model Assessments in PLS-based SEM. ScriptWarp Systems- Laredo, Texas USA
Lane, Jan-Erik. (2000). The Public Sector – Concepts, Models and Approaches.London: SAGE Publications.
Maarten A.A., & Ishemoi, L.J. (2011). Equalising spending needs of subnational governments in a developing country: the case of Tanzania. Journal of Environment and Planning C: Government and Policy, 29, 487-501. Moe, T. M. (1984). The new economics of organization.
American Journal of Political Science 28(5), 739-777. Niskanen, W. A. (1971). Bureaucracy and representative
government. Chicago: Aldine-Atherton.
Petrovits, C., Shakespeare, C., & Shih, A. (2011). The Causes and Consequences of Internal Control Problems in Nonprofit Organizations. The Accounting Review: January 2011, Vol. 86, No. 1, pp. 325-357. doi: http://dx.doi.org/10.2308/accr.00000012.
Ramli (2008). Analisa Alokasi Bantuan Keuangan Provinsi Sumatera Utara (An Analysis of Financial Aid Allocation of North Sumatera Province). Hasil Penelitian. Lembaga Penelitian Universitas Sumatera Utara. Medan.