Refer to Important disclosures on the last of this report
Stock DataTarget price (Rp) Rp270
Prior TP (Rp) Rp270
PT Sumber Arusmulia 57.3%
Sojitz Corporation 25.0%
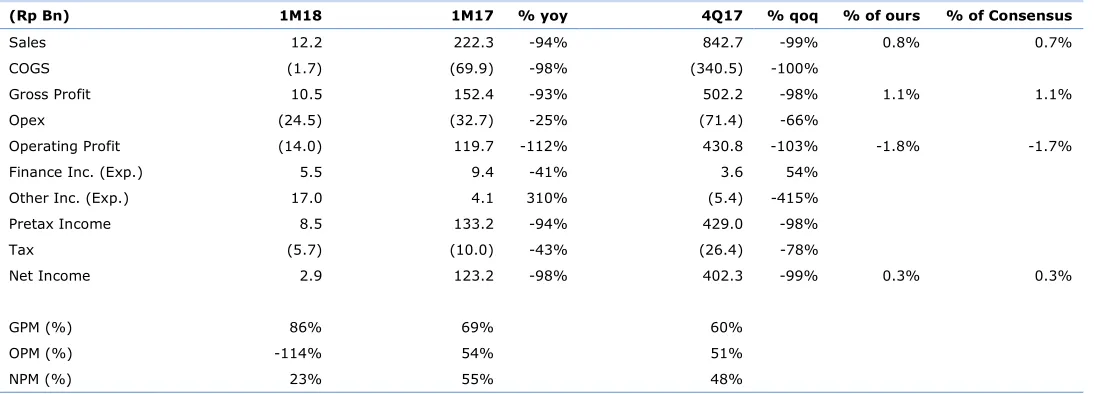
Earnings of Rp3bn in 1Q18 (-98% yoy).
Significant sales backlog of ±60ha as of 4M18.
Continuous development to improve estate’s attractiveness.
Maintain Buy with Tp of Rp270.
No industrial land sales recognized in 1Q18.
DMAS booked earnings of Rp3bn
(-98% yoy, -99% qoq) in 1Q18, which came below market expectation, only
cumulating 0.3% of our/consensus FY18 estimate. Gross margin was 86% in
1Q18 as COGS decreased by 98%, as company did not book any COGS from
industrial land. However, operating margin was negative 114%, as opex was
Rp24bn from fixed cost such as salaries and IT. At the bottom line, company
recorded positive earnings of Rp3bn and net margin 23% in 1Q18, down by 220
bps, which helped by gain on estate management of Rp14.4bn (+73% yoy) and
interest income of Rp5.5bn (-41% yoy). The weak earnings in 1Q18 was due to
slow revenue recognition, DMAS did not book any industrial land sales in 1Q18.
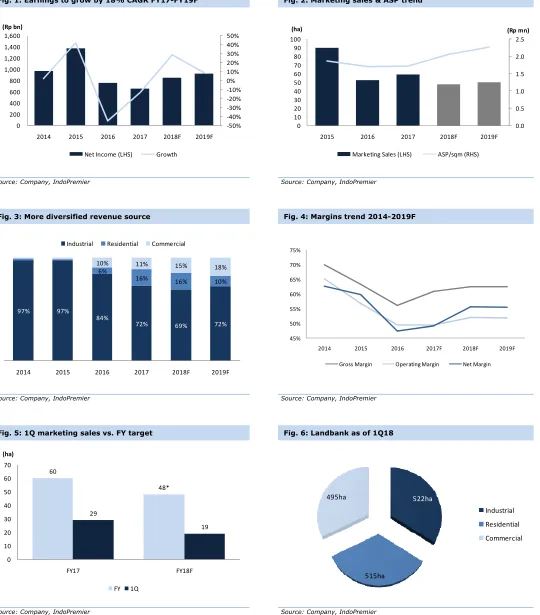
Booked marketing sales of Rp332bn (-41%) in 1Q18.
DMAS recorded
marketing sales of Rp332bn (-41% yoy) in 1Q18, mostly contributed by industrial
sales of 17ha to a pharmaceutical company, and 2ha to two separated companies.
The sale in 1Q18 represents 27% of FY18 marketing sales target of Rp1.25bn.
Thus DMAS has total of ±60ha of sales backlog as of 4M18, which worth around
Rp1tn (assuming ASP of Rp1.7mn/sqm). We believe some of sales backlog from
2017 (40ha) would be able to be recognized in the upcoming quarters, following
quite 1Q18. We are confidence in DMAS’ ability to attain land sales as DMAS has
claimed Ease of Construction after Investment (KLIK) facility to expedite more
than 100ha industrial land inquiries in 2018.
Infrastructure development in residential and commercial area.
Company
currently has total of 1,532ha unscattered landbank with ±300ha ready to sell
industrial land. To further improve the estate’s attractiveness, DMAS has prepared
several plans in 2018: 1) Launching of Panahome’s residential products after Eid
ul-Fitr, 2) Creating a JV to build a Logistics Center to improve infrastructure in
Kota Deltamas, and 3) Building 2-4 new rental factories to accommodate
investors who is willing to start productions before purchasing a land.
Maintain Buy with unchanged TP of Rp270.
We continue to like DMAS as we
believe the weak result in 1Q18 were only a fluctuation in quarterly revenues of
industrial estate developers. We maintain our FY18 forecast as we are confidence
that DMAS will be able to recognize their sales backlog in the next quarters.
Maintain Buy on DMAS with unchanged TP of Rp270. DMAS currently trades at an
attractive single digit FY18F PE of 9.6x or 61% discount to our estimate RNAV.
Source: DMAS, IndoPremier Share Price Closing as of : 30-April-2018
2
Refer to Important disclosures on the last of this report
Fig. 1: Earnings to grow by 18% CAGR FY17-FY19F Fig. 2: Marketing sales & ASP trend
Source: Company, IndoPremier Source: Company, IndoPremier
Fig. 3: More diversified revenue source Fig. 4: Margins trend 2014-2019F
Source: Company, IndoPremier Source: Company, IndoPremier
Fig. 5: 1Q marketing sales vs. FY target Fig. 6: Landbank as of 1Q18
Source: Company, IndoPremier Source: Company, IndoPremier
-50%
2014 2015 2016 2017 2018F 2019F
(Rp bn)
2014 2015 2016 2017 2018F 2019F
Industrial Residential Commercial
2014 2015 2016 2017F 2018F 2019F
Gross Margin Operating Margin Net Margin
3
Refer to Important disclosures on the last of this report
Fig. 7: DMAS 1Q17 Earnings Result(Rp Bn) 1M18 1M17 % yoy 4Q17 % qoq % of ours % of Consensus
Sales 12.2 222.3 -94% 842.7 -99% 0.8% 0.7% COGS (1.7) (69.9) -98% (340.5) -100%
Gross Profit 10.5 152.4 -93% 502.2 -98% 1.1% 1.1% Opex (24.5) (32.7) -25% (71.4) -66%
Operating Profit (14.0) 119.7 -112% 430.8 -103% -1.8% -1.7% Finance Inc. (Exp.) 5.5 9.4 -41% 3.6 54%
Other Inc. (Exp.) 17.0 4.1 310% (5.4) -415% Pretax Income 8.5 133.2 -94% 429.0 -98% Tax (5.7) (10.0) -43% (26.4) -78%
Net Income 2.9 123.2 -98% 402.3 -99% 0.3% 0.3%
GPM (%) 86% 69% 60%
OPM (%) -114% 54% 51%
NPM (%) 23% 55% 48%
4
Refer to Important disclosures on the last of this report
Year To 31 Dec (RpBn) 2016A 2017A 2018F 2019F 2020F
Income Statement
Net Revenue 1,594 1,336 1,520 1,660 1,770
Cost of Sales (698) (522) (570) (623) (665)
Gross Profit 896 815 950 1,037 1,105
SG&A Expenses (106) (154) (159) (175) (199)
Operating Profit 790 661 791 862 905
Net Interest 10 24 24 24 25
Forex Gain (Loss) (27) 2 0 0 0
Others-Net 69 21 88 98 105
Pre-Tax Income 841 707 904 984 1,036
Income Tax (66) (37) (42) (46) (50)
Minorities 0 0 (1) (1) (1)
Net Income 757 657 847 921 968
Balance Sheet
Cash & Equivalent 1,219 785 1,058 936 877
Receivable 0 50 57 62 66
Inventory 2,380 2,602 2,337 2,559 2,879
Other Current Assets 115 99 132 162 194
Total Current Assets 3,714 3,536 3,583 3,719 4,016
Fixed Assets - Net 4,090 3,868 4,436 4,939 5,297
Goodwill 0 0 0 0 0
Non Current Assets 0 15 17 18 20
Total Assets 7,804 7,471 8,096 8,742 9,402
ST Loans 0 0 0 0 0
Payable 39 18 0 20 22
Other Payables 356 419 445 486 520
Current Portion of LT Loans 0 0 0 0 0
Total Current Liab. 395 438 463 506 542
Long Term Loans 0 0 0 0 0
Other LT Liab. 20 27 36 48 63
Total Liabilities 415 465 499 553 605
Equity 5,200 5,200 5,200 5,200 5,200
Retained Earnings 2,185 1,803 2,393 2,984 3,593
Minority Interest 3 4 4 5 5
Total SHE + Minority Int. 7,388 7,006 7,597 8,188 8,797
Total Liabilities & Equity 7,804 7,471 8,096 8,742 9,402
5
Refer to Important disclosures on the last of this report
Year to 31 Dec 2016A 2017A 2018F 2019F 2020F
Cash Flow
Net Income (Excl.Extraordinary&Min.Int) 758 657 847 922 968
Depr. & Amortization 10 20 24 30 36
Changes in Working Capital 738 (289) 248 (249) (344)
Others (9) (412) (37) 32 23
Cash Flow From Operating 1,514 (11) 1,097 752 701
Capital Expenditure (588) 187 (594) (535) (396)
Others 10 (29) 17 19 21
Cash Flow From Investing (578) 158 (577) (516) (375)
Loans 0 0 0 0 0
Equity 0 0 0 0 0
Dividends (530) (1,036) (256) (330) (359)
Others 0 0 0 0 0
Cash Flow From Financing (530) (1,036) (256) (330) (359)
Changes in Cash 406 (888) 264 (94) (33)
Financial Ratios
Gross Margin (%) 56.2 61.0 62.5 62.5 62.4
Operating Margin (%) 49.6 49.5 52.0 51.9 51.1
Pre-Tax Margin (%) 52.8 52.9 59.4 59.3 58.5
Net Margin (%) 47.5 49.1 55.7 55.5 54.7
ROA (%) 9.6 8.6 10.9 10.9 10.7
ROE (%) 10.4 9.1 11.6 11.7 11.4
ROIC (%) 10.5 9.5 11.9 12.0 11.7
Acct. Receivables TO (days) 0.0 13.6 12.8 13.0 13.2
Acct. Receivables - Other TO (days) 0.0 0.0 0.0 0.0 0.0
Inventory TO (days) 0.3 0.2 0.2 0.3 0.2
Payable TO (days) 24.3 20.2 11.8 11.3 11.5
Acct. Payables - Other TO (days) 1.7 4.2 5.1 4.8 4.9
Debt to Equity (%) 0.0 0.0 0.0 0.0 0.0
Interest Coverage Ratio (x) 0.0 0.0 0.0 0.0 0.0
Net Gearing (%) (16.5) (11.2) (13.9) (11.4) (10.0)
Head Office
PT INDO PREMIER SEKURITAS
Wisma GKBI 7/F Suite 718
Jl. Jend. Sudirman No.28
Jakarta 10210 - Indonesia
p +62.21.5793.1168
f +62.21.5793.1167
INVESTMENT RATINGS
BUY : Expected total return of 10% or more within a 12-month period HOLD : Expected total return between -10% and 10% within a 12-month period SELL : Expected total return of -10% or worse within a 12-month period
ANALYSTS CERTIFICATION.
The views expressed in this research report accurately reflect the analysts personal views about any and all of the subject securities or issuers; and no part of the research analyst's compensation was, is, or will be, directly or indirectly, related to the specific recommendations or views expressed in the report.
DISCLAIMERS