P-ISSN: 2087-1228 E-ISSN: 2476-9053
Binus Business Review, 7(3), November 2016, 289-295
DOI: 10.21512/bbr.v7i3.1498
TICK SIZE IMPLEMENTATION OF KOMPAS 100 INDEX
AT INDONESIA STOCK EXCHANGE
Agustini Hamid
Accounting and Finance Department, Faculty of Economic and Communication, Bina Nusantara University Jln. K.H. Syahdan No 9, Jakarta Barat, DKI Jakarta, 11480, Indonesia.
Received: 1st July 2016/ Revised: 9th December 2016/ Accepted: 3rd January 2017
How to Cite: Hamid, A. (2016). Tick Size Implementation
of Kompas 100 Index at Indonesia Stock Exchange. Binus Business Review, 7(3), 289-295. http://dx.doi.org/10.21512/bbr.v7i3.1498
ABSTRACT
Tick Mechanism was included in market microstructure. It studied the process which investors’ latent demands were ultimately translated into prices and volumes. This research reviewed the theoretical, empirical, and experimental literature on market microstructure relating to return, volatility, and liquidity after implementation of new tick size in Indonesia Stock Exchange (IDX). The study took a sample of Kompas 100 index because it was represented all level of tick size at IDX. The data were analyzed using differences test with analysis tools e-views. Using Wilcoxon Signed Rank Test, there were not significance difference of volatility, return, and liquidity after the implementation of new tick size. The difference of implementation new tick size were contrary results that old tick size has a positive value to return and liquidity while it was negative for volatility. It means that increasing of liquidity and return have the impact to volatility. While the implementation of new tick size has the negative impact to return, liquidity, and volatility.
Keywords: market microstructure, tick size, return, volatility, liquidity, Wilcoxon signed rank test
INTRODUCTION
Tick Size mechanism is included in market microstructure. O’hara (1995) defined market microstructure as the study of the process and outcomes of exchanging assets under explicit trading rules. While much of economics abstracts from the mechanics of trading, microstructure literature analyzes how specific trading mechanisms affect the price formation process. The book also provides an excellent and detailed survey of the theoretical literature in market microstructure.
Harris (1999) provided a general conceptual overview of trading and the organization of markets in his text, but his focus is not on the academic literature. While Lyons (2000) examined the market microstructures of foreign exchange markets. Survey articles emphasize depth over breadth, often focusing
on a select set of issues. Keim and Madhavan (1998) has surveyed the literature on execution costs, focusing on institutional traders.
Coughenour and Shastri (1999) provided a detailed summary of recent empirical studies in four selected areas; the estimation of the components of the bid-ask spread, order flow properties, the Nasdaq controversy, and linkages between option and stock markets. A survey of the early literature in the area is provided by Cohen et al., (1986).
Tick Size implementation in every country has different ways. It provides “natural experiments environment”, which most studies investigate their impact on liquidity measured with bid-ask spreads and quoted depths. US studies generally find conflicting results since tick size reductions tend to reduce bid-ask spreads (transaction costs), but at the same time also lower quoted depths (Goldstein & Kavajecz, 1998).
Wu, Krehbiel, & Brorsen (2011) have found in 1997 NYSE tick reduction from $1/8s to $1/16ths seems to be increasing increases instead of decreasing the effective bid-ask spreads of high-price low-volume shares.
Similar to the US, studies in emerging order-driven markets also find conflicting results associated with tick size implementation. Both bid-ask spreads and market depths decline after tick reductions (Pavabutr & Prangwattananon, 2009). Market depths decrease because quote-matchers tend to take advantage of large open orders by placing slightly better orders in front of the queued orders. To protect themselves, informed traders will divide their orders to smaller quantities and change from limit orders to market orders (Ekaputra & Asikin, 2012). Furthermore, if the tick size is too small, market participants will be frustrated because of increasing negotiation time (Purwoto & Tandelilin, 2004).
IDX has implemented a new tick size that was applied on 2 January 2007. The purpose of applying the new tick size is to increase trading volume and liquidity. The IDX system is an automated Trading System known as Jakarta Automated Trading System (JATS) on May 22nd, 1995. JATS is an electronic order book operating continuously in two trading session. IDX divides a trading hour in two session. First Session is between 09.00 to 12.00 Indonesian Western Time on Monday to Thursday and between 9:00 – 11.30 on Friday. While second session is between 13.30 to 15:49:59 on Monday to Thursday, and between 14.00 - 15:49:59 on Friday. Nowadays, IDX also uses the pre-opening, pre-closing and post trading session which opened every Exchange day. The implementation of Tick Size can be shown in Table 1.
The other study, Ahn, Cai, Chan and Hamao (2007) showed that bid-ask spreads reductions are greater for stocks with larger tick size reductions and higher trading activity. Furthermore, Ascioglu, Commerton-Forde, and McInish (2010) have contended that tick size should be established based on trading activity and price, rather than price alone.
While a research of Porter, Powell, and Weaver (1996) in the Toronto Stock Exchange have found that tick size reduction does not significantly improve price efficiency, but it significantly reduces execution
cost. Moreover, the research also finds that transaction volume negatively (positively) impact price efficiency (execution cost), and return variance positively affect both price efficiency and execution cost. Meanwhile, stock price level does not impact price efficiency but negatively impact execution cost. Unlike the most researches, this research focuses on comparing the divergence in return, volatility, and liquidity on new tick size compared with old tick size.
METHODS
The research utilizes transaction data from high, low, open, closing price and transaction volume. The research uses the sample from Kompas 100 index because it represents all level of tick size at Indonesia Stock Exchange and has the same characteristics suitable with the variable observed.
To select the stock to be included in the sample, the process is selecting stocks that are included in the Kompas Index 100 in 2016. From the Kompas 100 index, there are five selected companies that have the highest average closing price in each group of tick size. After that excluded the stocks that have daily transaction values beating the tick size.
Liquidity describes the degree to which an asset or security can be quickly bought or sold in the market without affecting the asset’s price. Market liquidity refers to the extent to which a market such as a country’s stock market or a city’s real estate market that allows assets to be bought and sold at stable prices. To measure liquidity by calculating trade volume activity in old tick size and new tick size. The equation is as follows:
(1)
The trading volume is one of the parameters of stocks transactions. Liquidity of stocks depends on how the stocks are easier to trade. The research investigates to calculate the differences of liquidity in old tick size and new tick size.
Numerous recent studies have been directed at modeling the stock market volatility using time series Table 1 The Implementation of Tick Size
Price
Rp200,00 Rp25,00 Rp5,00 Rp5,00 Rp5,00 Rp1,00 Rp1,00 Rp1,00
Rp200,00 to 500,00 Rp5,00 Rp2,00
Rp500,00 to 2000,00 Rp25,00 Rp10,00 Rp10,00 Rp5,00 Rp5,00
Rp2000,00 to < Rp5000,00 Rp25,00 Rp25,00 Rp10,00
modeling in Floros (2009). However, they only use closing prices, and therefore, their examinations fail to consider a full range of prices (high, low, open as well as closing prices) in each trading day. To further test the efficiency of volatility measures in the data, Floros (2009) defined model for the non-constant volatility parameter using four models based on the open, close, high, and low prices. Floros (2009) also proposed a volatility measure which is subject to a downward bias problem:
VRS,t = [ln(Ht)-ln(Ot)] [ln(Ht)-ln(Ct)]+ [ln(Lt)-ln(Ot)] [ln(Lt)-ln(Ct)] (2)
Ht = stock’s high price t-period Lt = stock’s low price t-period Ot = opening price t-period
C
t= c
losing price
t-period
The data covers Kompas 100 index period August 2015 - January 2016. Closing, open, high and low prices for stock indices are obtained from Yahoo Finance and chart nexus. The research would also calculate the differences of volatility an old tick size and new tick size. Based on Brigham and Houston (2006), the rate of return on an investment can be calculated as follows:
(3)
This research would calculate the return of stock index Kompas 100 that is selected by the following approaches:
(4)
ERt = Expected stock’s return in t-period Pt = Stock return on t-period
Pt-1 = Stock return before t-period
The implementation of new tick size can be seen in Figure 1.
Figure 1 Conceptual Framework
From the conceptual framework, several hypothesis can be seen as follows:
H1: Is there difference return on Kompas 100 index after new tick size implementation?
H2: Is there difference liquidity on Kompas 100 index after new tick size implementation? H3: Is there difference volatility on Kompas 100
index after new tick size implementation?
RESULTS AND DISCUSSIONS
Based on Wilcoxon signed rank test method, the probability value is 0,0020, the analysis of difference of return variable is lower than 0,05 so that it can be concluded that the test results to return variable of tick price Rp1,00 have significant differences. From the table of descriptive statistics, the average mean increase from -0,002476 to 0,0003472. It is indicated that the changes are positive value.
Based on Wilcoxon signed rank test, the probability value is 0,2516. It means that the analysis of differences return variable is higher than 0,05 so that it can be concluded that the test results of return variable tick price of Rp5,00 does not have a significant difference that could be approved in descriptive statistics table. The average mean increase from -0,000993 to 0,003555. It is indicated that the changes are positive value.
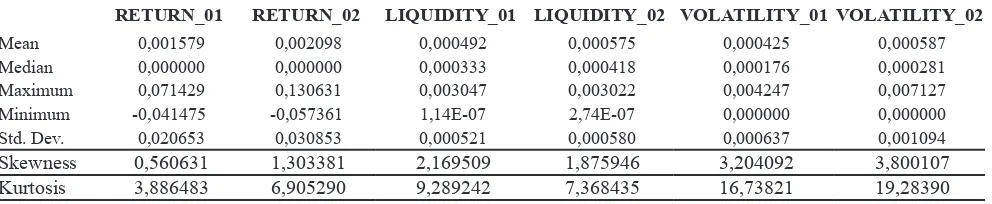
Based on Wilcoxon signed rank test, the probability value is 0,7163. It shows that analysis of difference from return variable is greater than 0,05 so it can be concluded that the test results to return variable of Rp25,00 tick size does not have significant differences that could be shown in descriptive statistics table. The average mean is increased from 0,001579 to 0,002098. It is indicated the difference has a positive value.
Based on Wilcoxon signed rank test results, the probability value is 0,9256. It means that the analysis of differences on liquidity variable is higher than 0,05 so that it could be concluded that the test of liquidity variables on tick size Rp1,00 does not have a significant difference that can be shown in the descriptive statistics table. The average mean declines from 0,003348 to 0,003182. It is indicated that the difference has a negative value.
Based on Wilcoxon signed rank test, the probability value is 0,0028. It means that the analysis of differences on liquidity variable is lower than 0,05 so that it can be concluded that the test of liquidity variables on tick size Rp5,00 has a significant difference that could be shown in descriptive statistics table. The average mean increases from 0,002317 to 0,003132. It is indicated that the difference has a positive value.
Based on Wilcoxon signed rank test, the probability value is 0,3011. It means that the analysis
Return
Liquidity
Volatility
of differences on liquidity variable is higher than 0,05 so that the test of liquidity variables on the tick price Rp25,00 has a significant difference that could be shown in descriptive statistics table. The average mean increases from 0,000492 to 0,00575. It is indicated the differences has a positive value.
Based on Wilcoxon signed rank test, the volatility value is 0,1554. It means that the analysis of differences in volatility is higher than 0,05 so that it can be concluded that the test of volatility on tick size Rp1,00 does not have a significant difference that is shown in descriptive statistics table. The average mean declines from 0,000493 to 0,000443. It is indicated the differences has negative value.
Based on Wilcoxon signed rank test, the volatility value is 0,7534. It means that the analysis of differences is higher than 0,05 so that the test of volatility on tick size Rp5,00 does not have a significant difference that is shown in descriptive statistics table. The average mean declines from 0,000661 to 0,000639. It is indicated that the difference has negative value.
Based on Wilcoxon signed rank test, the volatility value is 0,2621. It means that the analysis of differences is higher than 0,05 so that the test of volatility on tick size Rp25,00 does not have a significant difference that is shown from descriptive statistics table. The average mean increases from 0,000425 to 0,000587. It is indicated that the difference has positive value. The result of old tick size’s descriptive statistic can be seen in Table 2.
Based on Wilcoxon signed rank test, the probability value is 0,9756. It means that the analysis of differences return variable is higher than 0,05 so that it can be concluded that the test results of return variable of Rp1,00 tick price does not have a significant difference that is approved in descriptive statistics table. The average mean increases from -0,02324 to -0,001160. It is indicated that the changes are positive value.
Based on Wilcoxon signed rank test, the probability value is 0,5408. It means that the analysis of differences return variable is higher than 0,05 so that the test results of return variable of Rp5,00 does not have a significant difference that could be shown in descriptive statistics table. The average mean increases from 0,004173 to -0,006541. It is indicated that the difference has negative value.
Based on Wilcoxon signed rank test, the probability value is 0,4433, where the analysis of difference return variable is higher than 0,05. So that it can be concluded that the test results of return variable tick price of Rp10,00 does not have a significant difference that could be shown in descriptive statistics table. The average mean declines from -0,000364 to -0,003771. It is indicated that the differences have a negative value.
Based on Wilcoxon signed rank test, the probability value is 0,9394. It means that the analysis of differences return variable is higher than 0,05 so that the test results of return variable tick price of Rp25,00 does not have a significant difference that could be
shown in descriptive statistics table. The average mean increases from -0,002277 to -0,000484. It is indicated that the differences have a positive value.
Based on Wilcoxon signed rank test results, the probability value is 0,1017. It means that the analysis of differences on liquidity variable is higher than 0,05 so that the test of liquidity variables on tick size Rp50,00 does not have a significant difference that could be shown in the descriptive statistics table. The average mean declines from from 0,001731 to -0,003806. It is indicated that the difference has a negative value.
Based on the Wilcoxon signed rank test the probability value is 0,7776. It means that the analysis of differences on liquidity variable is higher than 0,05 so that it can be concluded that the test of liquidity variables on tick size Rp1,00 does not have a significant difference that could be shown in descriptive statistics table. The average mean increases from 0,002136 to -0,002357. It is indicated that the difference has a positive value.
Based on Wilcoxon signed rank test, the probability value is 0,7857. It means that the analysis of differences on liquidity variable is higher than 0,05 so that it can be concluded that the test of liquidity variables on the tick price Rp5,00 does not have a significant difference that could be shown in descriptive statistics table. The average mean declines from 0,003898 to 0,003787. It is indicated the differences has a negative value.
Based on Wilcoxon signed rank test, the probability value is 0,0126. It means that the analysis of differences on liquidity variable is lower than 0,05 so that it can be concluded that the test of liquidity variable on the tick price Rp10,00 has a significant difference that could be shown in descriptive statistics table. The average meandeclines from 0,002557 to -0,002078. It is indicated the differences has a negative value.
Based on Wilcoxon signed rank test, the probability valueis 0,0140. It means that the analysis of differences on liquidity varaible is lower than 0,05 so that it can be concluded that the test of liquidity variables on the tick price Rp25,00 has a significant difference that is shown on in descriptive statistics table. The average mean declines from 0,001045 to 0,000789. It is indicated the differences have a negative value.
Based on Wilcoxon signed rank test, the volatility value is 0,4908. It means that the analysis of differences in volatility is higher than 0,05 so that it can be concluded that the test of volatility on Rp 50,00 tick size does not have a significant difference that is shown in descriptive statistics table. The average mean increases from 0,000541 to 0,000688. It is indicated the differences have the positive value.
from 0,000958 to 0,000904. It is indicated that the difference has negative value.
Based on Wilcoxon signed rank test, the volatility value is 0,1472. It means that the analysis of differences is higher than 0,05 so that it is concluded that the test of volatility on tick size Rp5,00 has a significant difference that could be shown in descriptive statistics table. The average mean decreases from -0,001411 to 0,001030. It is indicated that the difference has negative value.
Based on Wilcoxon signed rank test, the volatility value is 0,0174. It means that the analysis of differences is lower than 0,05 so that it is concluded that the test of volatility on Rp10,00 tick size has a significant difference that could be shown in descriptive statistics table. The average mean declines from 0,012750 to 0,000560. It is indicated that the difference has negative value.
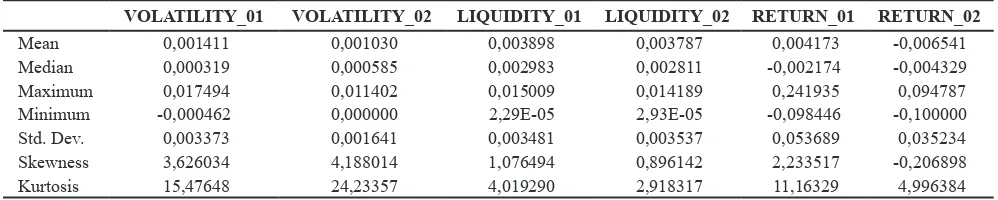
Based on Wilcoxon signed rank test, the volatility value is 0,5811. It means that the analysis of differences is higher than 0,05 so that it is concluded that the test of volatility on tick size Rp25,00 does not have a significant difference that could be shown in descriptive statistics table with the average mean declines from 0,000475 to 0,000473. It is indicated that the difference has negative value.
Based on Wilcoxon signed rank test, the volatility value is 0,7776. It means that the analysis of differences is higher than 0,05 so that it is concluded that the test of volatility on tick size Rp50,00 does not have a significant difference that could be shown in descriptive statistics table. The average mean increases from 0,000254 to 0,000270. It is indicated that the difference has positive value. The result of new tick size’s descriptive statistic can be shown in Table 3.
Table 2 Descriptive Statistics on Old Tick Size
RETURN_01 RETURN_02 LIQUIDITY_01 LIQUIDITY_02 VOLATILITY_01 VOLATILITY_02
Mean -0,002476 0,003472 0,003348 0,003182 0,000493 0,000443
Median 0,000000 0,000000 0,000860 0,001081 0,000346 0,000189
Maximum 0,058140 0,087336 0,017285 0,018483 0,003349 0,006803
Minimum -0,058824 -0,041860 5,38E-07 5,38E-08 0,000000 0,000000
Std. Dev. 0,016876 0,019154 0,004699 0,004120 0,000622 0,000781
Skewness 0,212786 1,320101 1,360406 1,614663 2,262417 4,735982
Kurtosis 5,523353 6,873674 3,426141 5,091027 9,079410 34,74560
Descriptive Statistic of tick size IDR 1
RETURN_01 RETURN_02 LIQUIDITY_01 LIQUIDITY_02 VOLATILITY_01 VOLATILITY_02
Mean -0,000993 0,003555 0,002317 0,003132 0,000661 0,000639
Median 0,000000 0,001111 0,000980 0,001373 0,000425 0,000417
Maximum 0,073171 0,113139 0,029417 0,017197 0,005969 0,003006
Minimum -0,065421 -0,076087 0,000174 0,000262 0,000000 0,000000
Std. Dev. 0,025510 0,033121 0,003881 0,003866 0,000876 0,000671
Skewness 0,294141 0,412134 4,249132 1,879072 4,003498 1,881140
Kurtosis 3,935683 4,169495 26,17505 5,975911 21,56751 6,207944
Descriptive Statistic of tick size IDR 5
RETURN_01 RETURN_02 LIQUIDITY_01 LIQUIDITY_02 VOLATILITY_01 VOLATILITY_02
Mean 0,001579 0,002098 0,000492 0,000575 0,000425 0,000587
Median 0,000000 0,000000 0,000333 0,000418 0,000176 0,000281
Maximum 0,071429 0,130631 0,003047 0,003022 0,004247 0,007127
Minimum -0,041475 -0,057361 1,14E-07 2,74E-07 0,000000 0,000000
Std. Dev. 0,020653 0,030853 0,000521 0,000580 0,000637 0,001094
Skewness 0,560631 1,303381 2,169509 1,875946 3,204092 3,800107
Kurtosis 3,886483 6,905290 9,289242 7,368435 16,73821 19,28390
CONCLUSIONS
Over the last years, the theoretical and empirical research on financial markets, especially in market microstructure theory, proves that there are the different impact in every country. This research focuses on the theoretical, empirical, and experimental literature on market microstructure relating to return, volatility, and liquidity after implementation of new tick size in Indonesia Stock Exchange (IDX).
Using Wilcoxon Signed Rank Test, there are no significance difference of volatility, return, and
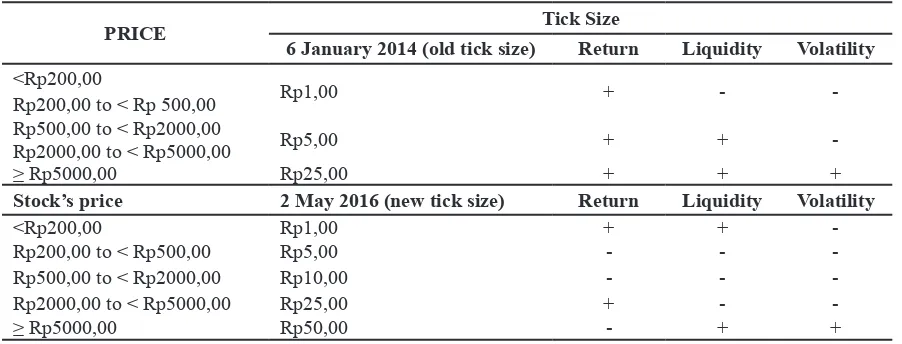
liquidity after the implementation of new tick size. The difference of implementation new tick size is contrary to the results that old tick size has a positive value to return and liquidity while it is negative for volatility. It means that the increase of liquidity and return had the impact of volatility. While the implementation of new tick size has the negative impact on return, liquidity, and volatility. The result can be shown in Table 4.
The results of research also support the goal of Indonesia Stock Exchange. which are to improve liquidity and reduce the volatility.
Table 3 Descriptive Statistics on New Tick Size
VOLATILITY_01 VOLATILITY_02 LIQUIDITY_01 LIQUIDITY_02 RETURN_01 RETURN_02
Mean 0,001411 0,001030 0,003898 0,003787 0,004173 -0,006541
Median 0,000319 0,000585 0,002983 0,002811 -0,002174 -0,004329
Maximum 0,017494 0,011402 0,015009 0,014189 0,241935 0,094787
Minimum -0,000462 0,000000 2,29E-05 2,93E-05 -0,098446 -0,100000
Std. Dev. 0,003373 0,001641 0,003481 0,003537 0,053689 0,035234
Skewness 3,626034 4,188014 1,076494 0,896142 2,233517 -0,206898
Kurtosis 15,47648 24,23357 4,019290 2,918317 11,16329 4,996384
Descriptive Statistic of tick size IDR 1
VOLATILITY_01 VOLATILITY_02 LIQUIDITY_01 LIQUIDITY_02 RETURN_01 RETURN_02
Mean 0,012750 0,000560 0,002557 0,002078 -0,000364 -0,003771
Median 0,000239 0,000379 0,001855 0,001348 0,000000 -0,002920
Maximum 0,928548 0,003899 0,009608 0,011057 0,066667 0,085106
Minimum 0,000000 0,000000 0,000396 0,000178 -0,052469 -0,056980
Std. Dev. 0,107177 0,000586 0,001973 0,002060 0,019518 0,025852
Skewness 8,485793 3,003419 1,244669 1,919262 0,590505 0,663917
Kurtosis 73,01033 15,78128 4,150857 7,075402 4,740108 4,707823
Descriptive Statistic of tick size IDR 10
Mean 0,000475 0,000473 0,001045 0,000789 -0,002277 -0,000484
Median 0,000268 0,000268 0,000797 0,000590 -0,001472 0,000000
Maximum 0,003343 0,004035 0,004731 0,003850 0,051282 0,076010
Minimum 0,000000 0,000000 8,60E-05 2,82E-05 -0,082353 -0,043880
Std. Dev. 0,000638 0,000647 0,000894 0,000730 0,024311 0,019563
Skewness 2,824337 3,746177 1,534432 1,415171 -0,574739 0,574220
Kurtosis 11,89369 19,35404 5,744680 5,701216 4,573426 5,233891
Descriptive Statistic of tick size IDR 25
Mean 0,000254 0,000270 0,000541 0,000688 0,001731 -0,003806
Median 0,000145 0,000151 0,000386 0,000330 0,000000 -0,002076
Maximum 0,002351 0,001792 0,003972 0,007575 0,050279 0,048322
Minimum 0,000000 0,000000 2,40E-05 5,16E-05 -0,047340 -0,058239
Std. Dev. 0,000353 0,000335 0,000604 0,001054 0,019911 0,022536
Skewness 3,537904 2,188666 3,403803 4,302376 0,065164 -0,070112
Kurtosis 19,11300 8,580480 17,61266 26,41474 3,376221 3,230635
REFERENCES
Ahn, H. J., Cai, J., Chan, K., & Hamao, Y. (2007). Tick size change and liquidity provision on the Tokyo stock exchange. Journal of the Japanese and International Economies, 21(2), 173–194.
Ascioglu, A., Commerton-Forde, C., & McInish, T. H. (2010). An examination of minimum tick sizes on the Tokyo stock exchange. Japan and the World Economy, 22(1), 40–48.
Brigham, E. F., & Houston. (2006). Fundamental of financial management (11th ed.). New York: Cengage.
Coughenour, J., & Shastri, K. (1999). Symposium on market microstructure: A review of the empirical evidence. The Financial Review, 34 (4), 1 - 27.
Floros, C. (2009). Modelling volatility using high, low, open, and closing price : Evidence from S&P Indices. International Research Journal of Finance and Economics, 28, 198 - 206.
Goldstein, M. A., & Kavajecz, K. A. (1998). Eighths, sixteenths, and market depth: Changes in tick size and liquidity provision on the NYSE. Journal of Financial Economics, 56, 125–149.
Harris, L., (1999). Trading and exchanges. Mimeo: University of Southern California.
Keim, D. B., & Madhavan, A. (1998). The costs of institutional equity trades: An overview. Financial Analysts Journal, 54, 50-69.
Ekaputra, I. A., & Asikin, E. S. (2012). Impact of tick size reduction on small caps price efficiency and
Table 4 The Comparable Result of Old Versus New Tick Size
PRICE Tick Size
6 January 2014 (old tick size) Return Liquidity Volatility <Rp200,00
Rp1,00 + -
-Rp200,00 to < Rp 500,00 Rp500,00 to < Rp2000,00
Rp5,00 + +
-Rp2000,00 to < Rp5000,00
≥ Rp5000,00 Rp25,00 + + +
Stock’s price 2 May 2016 (new tick size) Return Liquidity Volatility
<Rp200,00 Rp1,00 + +
-Rp200,00 to < Rp500,00 Rp5,00 - -
-Rp500,00 to < Rp2000,00 Rp10,00 - -
-Rp2000,00 to < Rp5000,00 Rp25,00 + -
-≥ Rp5000,00 Rp50,00 - + +
execution cost on the indonesia stock exchange. Asian Academy of Management Journal of Accounting and Finance, 8(1), 1–12. Retrieved from http://staff.ui.ac.id/system/files/users/irwan. adi/publication/kum_iae_penulis_utama-aamjaf_8-supp-2012_1-12.pdf
Lyons, R. (2000). The microstructure approach to exchange rates. Massachusetts: MIT Press Cambridge. O’hara, M. (1995). Market microstructure theory. Retrieved
from http://www.nhmnc.info/wp-content/uploads/ fbpdfs2014/Market-Microstructure-Theory-by-Maureen-OHara-Really-Nice-Book.pdf
Porter, D. C., Powell, G. E., & Weaver, D. G. (1996). Portfolio rebalancing, institutional ownership, and the small firm-January effect. Review of Financial Economics, 5(1), 19–29. http://doi.org/10.1016/ S1058-3300(96)90003-8
Pavabutr, P., & Prangwattananon, S. (2009). Tick size change on the stock exchange of Thailand. Review of Quantitative Finance and Accounting, 32(4), 351–371.
Purwoto, L., & Tandelilin, E. (2004). The impact of tick size reduction on liquidity. Gadjah Mada International Journal of Business, 6(2), 225–249.