A Computer Modeling of Fracture Based Pull-Out of Nylon 600
Embedded in Cementitious Matrix
Susilorini, M.I.R.1
Abstract: This paper reports the development of a computer model that represents a pull-out process of nylon 600 embedded in cementitious matrix. The model is based on fracture approach considering the Poisson’s effect and stable crack length. To back up the model four pull out tests of nylon 600 fiber, diameter 1.1 mm, with two fiber embedment lengths, 100 mm and 120 mm are done. The numerical approach is then compared to the experimental results. The computer model is built on Delphi 7 and named “Program Cabut-Serat Fraktur". This study shows that the computer model could represent the fracture phenomenon during the pull-out process.
Keywords: computer model, fracture, pull-out of nylon 600.
Introduction
A pull-out test is very useful to determine the properties of interfaces between fiber and cementitious matrices. The stress transfer takes an important role in determining the whole composites properties, selecting the main ingredients of composites, and predicting the failure of composite structure. An interesting phenomenon in pull-out problem is fracture phenomenon. Previous researches [1-10] have built various models to represent the pull-out process, unfortunately only few consider the Poisson’s effect in their model [9-10]. The Poisson’s effect is known as an important factor of synthetic fiber properties.
The fracture mechanics takes important role in fiber cementitious composites. The improvement of fiber cementitious composites such as fiber reinforced composites (FRC), high performance fiber-reinforced cementitious composites (HPFRCC), and engineered cementitious composites (ECC) engage synthetic fiber such as nylon. The fiber existence, through the interfaces between fiber and cementitious matrix, influence the whole fiber-reinforced cementitious composite performance. Nylon fibers in cementitious composites will improve strain-hardening property, tension strength, elastic modulus, and fracture parameter of J-integral [4,8,11,12]. Some researchers
1 Department of Civil Engineering, Faculty of Engineering,
Soegijapranata Catholic University, Semarang, Indonesia. Email: [email protected]; [email protected]
Note: Discussion is expected before November, 1st 2009, and will be published in the “Civil Engineering Dimension” volume 12, number 1, March 2010.
Received 4 December 2008; revised 11 May 2009; accepted 10 January 2009.
noted better performance of ECC by strengthening the synthetic fiber surfaces [6,7]. Other researchers found that the performance of nylon fiber is similar to steel performance [13], while other [14] noted higher compressive stress of concrete that contains gamma irradiated nylon fiber. Nylon fiber has a special characteristic of multiple constrictions at stretching condition called ‘yield point elongation’ [11-16] that has a magnitude of 200%-300% of the initial fiber length. This characteristic which is accompanied by its viscosity generates multiple constrictions appeared as ‘jagged’ phenomenon of stress-strain or load-displacement curves [11-16].
Broek [17] and Bazant [18] explained the main concept of failure analysis in fracture mechanics. According to Bazant [18], the failure of structure is related to strain-softening and strain-hardening condition due to crack distribution. The localized crack will propagate and develop to fracture and then failure. Therefore, it is necessary to reduce the possibility of fracture by increasing toughness and tension ductility. Such efforts can be done by applying fiber in the cementitious composites [19].
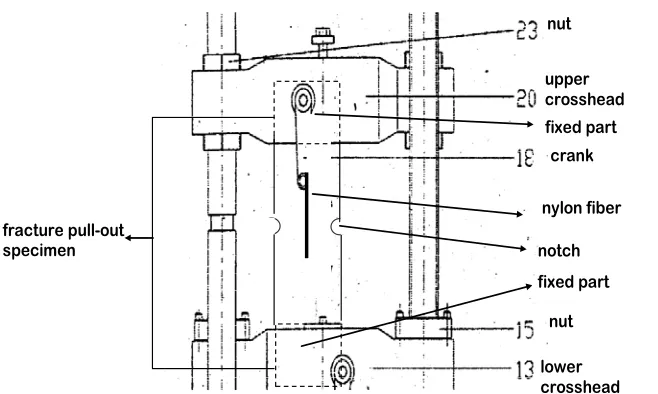
To support the computer modeling, four pull-out tests are performed. The pull-out test specimen is described in Figure 1 while the test set up is shown in Figure 2. The pull-out test is conducted using computerized Universal Testing Machine “Hung Ta”. The fiber used in this test is locally made nylon 600 fiber produced by Golden Fish, Indonesia, 1.1 mm in diameter and embedded length, lf , 100 and
120 mm. Mix design for the cementitious matrix is cement, sand, and water with a ratio of 1:1:0.6 in weight. The numerical method is conducted by modeling and formulating a theoretical model. The model and formulation is then used to build a program named “Program Cabut-Serat Fraktur” written on Delphi 7.
Results and Discussion Experimental Results
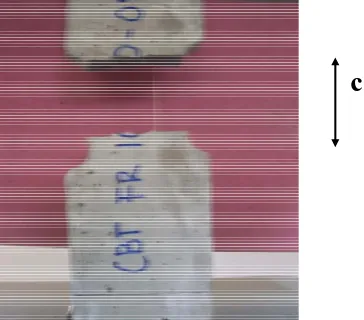
The experimental results show that all fiber (fiber length, lf, 100 and 120 mm) in the fracture pull-out
specimens are broken with some length of fiber left embedded inside the matrix. (Figure 3).
Figure 3. The broken fiber of fractured pull-out specimen
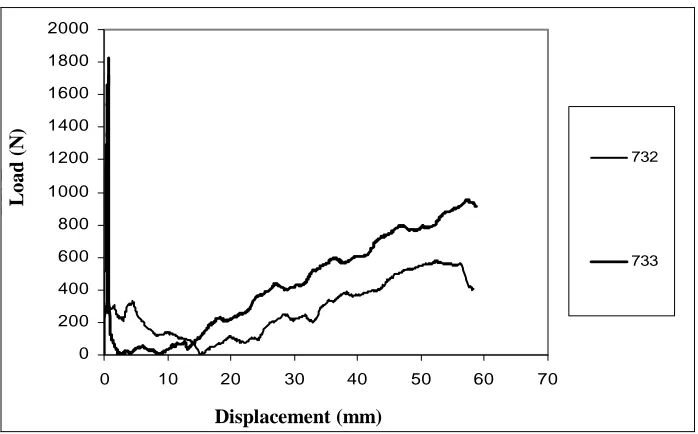
The loads and displacements achieved during the pull-out process are shown in Table 1 and 2 respectively. Fracture phenomenon during pull-out process is described in four stages, which are; pre-slip, pre-slip, transition, and strain hardening. The loads and displacements for each stage are presented in Table 1 and 2, columns (3) to (6) respectively.
Methods of Research
specimen width = 20 mm
70 mm
300 mm fixed part,
100 mm
Notch,
diameter = 10 mm fiber embedded length
(lf)
fixed part, 100 mm
Figure 1. Dimensions of Fracture Pull-Out Specimen
nylon fiber
notch
fixed part fixed part upper crosshead
lower crosshead
nut crank
fracture pull-out specimen
nut
Table1. Load achieved during the pull-out process Strain hardening (N)
100 CBT FR 10-4 (706) 1264.00 171.50 9.80 754.60
100 CBT FR 10-5 (730) 1318.00 127.00 8.08 779.10
120 CBT FR 12-1 (732) 1274.00 264.00 34.30 406.70
120 CBT FR 12-2 (733) 1822.00 107.80 19.60 911.40
Table 2. Displacement achieved during the pull-out process
(1) (2) Displacement Strain hardening (mm)
100 CBT FR 10-4 (706) 1.12 1.24 10.92 54.80
The stages which are found during pull-out process are also presented in Figure 4 and 5. The load-displacement (P-δ) relations in Figure 4 and 5 show that the curves consist of those four stages.
Theoretical modeling and formulation [13-14] The fracture pull-out model should represent the fracture phenomenon happening during the pull-out process. Several aspects are considered to get a comprehensive fracture pull-out model, they are: (1) Fracture capacity of embedded fiber is a function of Poisson’s ratio of fiber, (2) some stages exist during the fracture pull-out process, (3) a ‘jagged’ phenomenon exists on strain-hardening part of load-displacement (P-δ) and stress-strain (σ−ε) curves of pull-out, and (4) unstable and stable fracture process phenomenon exist during the fracture pull-out process.
lf l
1
Figure 6. Fracture pull-out specimen at instantaneous normal crack and lateral crack
It is proven that the fracture process on the fracture pull-out problem is similar to the pull-out problem [11,12]. At initial condition, the fiber is fully embedded in cementitious matrix during the elastic stage, when the fracture process is generated (Figure 6), the normal and lateral crack exist instantaneously, and then unstable fracture process being established (Figure 7). Later the unstable fracture process becomes stable to a crack width of c (Figure 7). At this time, the process will result in a displacement at the outer side of the separated specimen (Figure 8).
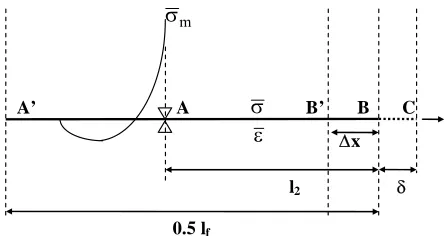
The model at elastic stage is described by Figure 8 showing half of the embedded fiber (A’B). The embedded fiber is assumed to be constrained at A and B. Free part of fiber at C belongs to the other part of the specimen. The length of embedded fiber is called lf. In this model, a displacement (not load) is
applied at C. Both cementitious matrix and fiber are still in composites condition.
c
Figure 7. Fracture pull-out specimen at specimen separation with crack width c
A B
Figure 8. Fracture pull-out model at elastic stage
Susilorini [11] noted that relation of matrix stress σm
and fiber strain εs can be expressed by:
time of crack, can be explained as:
β
According to Equation (1) and (2), the matrix stress
σm can be written as a function of Poisson’s ratio,
( )
ν
σ
=
σ
m mAt this elastic stage (Figure 8), the displacement δ will generate matrix stress σm. The value of matrix
stress σm will increase until
σ
m=
σ
m=
σ
m( )
ν
iscritical matrix stress
σ
m which also defined as bond capacity at the time of crack represents the ultimate fracture tension capacity.The strain and stress at BC (Figure 8) at the time of crack can be expressed as:
0
In elastic stage, displacement δ keeps growing while a crack is developing. This crack causes unstable fracture process. The unstable fracture process phenomenon will cause the constraint at B released (Figure 9). During the unstable fracture process, the crack length is growing until l2 is reach. At this time,
the constraint at A still move to the left side. When the crack length l2 is longer than embedded length lf,
then the fiber will be pulled-out.
A
Figure 9. Fracture pull-out model at unstable fracture process
Figure 10. Fracture pull-out model at stable fracture process
After the unstable fracture process, the fracture process will change into a stable one. A stable fracture process occurred when a crack arrester established. It can be explained as follows, assume that at first, a crack formed with a length of ∆x (Figure 10). When displacement δ increase, the strain ε1 and stress σ1 at B’B will also increase. Those
strain ε1 and stress σ1 will reach critical values
(critical matrix stress
σ
m and strainε
). Later, thedisplacement δ will simultaneously repeated at B’. Another new crack length of ∆x will be formed at the left side of the fiber. It happens until the constraint A is fixed. In this condition, the constraint A becomes ‘crack arrester’ which prevents crack growth.. The crack stops growing and crack length remains l2.
Once the stable crack length l2 is achieved, the strain
at l0 part is transferred to l2 part. The stress and the strain at AC will be equal to the critical strain,
ε
=
ε
. Thus the displacement is also equal to the critical displacement,δ
=
δ
. Hence, the strain can be expressed by:2
The stable crack can be formulated as:
ε
The model has been explained in the previous paragraphs and is formulated in Equation 11.
⎟⎟⎠
Epr = modulus of elasticity at stage of
strain-hardening (MPa)
Eps = modulus of elasticity at stage of pre-slip (MPa)
Es = modulus of elasticity at stage of slip (MPa)
Etr = modulus of elasticity at stage of transition
a2 = initial length of specimen or fiber that is
specific for every stage (mm)
r∆I = ratio of total free-end fiber displacement of
free-end at stage of pre-slip
r∆II = ratio of total free-end fiber displacement of
free-end at stage of slip
r∆III = ratio of total free-end fiber displacement of
free-end at stage of strain-hardening
The formulation that is expressed in equation 11 is supported by the values of Es, Eps, Etr, and Epr, which
are based on the experimental result (Table 3). These modulus of elasticity values are specific for each stage.
Table 3. Value of Es, Eps, Etr, and Epr for Fracture Pull-Out
Model
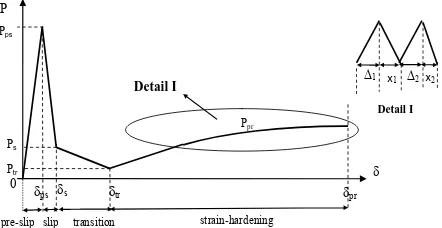
Figure 11 shows the curve of P-δ (load-displacement) which is obtained from Equation 11. This curve represents 4 (four) stages: (a) Stage of pre-slip, (b) Stage of slip, (c) Stage of transition, and (d) Stage of strain-hardening
P
Pps
δ
pre-slip transition strain-hardening
Ps
Figure 11. The load-displacement (P-δ) relation of pull-out process
The fracture phenomenon that happens in four stages during pull-out process can be explained as follows. At initial stage and stage of pre-slip, the fiber is fully embedded in the cementitious matrix. The fracture process phenomenon has not happen yet. After critical matrix stress
σ
m is exceeded, a crack is present. At this time, the stage of slip happens and then unstable fracture process begins. The normal fracture occurs between the two notches and separates the specimen. After the normal fracture exist, the lateral fracture established at the time of specimen separation. These normal and lateral fractures happen instantaneously. Then the unstable fracture process will change into stable fracture process. The stable fracture process occurs when the stable crack length is reached. Whenever the stable crack length is achieved, the crack length remains l2. This stable crack length may be achievedat the end of the slip stage or at the transition stage.
It should be noted that the stable fracture process will initiate the stage of strain-hardening with ‘jagged’ phenomenon (Detail I of Figure 11). During the stage of strain-hardening, the increase of strain
ε will increased the stress σ along the fiber. It may happen until the fiber is broken.
Computer modeling
Figure 12. The opening interface of the program
The computer modeling aims to reach a faster, accurate, and efficient modeling of fractured pull-out. It is built on Delphi 7 with reference to the experimental results. The program, named “Program Cabut-Serat Fraktur” (Figure 12), can be described by flowchart as follow (Figure 13). Some notations that in the flowchart can be explained as follow. Am = matrix section area (mm2)
stage of strain-hardening (mm)
∆ps,v = displacement of right end specimen at
stage of pre-slip (mm)
∆s,
δ
ps = displacement of right end specimen atstage of slip (mm)
δ
ult = ultimate displacement (mm)εn = strain of fiber at step n
εpr = strain of fiber at stage of strain-hardening
εps = strain of fiber at stage of pre-slip
εs = strain of fiber at stage of slip
εtr = strain of fiber at stage of transition
σn = stress of fiber at step n (MPa)
σpr = stress of fiber at stage of strain-hardening
(MPa)
σps = stress of fiber at stage of pre-slip (MPa)
σs = stress of fiber at stage of slip (MPa)
START
INPUT
lf, l0, Pult, δult,
δ
,ε
COMPUTE l2, A, Am
STAGE OF PRE-SLIP INPUT
∆ps, Eps
∆ps ~ range?
Eps ~ range?
YES
NO
COMPUTE
δps, Pps, εps, σps
STAGE OF SLIP INPUT
∆s, Es
∆s ~ range?
Es ~ range?
YES
NO
COMPUTE
δps, Pps, εps, σps
A
0 < lf < 100
WITHOUT TRANSITION WITH TRANSITION
YES
NO
STAGE OF TRANSITION INPUT
xn, En
xn~ range?
En~ range?
YES
NO
COMPUTE
δn, Pn, εn, σn
Pn> Pult
δn> δult
STAGE OF STRAIN-HARDENING
INPUT
∆n,xn+1, En
∆n ~ range?
xn+1~ range?
En ~ range?
YES
NO YES
B STAGE OF
STRAIN-HARDENING INPUT
∆n,xn+1, En
∆n ~ range?
xn+1~ range?
En ~ range?
YES
NO
COMPUTER
δn, Pn, εn, σn
Pn > Pult
δn > δult
SAVE:
FILE TEXT & TABLE PLOTTING CURVE :
P-δ & σ−ε
FINISH
COMPUTE
δn, Pn, εn, σn
Pn> Pult δn> δult
B
SAVE:
FILE TEXT & TABLE PLOTTING CURVE :
P-δ & σ−ε
FINISH
C
Figure 13. Flowchart of the “Program Cabut-Serat Fraktur”
0 200 400 600 800 1000 1200 1400 1600
0 10 20 30 40 50 60
DISPLACEMENT (mm)
LO
A
D
(N
)
706
730
VALIDATION
MODEL
Displacement (mm)
Loa
d
(
N
)
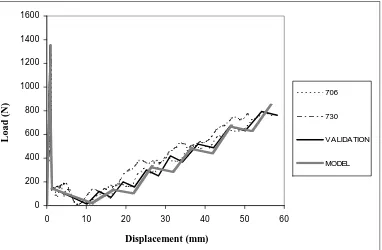
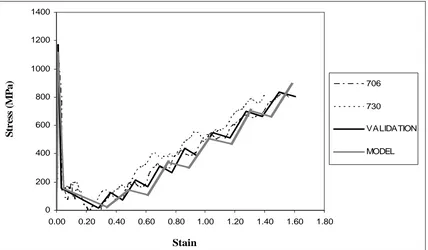
For the next step, the “Program Cabut-Serat Fraktur” will be validated to prove its performance. For representation, the fiber embedded length of lf =
100 mm is being validated. The validation shows that the theoretical model fits to experimental result as shown in Figure 14 and 15. Therefore, the fractured based pull-out model of nylon 600 can represent the fracture phenomenon during the pull-out process.
Conclusions
The research concludes:
a. The computer model represents a pull-out process of nylon 600 process based on fracture approach considering the Poisson’s effect and stable crack length.
b. The computer model of “Program Cabut-Serat
Fraktur” represents the fracture phenomenon
during the pull-out process, that is four stages of initial pre-slip, slip, transition, and strain hardening.
c. The “Program Cabut-Serat Fraktur” conducts a faster, accurate and efficient modeling of fractured pull-out.
Acknowledgement
The Author acknowledges Yayasan Sandjojo and UBCHEA (United Board of Higher Christian Education) for supporting the research grant (2005-2007). The Author is also indebted to her Promotor, Prof. Ir. Moh. Sahari Besari, MSc., PhD., and Co-Promotor, Prof. Bambang Suryoatmono, PhD., for
their great contributions of ideas, discussions, and intensive assistance during her Doctoral Study at Parahyangan Catholic University (2003-2007). The research has encouraged her to improve fracture mechanics and fiber cementitious composites topics.
References
1. Wang, Y., Li, V.C., Backer, S., Analysis of Synthetic Fiber Pull-out from a Cement Matrix, (eds. Mindess, S., Shah, S.P), Proceedings of Material Research Society Symposium, Vol. 114, 1986, pp. 159-165.
2. Wang, Y., Li, V.C., Backer, S., Modeling of Fibre Pull-out from a Cement Matrix, The International Journal of Cement Composites and Lightweight Concrete, Vol. 10, No. 3, 1988, pp. 143-149.
3. Wang, Y., Li, V.C., Backer, S., Effect of Fiber-Matrix Bond Strength on the Crack Resistant of Synthetic Reinforced Cementitious Composites, (eds. Mindess, S., Shah, S.P), Proceedings of Material Research Society Symposium, Pittsburgh, 1988, pp. 167-173.
4. Morisson, J.K., Shah, S.P., Jenq, Y.S., Analysis of Fiber Debonding and Pull-out in Composites,
Journal of Engineering Mechanics, ASCE, Vol.
114, No. 2, February, 1988, pp. 277-294.
5. Li, V.C. and Chan, Y.W., Determination of Interfacial Debond Mode for Fiber Reinforced Cementitious Composites, Journal of Engineering Mechanics, ASCE, Vol. 120, No. 4, April, 1994, pp. 707-719.
0.00 0.20 0.40 0.60 0.80 1.00 1.20 1.40 1.60 1.80
STRAIN
6. Li, V.C., Chan, Y.W., Wu, H.C., Interface Strengthening Mechanism in Polymeric Fiber Reinforced Cementitious Composites, Proceedings of International Symposium on Brittle Matrix Composites, (eds. Brandt, A.M, Li, V.C., Marshall, L.H), IKE and Woodhead Publ, Warsaw, 1994, pp. 7-16.
7. Li, V.C. and Stang, H., Interface Property Characterization and Strengthening Mechanism in Fiber Reinforced Cement Based Composites, (Review Arcticle), Journal of Advanced Cement Based Materials, Vol. 6, 1997, pp. 1-20.
8. Sumitro, S. and Tsubaki, T., Microfractural Pullout Model of Steel Fiber Reinforced Concrete”, Proceedings Framcos-3, AEDIFICATIO Publishers, Freiburg, Germany, 1988, -.
9. Naaman, AE., Namur, GG., Alwan, JM., Najm, HS., Fiber Pull-out and Bond Slip. I: Analytical Study, Journal of Structural Engineering, Vol. 117, No. 9, 1991, pp. 2769-2790
10. Bentur, A., Wu, S.T., Banthia, N., Baggott, R., Hansen, W., Katz, W., Leung, C.K.Y, Li, V.C., Mobasher, B., Naaman, A.E., Robertson, R., Soroushian, P., Stang, H., Taerwe, L.R., Fiber-Matrix Interfaces, High Performance Fiber Reinforced Cement Composites 2, (eds. Naaman, A.E., Reindhardt, H.W.), E&FN Spons, London, 1996, pp. 149-191.
11. Susilorini, R.M.I., Model Masalah Cabut-Serat Nylon 600 Tertanam dalam Matriks Sementitis
yang Mengalami Fraktur, Dissertation,
Parahyangan Catholic University, Bandung, 2007.
12. Susilorini, R.M.I., Integral-J Kritis untuk Model Elemen Hingga pada Cabut Serat Fraktur
Nylon 600, Proceedings of National Seminar Tiga Roda Forum “Perkembangan Terkini Teknologi dan Rekayasa Konstruksi Beton di Indonesia”, Jakarta, 2007, pp.1-14.
13. Fischer, G., and Li, V. C., Effect of Fiber Reinforcement on the Response of Structural Members, Proceedings Framcos-5, (eds. Li, et. al). Ia-Framcos, 2004, pp. 831-838.
14. Martinez-Barrera, G., Concrete Reinforce with Irradiated Nylon Fibers, Journal of Material Research, Vol.21, No. 2, February, 2006, pp. 484-491.
15. Nadai, A., Theory of Flow and Fracture of Solids, Volume I, McGraw-Hill Company. Inc, New York, USA, 1950.
16. Avarett, R.D, Fracture Mechanics of High
Performance Nylon Fibers, Thesis, Georgia
Institute of Technology, USA, 2004.
17. Broek, D., Elementary Engineering Fracture
Mechanics, Martinus Nijhoff Publishers, The
Hague, Boston, London, 1982.
18. Bazant, Z.P., Fracture Mechanics of Concrete: Concepts, Models, and Determination of Material Properties – State of the Art Report,
Proceedings, First International Conference on Facture Mechanics Concrete Structure (Framcos 1), (Ed. Bazant, ZP), Colorado, USA, 1992, pp.6-140