J.Food Pharm.Sci. 1 (2013) 43-48
Avalaible online at www. jfoodpharmsci.com
Research Article
Analysis of Melamine Using Electronic Nose, Gas Chromatography
-
Time of
Flight
-
Mass Spectrometry and High Performance Liquid Chromatography
Abdul Rohman
1,2*, Y. B. Che Man
1, R. M. Hafidz
1, N. N. Juliana
1and C. S. Tong
11Halal Products Research Institute, Universiti Putra Malaysia, 43400 UPM, Serdang, Selangor, Malaysia
2Department of Pharmaceutical Chemistry, Faculty of Pharmacy, Gadjah Mada University, Yogyakarta 55281, Indonesia
ARTICLE INFO
ABSTRACT
Received 02/02/2012
Received in revised form 20/02/2012 Accepted 15/04/2012
Available online 21/04/2012
1. Introduction
Melamine is a nitrogen-containing compound (Figure 1) used in the manufacture of plastics, in the production of melamine-formaldehyde resins for surface coatings, laminates, and adhesives, and in the production of flame retardants; it is also used as a fertilizer. Melamine is a metabolite of cyromazine, an approved insecticide used on a broad range of vegetable crops (EFSA, 2007). Nowadays, melamine has been illegally added in milk and milk products to enhance its nitrogen content.
N
N N NH2
NH2
H2N
Fig 1. Chemical structure of melamine
The concern over melamine adulteration spreads to include a number of different types of dry protein materials in both animal and human-food sources. High
visibility and the potential public-health threat prompted the U.S. Food and Drug Administration (FDA) and scientist to rapidly issue a standard test method for the analysis of melamine in protein materials. The presence of 1.0 ppm of melamine in infant formula and 2.5 ppm of melamine in other food products containing milk and milk derived ingredients renders the product adulterated and illegal to be sold (WHO, 2008; Neal-Kababick and Goodman, 2007). Melamine is not metabolized and is rapidly eliminated in the urine with a half life in plasma of around 3 hour (OECD, 1998). Health effects from exposure to melamine vary depending on the amount and duration of exposure. However, significant exposure can lead to bladder stone, which, in turn, may result in kidney failure and, in some rare cases. Melamine is a non-protein rich and inexpensive nitrogen source that can falsely elevate protein content measurements using a classical Kjeldahl method.
Melamine verification is becoming a necessity in the food industry in order to verify the quantity and authenticity of protein, besides to ensure the food safety and to protect consumers especially Muslim from fraud and deception. Several analytical methods have An electronic nose (E-Nose) has been used as rapid analytical technique for melamine detection in food samples. The parameter used is melamine retention index (MRI) in E-Nose chromatogram. The value of MRI was also confirmed using two dimensional gas chromatography-time of flight-mass spectrometry (GCxGC-TOF-MS). The value of MRI using E-Nose and GCxGC-TOF-MS was nearly close i.e 1486 and 1540 respectively. HPLC has been used for quantitative analysis of melamine in some milk products suspected to contain melamine using column Nova-Pak® C18;(150 x 3.9 mm i.d; 4 µm) at 30°C. The mobile phase
was 5 mmol L−1 NaH
2PO4 delivered isocratically at flow rate of 1 mLmin-1. Melamine was
linear at concentration range of 0.0625 – 50.0 µg/ml with coefficient of determination (R2) of 0.999.
Keywords: Melamine,electronic nose, GC x GC-TOF-MS, HPLC, food
*Corresponding author:
used for melamine analysis such as spectroscopic-based techniques of UV-Vis (Liu et al., 2011), mass spectrometry (Vaclavik et al., 2010), photoluminescence (Serdiuk et al., 2010), high performance liquid chromatography using UV-Vis detector (Ehling et al., 2007; Muñiz-Valencia et al., 2008), liquid chromatography in combination with mass spectrometry (LC-MS) (Lutter et al., 2011), micellar electrokinetic chromatography (Tsai et al., 2009), micellar electrokinetic capillary chromatography with amperometric detection (Wang et al., 2010), zone electrophoresis–mass spectrometry (Thanh Vo et al., 2008), capillary zone electrophoresis (Xia et al., 2010), and flow injection analysis based on chemiluminescence system (Zeng et al., 2011). Most of these techniques are laborious and are involving toxic and hazardous reagents; therefore, new and more safe techniques such as electronic nose was proposed.
The objective of this article is to describe the qualitative analysis of melamine using E-Nose and its confirmation of melamine retention index (MRI) in E-nose was accomplished using GC-TOF MS using a series of alkane homologs. Quantitative analysis of melamine was performed using HPLC with photodiode array (PDA) detector at optimized wavelength.
2. Materials and Methods
Melamine standard were purchased from Sigma Aldrich (St. Louis, MO, USA). Food samples were obtained from local and supermarket around Serdang, Selangor Malaysia. All analytical reagents and solvents used were bought from E. Merck (Darmstadt, Germany).
2.1. Analysis Using E-Nose
2.1.1.The Electronic nose apparatus
The electronic nose (7100 vapor analysis system, Electronic Sensor Technology, New Bury Park, USA) is manufactured in a portable bench top enclosure for field laboratories or fixed on-line installations. The zNose™ is based upon well known principles of gas chromatography and a new type of GC detector using a high frequency quartz controlled crystal oscillator with time piece stability and accuracy. This electronic nose uses a single, uncoated, high quartz SAW sensor. The SAW crystal consists of an uncoated 500 MHz acoustic interferometer or resonator bonded to a Peltier thermoelectric heat pump with the ability to heat or cool the quartz crystal. This detector possesses advantages, such as high sensitivity, easy-to handle signal, low power and long term stability.
2.1.2.Electronic nose analysis
Two grams of food sample was weighed into 40 ml glass vials, sealed with septa and screw caps, and incubated at 70 °C and 80 °C for 15 min for headspace
equlibration above the sample. Sample’s vapor were
then pumped over the sensors of electronic nose for 5 collection of ambient vapours for analysis in the second step. In the second step, the trap is rapidly heated and released vapours are re-focussed on the head of the relatively low temperature (40°C) capillary column. This system is based on the principal of gas chromatography. The column temperature was programmed from 40 to 180 °C, at a rate of 3°C/s to follow a linear rise to its maximum temperature, causing the different chemical component in the sample to be released, travel through the column, and land on the surface of the SAW crystal temperature controlled at 40°C. The flow rate purified helium was fixed at 3.0 mL/min.
2.2. Analysis of Melamine using GC-TOF-MS
Melamine authentic standard was dissolved in acetonitrile-water solution (85: 15 % v/v) prior to GC-TOFMS analysis without further chemical derivatization. Retention indices of such compound was determined using Agilent model 6890N gas chromatograph coupled to Leco Pegasus 4D Time-of-Flight mass spectrometer with 2 different capillary columns namely DB-5ms and DB-17ms (both 30 m x 0.25 mm x 0.25 um) of apolar and moderate polar behaviors, respectively. Helium gas with 99.9999% purity was operated at 1.5 ml/min constant flow rate, while injection was performed under splitless mode at 350oC. The GC oven was programmed at 120 oC initially, hold for 1 minute and then was ramped to 300oC at the rate of 10oC/min and finally hold for 10 minute. TOFMS was linked to GC through a transfer line maintained at 280oC. Electron ionization condition was set at 230 oC and -70 eV, while the mass scan was ranged from 40 to 450 amu under 20 spectral per second and 1550 V detector voltage. The relationship plot of carbon chain length (x-axis) and retention times (y-axis) of alkane series in GC-TOFMS analysis was constructed and retention index of melamine (MRI) was determined accordingly.
2.3. Quantitative analysis of melamine using HPLC 2.3.1.Chromatographic condition
The chromatographic system consisted of a Waters equipped with online degasser and a multi-wavelength photodiode-array detector (DAD) covering the range 190–600 nm which was interfaced to a computer for data acquisition. For melamine analysis, PDA detector was set at 220 nm. An autosampler was used in this system. A column used was Nova-Pak® C18; 4 mikron; 3.9 x 150 mm and its temperature was kept at 30°C. The mobile phases were prepared daily from 5 mmol L−1 NaH2PO4 aqueous solution adjusted to pH 5.0 with
orthophosporic acid and delivered isocratically at flow
2.3.2.Calibration curve
A-10 mg of melamine was accurately weighted using analytical balance, and transferred to 10 mL volumetric flask. A series of standard was prepared by serial dilutions such some solutions with concentrations of 50.0; 40.0; 30.0; 20.0; 10.0; 5.0; 2.5; 1.0; 0.5; 0.25; 0.125; and 0.0625 were obtained. These solutions were filtered using A-Nylon 0.45 µ filter and injected in LC system.
2.3.3.Sample preparation
Sample preparation was prepared according to Muniz-Valencia et al (2008). A homogenized food sample (1 g) was accurately weighed (precision 0.1 mg). The samples were leached by sonication with 100 mL 5 mmol L−1 sodium phosphate (pH 5.0) for 20 min at 25 °C. About 5.0 ml of the extract was filtered through a 0.45-μm pore
size Nylon filter. Finally, 20 μL of the filtered extract was
injected in the LC system.
3. Results and Discussion
3.1. Analysis Using Electronic nose (E-Nose)
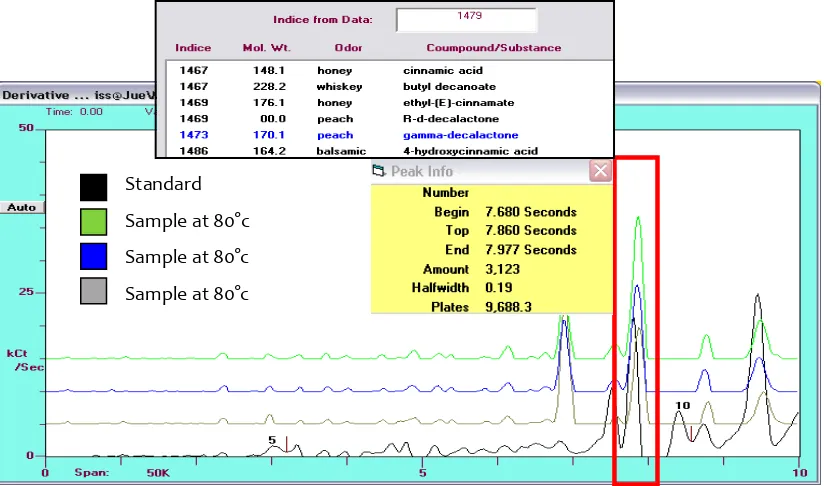
The chromatogram from the electronic nose is a
graphical display of the derivative of the frequency change versus time. The peak area was correlated with the compound concentration and was expressed in counts (cts). The zNoseTM chromatograms of pure Melamine (standard, 1040 ppm) and the food samples with the waterbath heat treatment at 80°C are characteristically similar (Figure 2).
Principal component analysis (PCA) was used to structure the data matrix. PCA as an unsupervised classification method to visualize the resemblance and the difference among the different measurement in the data sets. The samples were separated along the first PC described 100 % of the peak variation and showed three defined groups. It can be observed that three distinct groups, which are correspond to Melamine (standard), food sample with water bath heat treatment (70 °C) and food sample with heat treatment (80 °C), respectively, distinguished. Melamine (standard) and food sample with water bath heat treatment (80 °C) got high positive scores along PC1. This percentage seemed sufficient to define a good model, especially for qualitative purpose (Figure 3).
Fig 2. Chromatogram of melamine standard (stock solution, 1040 ppm) and waterfall of sample (rabbit candy-triplicate).
Fig 3. Principal component analysis of the electronic nose data Standard
Sample at 80°c
Sample at 80°c
3.2. Analysis using GC-MS-TOF
The peak used as a marker for melamine identification using E-Nose was confirmed by evaluating
the melamine’s retention index MR) according to a
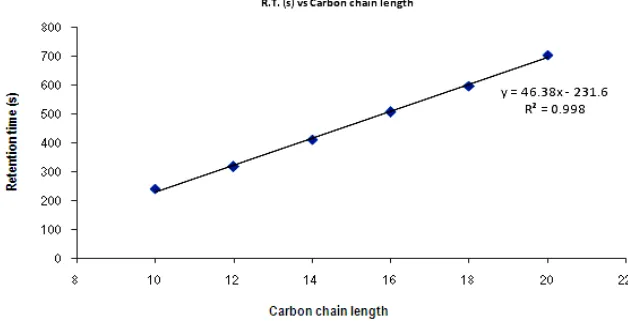
series injection of n-alkanes into GC-TOFMS. Figure 4 and 5 showed chromatogram of n-alkane series (C10; C12; C14;
C16; C18; C20 and C22) together with melamine compound
that analyzed by GC-TOFMS using 2 columns with different polarities. A relationship between carbon chain length (x-axis) and its retention time (y-axis) was shown in Figure 6.
Within the concentration that ranged from 1 to 100 µg/ml,retention indices of Melamine (MRI) were found to be 1557 ± 15 and 2013 ± 15 under apolar (DB-5ms) and polar (DB-17ms) colums, respectively. The value of MRI obtained using GC-MS-TOF with apolar column was similar to MRI obtained from E-Nose. Therefore, it was anticipated that the peak used as the marker identification of melamine in E-Nose would be appropriate.
Fig 4. Reconstruct ion chromatogram of alkanes (C10; C12; C14; C16; C18; and C20) and melamine using DB-5ms column.
Melamine has a retention time of 483.05s
Fig 5. Reconstruct ion chromatogram of alkanes (C18; C20; and C22) and melamine using DB-17ms column. Melamine
has a retention time of 1035 s.
3.3. Quantitative analysis of Melamine using HPLC Melamine is a small and highly polar molecule. Liquid chromatography using a reversed column Nova-Pak® C18 and polar mobile phase 5 mmol L−1 NaH2PO4
aqueous solution adjusted to pH 5.0 with
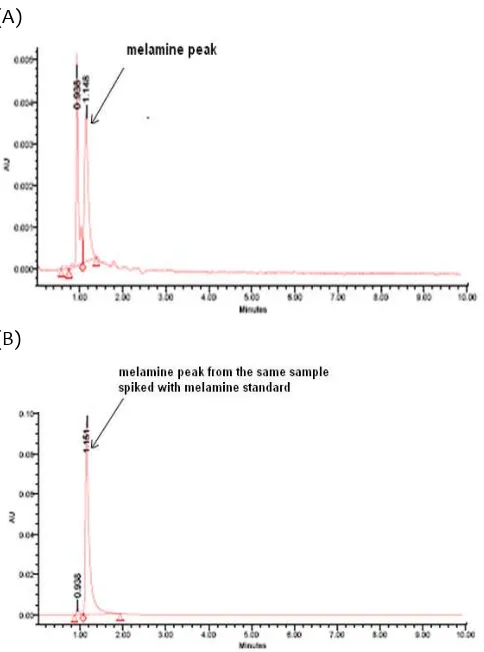
ortho-phosporic acid was used for quantitative analysis of melamine. Under the specified conditions of use, melamine was well retained with retention time of 1.143 min.
A linear regression for relationship between melamine concentrations (x) versus its peak heights (y) revealed a good relationship with correlation coefficient of 0.999. The equation obtained is 4920.0x + 2353, and is further used to quantify the melamine content in some food samples. Melamine was linear over the concentration range from 0.0625 – 50.0 µg/ml.
(A)
(B)
Fig 7. (A) Chromatogram of food samples containing melamine. For conditions, see chromatographic conditions; (B) chromatogram of the same sample spiked with melamine standard showing an increase in peak height.
Table 1. Melamine content of some milk products.
Sample Melamine concentration (µg/g) shown in Figure 7.A. This sample was subject to contain a melamine because of the presence of peak corresponding to standard melamine peak at retention time of 1.143 min. For confirmation purpose, the same
sample was spiked with melamine standard and its chromatogram revealed an increase in peak height (Figure 7.B.) A number of 4 samples were tested for its melamine contents and its results were shown in Table 1.
4. Conclusion
This study has demonstrated the ability of the electronic nose to efficiently decrease the time needed for screening (within 10 seconds) the melamine in food samples based on its retention index. Melamine retention index (MRI) was also confirmed using gas chromatography-time of flight-mass spectrometry (GC-TOFMS). HPLC was used as quantitative analysis technique for melamine determination.
References
European Food Safety Authority (EFSA). www.efsa.europa.eu. Question N° EFSA-Q-2007–093.
WHO. Melamine and cyanuric acid: toxicity, preliminary risk assessment and guidance on levels in food, 2008, retrieved from http://www.who.int/ foodsafety /fs_management/Melamine., 5th November 2008
Neal-Kababick and Goodman, Screening for Melamine Adulteration in Protein-Based Foods by GC/MS, 2007, retrieved from http://www.perkinelmer.com/Content/ applicationnotes/app_melamineadulterationscreeninginf oodsgcms.pdf, 6th November 2008.
OECD Screening Information Data Set for Melamine. CAS No. #108-78-1. 1998. Retrieved from http://www.chem. unep.ch/irptc/sids/OECDSIDS/108781, 7th November 2008. Liu, Y.; Deng, J.; An, L.; Liang, J.; Chen, F.; and H. Wang.
Spectrophotometric determination of melamine in milk by rank annihilation factor analysis based on pH gradual change-UV spectral data. Food Chem. 2011, 126, 745-750. Vaclavik, L.; Rosmus, J.; Popping, B.; and Hajslova. J. Rapid
determination of melamin and cyanuric acid in milk powder using direct analysis in real time-time-of-flight spectrometry. J. Chromatogr. A. 2010, 1217, 4204-4211. Serdiuk, T.; Skryshevsky, V.A.; Phaner-Goutorbe, M.; and
Souteyrand, E. Monitoring of melamine contamination in fat watery milk by the photoluminescence analysis.
Talanta. 2010, 82, 1543-1547.
Ehling, S.; Tefera, S.; and Ho, I.P. High performance liquid chromatographic method for simultaneous detection od the dulteration of cereal flours with melamine and related triazine by products ammeline, ammelide, and cyanuric acid. Food Addit. Contam. Part A. 2007, 24, 1319– 1325.
Muñiz-Valencia, R.; Ceballos-Magaña, S.G.; Rosales-Martinez, D.; Gonzalo-Lumbreras, R.; Santos-Montes, A.; Cubedo-Fernandez-Trapiella, A.; and Izquierdo-Hornillos, R.C. Method development and validation for melamine and its derivatives in rice concentrates by liquid chromatography. Application to animal feed samples.
Anal. Bioanal. Chem.2008, 392, 523–531.
Tsai, I-L.; Sun, S-W.; Liao, H-W.; Lin, S-C.; and C-H. Kuo. Rapid analysis of melamine in infant formula by sweeping-micellar electrokinetic chromatography. J. Chromatogr. A.2009, 1216, 8296-8303.
Wang, J.; Jiang, L.; Chu, Q.; and Ye, J. Residue analysis of melamine in milk products by micellar electrokinetic capillary chromatography with amperometric detection.
Food Chem. 2010, 121, 215-219.
Thanh Vo, T.D.; Himmelsbach, M.; Haunschmidt, M.; Buchberger, W.; Schwarzinger, C.; and Klampfl, C.W.. Improved analysis of melamine–formaldehyde resins by capillary zone electrophoresis–mass spectrometry using ion-trap and quadrupole-time-of-flight mass spectrometers. J. Chromatogr. A.2008, 1213, 83-87. Xia, J.; Zhou, N.; Liu, Y.; Chen, B.; Wu, Y.; and Yao, S..
Simultaneous determination of melamine and related compounds by capillary zone electrophoresis. Food Control. 2010, 21, 912-918.