IC™ Value: 3.00 CODEN: IJESS7
IJESRT
INTERNATIONAL JOURNAL OF ENGINEERING SCIENCES & RESEARCH
TECHNOLOGY
ANALYSIS OF INVENTORY MANAGEMENT IN A SUPPLY CHAIN BY USING
ECONOMIC ORDER QUANTITY (EOQ) MODEL
Ashok Singh Sunhal*1 & Dharamvir Mangal2
*1Research Scholar, Mechanical Engineering Department, Sunrise University, Alwar (Rajasthan) India
2Director, Geeta Institute of Management and Technology, Kurukshetra, Kurukshetra University,
Kurukshetra, (Haryana) India
DOI: 10.5281/zenodo.1012527
ABSTRACT
The management of supply chain and the role and responsibilities of various persons involved varies from industry to industry. Due to which supply chain management has become a vital issue for manufacturing organizations, professionals and researchers. The ultimate aim of supply chain management is to satisfy the customer at optimum cost. Due to globalization, liberalization and advancement in new technologies supply chain has become more complex, more global and a more critical business function than ever before.
In this work EOQ is determined by the junction of Ordering Cost curve and carrying Cost line. This work is a case study in optimal inventory control, applied to B Brown Medical India Pvt. Ltd. This company manufactures IV sets and sutures, right heart catheters, and chip products
KEYWORDS: Supply chain management; Inventory control; Economic order Quantity.
I. INTRODUCTION
Inventory management and supply chain management are the spinal column of any business operations. Ambitious software applications, inventory management has undergone radical changes with the expansion of technology and availability of process. Inventory control has a problem of the most important in organizational management. The performance of a supply chain is characterized by its ability to remain market-sensitive without losing the integration through the chain. One of the difficulties in designing and analyzing a supply chain is that its processes are governed by the strategic attributes of the supply chain. With the emergence of a business era that embraces change as one of its major characteristics, manufacturing success and survival are becoming more and more difficult to ensure. The emphasis is on adaptability to changes in the business environment and on addressing market and customer needs proactively.
The following are five basic components of SCM.
Plan – This is the strategic portion of SCM. You need a strategy for managing all the resources that go toward meeting customer demand for your product or service. A big piece of planning is developing a set of metrics to monitor the supply chain so that it is efficient, costs less and delivers high quality and value to customers.
Source – Choose the suppliers that will deliver the goods and services you need to create your product. Develop a set of pricing, delivery and payment processes with suppliers and create metrics for monitoring and improving the relationships. And put together processes for managing the inventory of goods and services you receive from suppliers, including receiving shipments, verifying them, transferring them to your manufacturing facilities and authorizing supplier payments.
IC™ Value: 3.00 CODEN: IJESS7 Deliver – This is the part that many insiders refer to as logistics. Coordinate the receipt of orders from customers, develop a network of warehouses, pick carriers to get products to customers and set up an invoicing system to receive payments.
Return – The problem part of the supply chain. Create a network for receiving defective and excess products back from customers and supporting customers who have problems with delivered products.
In the current competitive industries supply chains are becoming more important, and competition is seen to
take place between supply chains rather than between firms. Supply Chain Management (SCM) is a concept of
management with the function of managing the dissimilar aspects of supply chains.
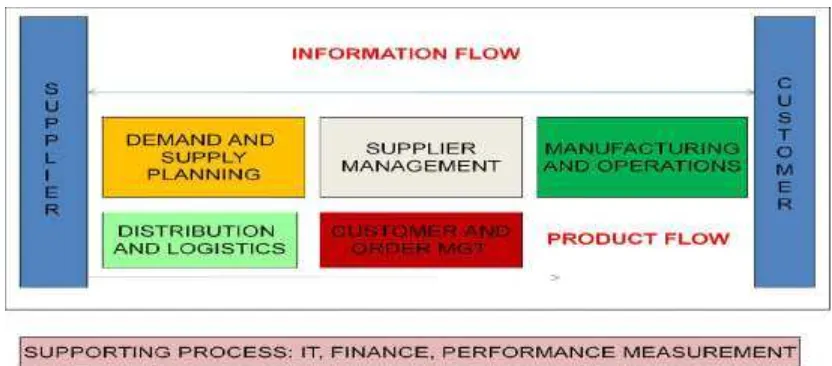
In principle a Supply Chain can be look like the figure given below:
Fig 1.1Supply Chain Management Cycle
Supply Chain Management is as mentioned before a wide management concept. It includes managing the supply chain as a whole by coordinating activities and resources to improve efficiency as well as gain and sustain competitive advantage in highly demanding markets. This emphasizes the crucial idea of SCM; looking at processes across company limits to increase value creation in the whole supply chain. The outsourcing of activities and division of production steps among several companies are aspects of modern organizations that make SCM more important and more challenging.
On one hand Twenty-first century offered opulence of costumers by opening new markets and on the other hand this opened Pandora’s box of unidentifiable situations and new problems to be encountered by producing new vistas for the industries, production houses, entrepreneurs, business stakeholders through which they are destined to sail through if they are really committed to scale success beyond the visible horizons. Adaptation of effective strategies of an efficient supply chain management can help any firm or industry in enhancing competitiveness level as the firm’s competitive strategy defines the set of customer demands that it seeks to satisfy through its products and services. The ultimate objective of SCM is to achieve a ‘strategic fit’ between the company’s competitive strategy and supply-chain strategy.
Economic Order Quantity (EOQ) has been a well-known formula that calculates the most favorable economic Order quantity. Engineers study the EOQ formula in engineering economics and industrial engineering courses. On the other hand, business discipline studies the EOQ in both operational and financial courses. In both, EOQ formulas have practical and exact applications in defining concepts of Cost tradeoffs; as well as specific application in inventory.
IC™ Value: 3.00 CODEN: IJESS7 minimize the total Costs of inventory such as holding Costs, Order Costs, and inventory Cost. In inventory management, economic Order quantity (EOQ) is the Order quantity that minimizes the Order Quantity, Ordering Cost, Number of Orders, Total Annual Cost, Carrying Cost, Order Size and Average Inventory. Simplicity and precautionary modeling assumptions usually go together, and the EOQ model is not an exception. The purpose of this model is to decide order quantity and reorder point. This research goes throughout the process of analyze the company’s current forecasting model and recommends an inventory control model. Order Quantity and Reorder Point was recommended to reduce product inventory. In this work a case study has been done for optimal inventory control, applied to B Brown Medical India Pvt. Ltd. Researcher analyzes a single product inventory in which cyclic review of inventory control, where separate unsystematic demand may be satisfied. A numerical study is provided to add insight into the results.
II. LITERATURE SURVEY
The concept of SCM has been considered from different points of view in different bodies of literature (Croom et al., 2000) such as purchasing and supply management, logistics and transport, operations management, marketing, structural theory, and management information systems. As Mentzer et al. (2001) said, a supply chain will exist whether a firm actively manages it or not. SCM is a discipline in the early stages of evolution (Gibson, Mentzer, & Cook, 2005). SCM gives a concrete form to the so called “business ecosystem idea” and provides a framework of processes for firms to engage in co-existence rather than competition (Bechtel & Jayaram, 1997).
The term supply chain management has developed in popularity over the past two decades, with much research being done on the topic (Ashish, 2007). The concept of SCM has received growing attention from academicians, consultants, and business manager’s alike (Feldmann & Müller, 2003, Tan et al.,1999).
“Management is on the edge of a major breakthrough in understanding how industrial company conquest depends on the interactions between the flows of information, materials, money, manpower and capital equipment. The way these five flow systems interlock to intensify one another and to cause change and fluctuation will form the foundation for anticipating the effects of decisions, policies, organizational forma and investment choices” (Forrester, 1958). He introduced a theory of distribution management that recognized the integrated nature of organizational relationships. Because organizations are so tangled, he argued that system dynamics can manipulate the performance of functions such as research, engineering, sales and promotion. He illustrated this experience utilizing a computer simulation of order information flow and its influence on production and distribution recital for each supply chain member, as well as intact supply chain system. Imitation of this phenomenon includes the “Beer Game” simulation and research covering the “Bullwhip Effect” (Lee et al., 1997).
IC™ Value: 3.00 CODEN: IJESS7 to depend on the level of inventory management practices. They recognized that “Return on Equity” had a strong association with lean inventory system and strategic supplier partnerships. As such, they concluded that the performance of sugar firms could therefore be stated as being a function of their inventory management practices. Agus and Noor (2006) did measure the insight of managers about the effect of inventory management practices on financial performance of manufacturing firms in Malaysia.
In the article, “Optimizing Economic Order Quantity,” issued by Dave Kartik, Saxena Karunesh, 2005, focused on the Economic Order Quantity. Piasecki indications that in today’s leading technology, many companies are not taking advantage of the fundamental inventory models. There are various software packages in aiding companies with inventory control, but if the data entered are inaccurate, it may lead to poor results.
The Economic Order Quantity (EOQ) formula has been used in both engineering and business disciplines. Engineers study the EOQ formula in engineering economics and industrial engineering courses. On the other hand, business restraints study the EOQ in both operational and financial courses. In both disciplines, EOQ formulas have practical and exact applications in showing concepts of cost tradeoffs; as well as specific application in inventory (Roach 2005).
Roach explains that the Economic Order Quantity (EOQ) has been a well-known formula that analyses the optimal Economic Order Quantity. He succeeded to write and publish the economic Order quantity formula in 1915 as an undergraduate student. (Roach 2005).
III. METHODOLOGY ADOPTED
One of the most common decisions faced by operations managers is “how much to Order” or “how many times to Order” of something to satisfy external or internal requirements for item. Mostly, this decision is made with little knowledge thought about its price related to Cost.
Following assumptions have been used in adopted model:
1. Demand is constant and continuous over the time.
2. The lead-time is constant.
3. There is no limit on Order size to stores capacity.
4. The Cost of placing an Order is independent of size of Order.
5. The Cost of holding a unit of stock does not depend on the quantity in stock.
This model is the easiest way for calculating Inventory. Economic Order quantity may be calculated as:
EOQ= √2AOc/Co (1)
IC™ Value: 3.00 CODEN: IJESS7 S = Order Size
N= Number of Orders for the year IA = Average Inventory
The firm requires below given units of material for manufacturing of steel. The following are the details of their operation during 2016 represented in Table 1.1.
Table 1.1 data for the year 2016
ITEMS
Billets/Blooms Qty (Mt) 1,06,066
Ordering Cost per Order Rs 2,400
Carrying Cost 10%
Purchase price per unit Rs 440
Calculation of EOQ
Total units required (A) =106066mt
The Ordering Cost per Order (Oc) = Rs.2400
Carrying Cost per unit (Cc) = 10%
(i.e.) 10% of Rs.2000 =Rs.44
EOQ =√2AOc/Cc
=2 *106066* 2400/44 =Rs.3401.59
Number of Orders for the year = A/EOQ
=106066/3401.59 =31.18~32Orders
Total Annual Cost = Carrying Cost + Ordering Cost = 5.493154+ 76800
= Rs.5569954
Carrying Cost = Order Size* Average Inventory
Order Size = A/No of Orders = 184661/39 = 4734.90
Average Inventory = Order Size/2 =4734.90/2 = Rs.2367.45
Carrying Cost = 4734.90 *2367.45 = Rs.11209639
Ordering Cost = Cost per Order* No of Orders = 3000* 39
IC™ Value: 3.00 CODEN: IJESS7
IV. RESULTS AND DISCUSSION
Organizations are regularly parts of supply chains that link the process steps such as acquiring raw materials, manufacturing, assemblage and delivery to end customer. Components such as inventory management, technology, Cost, competitiveness and external regulations need to be managing efficiently to attain the business goals of each supply chain members. As a matter of fact, the inventory management techniques are a part of production management, but awareness with them is of great help to the financial managers in planning and budget inventory. The reason of EOQ models is to decide how much to Order and when to Order. This research goes throughout the process of examine the company’s current Inventory model and suggest an inventory control model. A case study for inventory control has been done on B Brown Medical India Pvt. Ltd. The company offers Surgery, Intensive Care, Plexux Anesthesia, and Acute and Chronic Dialysis Equipment, including Syringe, Infusion Pumps, and FM Systems; Nerve Stimulators; and Dialysis Machines.
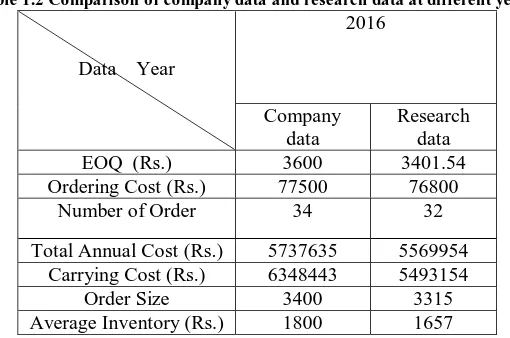
Comparison of collected data and the data received from the opted model has been shown in Table 1.2.
Table 1.2 Comparison of company data and research data at different years.
Data Year
Total Annual Cost (Rs.) 5737635 5569954
Carrying Cost (Rs.) 6348443 5493154
Order Size 3400 3315
Average Inventory (Rs.) 1800 1657
Results indicate that the Inventory Cost for the year 2016 has been reduced upto 5.83 % and the Ordering Cost has been reduced upto 0.91%. Similarly, it has been found that the Number of Order for the year 2016 has been reduced upto 6.25% and the Total Annual Cost has also been decreased upto 3.01% .The Carrying Cost has been reduced upto 15.57. The Order Size has been reduced upto 2.56% and the Average Inventory has been reduced upto 8.63%.
V. REFERENCES
[1] Agus, A & Noor, Z.M. (2006). Supply chain management and performance. An Empirical Study. A working paper university of Malaysia.
[2] Ashish, A.T. (2007) Competitive advantage of a firm through supply chain responsiveness and scm
practices (Doctoral dissertation) Retrieved from Dissertations and Thesis database
(toledo1176401773).
[3] Bechtel, C. & Jayaram, J. (1997), Supply chain management: a strategic perspective, International Journal of Logistics Management, Vol. 8 No. 1, pp. 15–34.
[4] Biju Kr. Thapalia, Stein W. Wallace and Michal Kaut (2009), “Using inventory to handle risks in the supply of oil to Nepal”, Int. J. Business performance and Supply Chain Modelling, Vol. 1 No. 1, pp. 41-60.
[5] Childerhouse, P., Aitken, J., Towill, D.R., 2002. Analysis and design of focused demand chains. Journal of Operations Management 20, 675–689.
[6] Choi, T.Y., Hong, Y., 2002. Unveiling the structure of supply network: Case studies in Honda, Acura, and DaimlerChrysler. Journal of Operations Management 20, 469–493.
[7] Croom, S., Romano P. & Giannakis M., (2000) Supply chain management: an analytical framework for critical literature review, European Journal of Purchasing and Supply Management, Vol. 6, pp. 67-83. [8] Dave Kartik, Saxena Karunesh, 2005. Distribution and logistics management practices for computer
IC™ Value: 3.00 CODEN: IJESS7 [9] Feldmann, M., & Müller S. (2003) An incentive scheme for true information providing in supply
chains. OMEGA Vol.3, No. 2, pp.63–73 Jones C. (1998) Moving beyond ERP: making the missing link Logistics Focus, Vol. 6, No.7, pp. 2–7.
[10] Forrester, Jay W., 1958. Industrial dynamics: A major breakthrough for decision makers. Harvard Business Review 38, July-August, 37-66.
[11] Ganeshan, R., Harrison, T.P., 1995. An introduction to supply chain management
http://silmaril.psu.edu/misc/supply chain intro.html.
[12] Gibson, B. J., Mentzer, J. T., and Cook, R. L. (2005), Supply chain management: the pursuit of a consensus definition, Journal of Business Logistics, Vol. 26 No.2, pp. 17-25.
[13] Ilaria Giannoccaro, Pierpaolo Pontrandolfo, Barbara Scozzi, “A fuzzy echelon approach for inventory management in supply chains”, pp. 105 – 196, 2003.
[14] Lee, Hau L., V. Padmanabhan, Seungjin Whang, 1997. Information distortion in a supply chain: The bullwhip effect. Management Science 43 (4), 546-558.
[15] Mentzer, J. T. (2001), Supply Chain Management, Sage, Thousand Oaks, CA.
[16] Nath, Vikas, Pratibha and Das, R.P. 2008, “Managing Customer Experiences”, Journal of Indian Management and strategy, Vol. 13(1), Jan.-Mar., pp. 46-52.
[17] Quinn, F.J., 1997. Team up for supply chain success. Logistics Management 36, 39–41.
[18] Rai, K.N., Grover, R.K., Dhingra Atul, 2009. Implications of retail chains in agriculture produce in India. Indian Journal of Agricultural Marketing 23 (1), January-April., 44.
[19] Reiner, G., Trcka, M., 2004. Customized supply chain design: Problems and alternatives for a production company in the food industry. A simulation based approach 89, 217–229.
[20] Roach/School of Business, Washburn University, Topeka, Kansas, USA, Bill. "Origin of the Economic Order Quantity formula; transcription or transformation?" Management Decision 43.9 (2005): 1262-268.
[21] Tan, K.C., Kannan V.R., Handfield R.B. & Ghosh S. (1999) Supply chain management: an empirical
study of its impact on performance, International Journal of Operations and Production Management, Vol. 19, No. 10, pp. 1034-1052
CITE AN ARTICLE
Sunhal, A. S., & Mangal, D. (2017). ANALYSIS OF INVENTORY MANAGEMENT IN A
SUPPLY CHAIN BY USING ECONOMIC ORDER QUANTITY (EOQ)
MODEL. INTERNATIONAL JOURNAL OF ENGINEERING SCIENCES & RESEARCH