Extreme Rainfall Indices for Tropical Monsoon Countries in
Southeast Asia
#Kusumastuti, C.1* and Weesakul, S.2
Abstract: Southeast Asian countries have the possibility to have rainfall and number of extreme rainfall event change due to future climate variation. This paper proposed three extreme rainfall indices as a modification of climate extremes indices from CLIMDEX Project by researchers at the Climate Change Research Centre (CCRC), the University of New South Wales (UNSW). The proposed indices aim to be used as a parameter for observing extreme rainfall events in tropical monsoon countries. Eleven extreme precipitation indices from CLIMDEX Project and the three proposed extreme precipitation for tropical monsoon countries are systematically analyzed based on data of daily rainfall from meteorological stations in Bangkok and Jakarta. Mann-Kendall test was used to observe the trend of extreme rainfall. In general, the analysis of a total of 14 extreme indices show both Bangkok and Jakarta received more rainfall during rainy season and less rainfall during dry season. Specifically, a significant increasing trend of extreme rainfall indices (R60 and R80) was revealed using the proposed indices.
Keywords: Climate variation; extreme rainfall; Mann-Kendall test; rainfall pattern.
Introduction
Climate change, a phenomenon that is currenltly studied by many researchers around the world, causes several impacts on hydrological variables in many region in the world, including Southeast Asia region. In the Inter-governmental Panel on Climate Change (IPCC)’s fourth assessment report [1], the increasing temperature in Southeast Asia region that caused increasing precipitation was disclosed. Climate change is also considered as the cause of the increasing number of extreme climate events, such as extreme rainfall and extreme temperature. Further impact of extreme rainfall and extreme temperature is the increasing magnitude and number of occurance of severe flood and severe drought. There are a number of research studies on trend of rainfall and its fluctuation in different countries [2-4]. Zhang et al. [2] revealed the annual temperature in Southern Canada during 1990–1998 increased by 0.5–1.5º C corresponds to the increasing of precipitation by 5-35%. Manton et al. [3] revealed the changing of temperature corresponds to the change of precipita-tion in Southeast Asia and South Pacific. Shantha
# Part of this paper was published at the 3rd International Conference of EACEF 2011, Yogyakarta, INDONESIA.
1 Department of Civil Engineering, Petra Christian University, Surabaya, INDONESIA
2 Water Engineering and Management Program, School of Engi-neering and Technology, Asian Institute of Technology, Bangkok, THAILAND.
*Corresponding author, e-mail:[email protected]
Note: Discussion is expected before November, 1st 2014, and will be published in the “Civil Engineering Dimension” volume 17, number 1, March 2015.
Received 23 June 2014; revised 11 August 2014; accepted 15 September 2014.
and Jayasundra [4] revealed the reduction of rainfall in the Mahawali Upper Watershed, Sri Lanka, by 39.12% during the past hundred years.
The objective of this study is to observe the trend of extreme rainfall in cities in Southeast Asia Countries using modified extreme rainfall indices from CLIMDEX Project [5].
Extreme Rainfall Indices
CLIMDEX Project [5] developed software to analyze datasets which represent more extreme aspects of climate. A total of 27 extreme climate indices which consider both extreme temperature and extreme precipitation were introduced through the project.
Eleven extreme indices in Bangkok and Jakarta [5] are tabulated in Table 1 and will be analyzed based on historical daily rainfall data.
Bangkok, the capital of Thailand, is located at
13°45’8” North Latitude and 100°29’38” East Longi
Jakarta, the capital of Indonesia, which is located at
6°12’ South Latitude and 106°48’ East Longitude has
tropical climate with average minimum temperature 22.2º–26.1º C and average maximum temperature rainfall in August) up to 341.6 mm (average monthly rainfall in January). Observatorium (1980–2007), Halim Perdana Kusuma (1980–2002), and Cileduk (1980–2003) were used.
From those historical daily rainfall data in Bangkok and Jakarta, it is revealed that in many days during the rainy season in both cities, the depth of rainfall can more than 40 mm. Starting from that infor-mation, three extreme rainfall indices are proposed to be analyzed for both cities. The proposed rainfall indices are presented in Table 2.
Table 2. Newly-introduced Extreme Rainfall Indices ID Unit Indicator Definition R60 Day Number of heavy
R100 Day Number of extremely heavy rainfall days Mann-Kendall’s test [8]. It is a non-parametric test of rank-based procedure. The procedure of this test is to find out whether a pair of data is concordant pair (yi
> yj) to scores 1, discordant pair (yi < yj) to scores -1,
or tied pair (yi = yj) to scores 0. For large sample data
(n > 10) the test can be modified into normal distribution. The value of z on Mann-Kendall’s test
can be calculated using Equation 1 and the Kendall’s
τ can be calculated using Equation 2. The null
hypothesis of this test is no trend and the rejection is the value of z is greater than the absolute value of Analysis of the trend of extreme rainfall in Bangkok and Jakarta were conducted at 5% significant level at annual basis for eleven extreme rainfall indices from CLIMDEX Project (refer to definition of each index in Table 1).
The analysis was also done at monthly basis for eight extreme rainfall indices i.e. Consecutive Wet Days (CWD), number of days with above 10 mm
Table 1. Extreme Precipitation Indices from CLIMDEX Project [5]
ID Unit Indicator Definition
CDD Day Consecutive dry days Number of consecutive days with PRCP < 1 mm CWD Day Consecutive wet days Number of consecutive days with PRCP ≥ 1 mm PRCPTOT mm Annual total wet-day rainfall Annual total PRCP in wet days (PRCP ≥ 1 mm) R10 Day Number of days with above 10 mm rainfall Annual number of days when PRCP ≥ 10 mm R20 Day Number of days with above 20 mm rainfall Annual number of days when PRCP ≥ 20 mm R40 Day Number of days with above 40 mm rainfall Annual number of days when PRCP ≥ 40 mm R95p mm Very wet days Annual total precipitation when PRCP > 95 percentile R99p mm Extremely wet days Annual total precipitation when PRCP > 99 percentile RX1day mm Max 1-day rainfall amount Monthly maximum 1-day precipitation
RX5day mm Max 5-day rainfall amount Monthly consecutive 5-day rainfall
SDII mm/day Simple daily intensity index Annual total rainfall divided by the number of wet days (PRCP ≥ 1 mm) in the year
rainfall (R10), number of days with above 20 mm rainfall (R20), number of days with above 40 mm rainfall (R40), number of heavy rainfall days (R60), number of very heavy rainfall days (R80), number of extremely heavy rainfall days (R100), and max 1-day rainfall amount (RX1day) in months with high rainfall (Bangkok: May and June; Jakarta: January and February) and in months with less rainfall (Bangkok: December; Jakarta: September). These analysis aims to observe the trend of extreme rainfall events specifically during the rainy season and the dry season.
Trend of Extreme Rainfall in Bangkok
The extreme rainfall indices were analyzed based on daily rainfall data in Bangkok, the results were presented in Table 3. The results show the increas-ing trend of CWD, PRCPTOT, R10, R20, R40, R95p, RX1day, and SDII in all stations, while R99p and RX5 days tend to decrease at Bangkok Metropolis. From the first eight extreme indices mentioned,
the extreme rainfall tends to occur in single day or several consecutive days which in the end could add the depth of annual rainfall.
The proposed extreme rainfall indices were also analyzed based on daily rainfall data in Bangkok. The result was presented in Tables 4 to 6.
May and June are rainy months, while December is dry in Bangkok. Bangkok Metropolis and Don Muang show the increasing trend of all extreme rainfall indices. Specifically at Don Muang, signifi-cant increasing trend is observed in R10, R60, R80, and RX1day. On the contrary, Bang Na shows the decreasing trend of R60, R80, R100, and RX1day. However, Bang Na seems to receive more rainfall during the dry season (December) when the other station shows the negative trend.
Trend of Extreme Rainfall in Jakarta
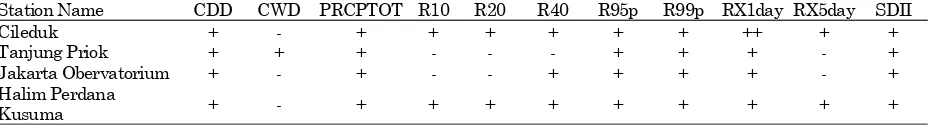
Trend of each extreme rainfall indices in Jakarta is presented at Table 7.
Table 3. Trend of Extreme Rainfall in Bangkok
Station Name CDD CWD PRCPTOT R10 R20 R40 R95p R99p RX1day RX5day SDII
Bangkok Metropolis - + + + + + + - + - +
Bang Na - ++ ++ ++ ++ ++ ++ + + ++ ++
Don Muang - + + + + ++ ++ ++ + - ++
Note: Positive trend (+), Negative trend (-), Significant positive trend (++), Significant negative trend (--) Table 4. Trend of Extreme Rainfall in Bangkok in May
Station Name CWD R10 R20 R40 R60 R80 R100 RX1day
Bangkok Metropolis + + + + + + + +
Bang Na + + + + - - - -
Don Muang + ++ + + ++ ++ + ++
Note: Positive trend (+), Negative trend (-), Significant positive trend (++), Significant negative trend (--) Table 5. Trend of Extreme Rainfall in Bangkok in June
Station Name CWD R10 R20 R40 R60 R80 R100 RX1day
Bangkok Metropolis + + + - + + - +
Bang Na + ++ ++ + + + + +
Don Muang + + + + + ++ + +
Note: Positive trend (+), Negative trend (-), Significant positive trend (++), Significant negative trend (--) Table 6. Trend of Extreme Rainfall in Bangkok in December
Station Name CWD R10 R20 R40 R60 R80 R100 RX1day
Bangkok Metropolis - - - - xx xx xx -
Bang Na + - -- - xx xx xx +
Don Muang - -- - -- xx xx xx -
Note: Positive trend (+), Negative trend (-), Significant positive trend (++), Significant negative trend (--), xx: no rainfall exceed the parameter during the period of data
Table 7. Trend of Extreme Rainfall in Jakarta
Station Name CDD CWD PRCPTOT R10 R20 R40 R95p R99p RX1day RX5day SDII
Cileduk + - + + + + + + ++ + +
Tanjung Priok + + + - - - + + + - +
Jakarta Obervatorium + - + - - + + + + - +
Halim Perdana
Kusuma + - + + + + + + + + +
A significant increasing trend of maximum one day rainfall (RX1day) is observed at Cileduk while none of significant trend is observed at the other stations.
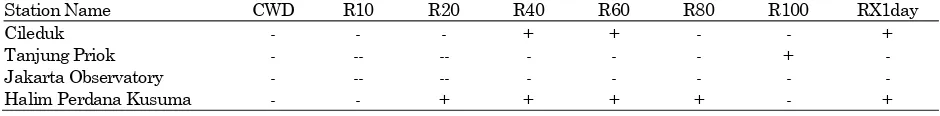
The trend of extreme rainfall in Jakarta in January, February, and September are presented at Tables 8 to10.
Annually, all stations show increasing trend of Consecutive Dry Day (CDD) during the year from time to time (Table 7). Trend of R80 even shows the increasing trend during rainy season almost in all stations and significant increasing trend at Cileduk. The fact that Jakarta tended to experience more dry days seems not represent the actual situation where annual flood is a common phenomenon. On the other hand, the trend of extreme rainfall shows the increasing trend and even significant trend in a station. This fact is possible to be one of the annual floods in Jakarta. However, the detail discussion of this matter will not be presented in this paper. It will be discussed in the other papers.
Conclusions
Bangkok and Jakarta, which are capitals of two countries in Southeast Asia, were used to represent other cities in Southeast Asia in term of the simi-larities of climate and pattern of rainfall. Apart from the result of analysis of trend of extreme rainfall in Bangkok and Jakarta whether it is significant increasing trend or significant decreasing trend, 11 extreme rainfall indices from CLIMDEX Project
were reasonable to be considered for observing extreme rainfall based on daily rainfall data in both cities using Mann-Kendall’s Test. The proposed extreme rainfall indices were also analyzed using the same test and shows that both cities experienced a day with rainfall depth more than 60 mm, 80 mm, and 100 mm. It can be concluded that all indices, including the proposed indices should be considered in analyzing extreme rainfall in Southeast Asia Countries.
Additionally, the result of analysis of trend of extreme rainfall in Bangkok and Jakarta which is presented in the paper provided information regard-ing the change of extreme rainfall events from the past 30 years in both cities. This observation can be used as basic information to conduct researches spe-cifically related to the occurrence of climate change and its counter measures in both cities.
References
1. IPCC, Climate Change 2007: The Physiscal Science Basis. Contribution of Working Group II to The Fourth Assessment Report on The
Inter-governmental Panel on Climate Change
Cam-bridge University Press, UK, 2007.
2. Zhang, X., Vincent, L.A., Hogg, W.D., and Niitso, A., Temperature and Precipitation Trends in Canada during the 20th Century, Atmosphere
Ocean, 38(3), 2000, pp. 395–429. Retrieved on July 21, 2008 from: http://www.cmos.ca/Ao/articles/ v380301.pdf., 2000, pp. 395–429.
Table 8. Trend of Extreme Rainfall in Jakarta in January
Station Name CWD R10 R20 R40 R60 R80 R100 RX1day
Cileduk - - - + + ++ + ++
Tanjung Priok - - - + + + + +
Jakarta Observatory - - - + + + + +
Halim Perdana Kusuma -- -- -- - + - - -
Note: Positive trend (+), Negative trend (-), Significant positive trend (++), Significant negative trend (--)
Table 9. Trend of Extreme Rainfall in Jakarta in February
Station Name CWD R10 R20 R40 R60 R80 R100 RX1day
Cileduk + ++ + + + + + +
Tanjung Priok + + + + + + + +
Jakarta Observatory + + + + + + + +
Halim Perdana Kusuma - - - + + -
Note: Positive trend (+), Negative trend (-), Significant positive trend (++), Significant negative trend (--)
Table 10. Trend of Extreme Rainfall in Jakarta in December
Station Name CWD R10 R20 R40 R60 R80 R100 RX1day
Cileduk - - - + + - - +
Tanjung Priok - -- -- - - - + -
Jakarta Observatory - -- -- - - -
Halim Perdana Kusuma - - + + + + - +
3. Manton, M.J., Della-Marta, P.M., Haylock, M.R., Hennessy, K.J., Nicholls, N., Chambers, L.E., et al., Trends in Extreme Daily Rainfall and Temperature in Southeast Asia and The South Pacific: 1961–1998, International Journal of Climatology, 2008. Retrieved on July 30, 2008 from: http://www.cig.ensmp.fr/~iahs/hsj/420/hysj_ 42_03_0301.pdf.
4. Shantha, W.W.A. and Jayasundra, J.M.S.B, Study on Changes of Rainfall in the Mahaweli Uppers Watershed in Sri Lanka, due to Climate Change and Develop a Correlation Model for Global Warming. Retrieved on May 5, 2008 from:http://www.stabilization2005.com/posters/S hantha_WWA.pdf.
5. CLIMDEX Project, CLIMDEX: Climate Extreme Indices. Retrieved on August 10, 2014 from: http://www.climdex.org/indices.html, 2014.
6. World Climate, Average Monthly Rainfall in Bangkok, 2008,Retrieved on July 30, 2008, from: http://www.worldclimate.com/cgi-bin/data.pl?ref= N13E100+2100+48455W.
7. World Climate, Average Monthly Rainfall in Jakarta, 2008,Retrieved on July 30, 2008 from: Source: http://www.worldclimate.com/cgi-bin/data. pl?ref=S06E106+2100+96745W.
8. Helsel, D.R. and Hirsch, R.M. Book 4: Hydro-logical Analysis and Interpretation (Chapter A3, Statistical Methods in Water Resources). USGS, USA, 1991.
![Table 1. Extreme Precipitation Indices from CLIMDEX Project [5]](https://thumb-ap.123doks.com/thumbv2/123dok/1563406.2050347/2.595.70.296.663.776/table-extreme-precipitation-indices-climdex-project.webp)