Brain Tumor Imaging
Kevin M. Brindle, Jos´e L. Izquierdo-Garc´ıa, David Y. Lewis, Richard J. Mair, and Alan J. Wright
A B S T R A C T
Modern imaging techniques, particularly functional imaging techniques that interrogate some specific aspect of underlying tumor biology, have enormous potential in neuro-oncology for disease detection, grading, and tumor delineation to guide biopsy and resection; monitoring treatment response; and targeting radiotherapy. This brief review considers the role of magnetic resonance imaging and spectroscopy, and positron emission tomography in these areas and discusses the factors that limit translation of new techniques to the clinic, in particular, the cost and difficulties associated with validation in multicenter clinical trials.
J Clin Oncol 35. © 2017 by American Society of Clinical Oncology
MAGNETIC RESONANCE IMAGING AND SPECTROSCOPY
Basic Principles
Magnetic resonance (MR) images of tissue water protons can be used to generate relatively high-resolution maps of tissue anatomy (mm resolution at the relatively low magnetic field strengths used routinely in the clinic [1.5 and 3T]). The strength of MR imaging and the reason that it gives much better soft tissue contrast than computed tomography is that the intensities of these proton signals are dependent not only on water distribution but also on the nuclear MR relaxation properties of the water proton spins, which are characterized by the relaxation times T1
and T2. These are influenced by the molecular
composition of the tissue; for example, T2 is
shortened by the presence of paramagnetic iron in deoxygenated hemoglobin found in hypoxic re-gions, and T1can be shortened by
gadolinium-containing contrast agents. The way that the image is acquired can be used to emphasize the effect of T1or T2and therefore make signal
in-tensity more sensitive to specific aspects of tissue composition. The signal is also sensitive to dif-fusion, and again, by changing acquisition pa-rameters, the image can be made more sensitive to the effects of water diffusion. MR images can be acquired as a series of two-dimensional slices or as a genuine three-dimensional acquisition. Slice thickness is usually much greater than the in-plane resolution; therefore, multislice images have low resolution in one dimension. Three-dimensional images can be acquired with
isotropic image resolution but are time con-suming to acquire and usually have a resolution
.1 mm. These resolution limitations are usually not critical for brain tumors because they are sufficient for diagnostic purposes, planning bi-opsies, and targeting radiotherapy. However, a limitation is that infiltrative tumor growth cannot be visualized directly with standard anatomic MR imaging. Image analysis algorithms can be used to improve the diagnostic1 or prognostic2,3 value of these images. This includes radiomics (reviewed in Gillies et al4), in which images are analyzed quantitatively on a voxel-by-voxel basis.
As well as detecting water, the technique can also be used to detect small molecule metabolites. These are usually detected via their proton res-onances, because the proton is, with the exception of tritium, the most sensitive to MR detection; however, because these metabolites are present at 104 to 1053 lower concentrations than tissue water, they can only be imaged at relatively low spatial and temporal resolutions. The brain is well suited to investigation by MR techniques because it is relatively superficial, there is minimal re-spiratory- or cardiac-dependent motion, and the tissue is, with the exception of positron emission tomography (PET), less accessible to other noninvasive functional imaging modalities (op-tical, photoacoustic).
A standard protocol, which can be acquired in approximately 20 minutes, has been pro-posed for imaging brain tumors, consisting of T1
-and T2-weighted sequences, some after contrast
agent administration (contrast-enhanced MR im-aging [CE-MRI]) and afluid-attenuated inversion Author affiliations and support information
(if applicable) appear at the end of this article.
Published atjco.orgon June 22, 2017. Corresponding author: Kevin M. Brindle, DPhil, Cancer Research UK Cambridge Institute, University of Cambridge, Li Ka Shing Centre, Robinson Way, Cambridge, CB2 ORE, United Kingdom; e-mail: [email protected].
© 2017 by American Society of Clinical Oncology
0732-183X/17/3599-1/$20.00
DOI:https://doi.org/10.1200/JCO.2017. 72.7636
recovery sequence that suppresses signal from cerebral spinalfluid.5 Images acquired using this protocol have been used for assessing treatment response, using the Response Assessment in Neuro-Oncology Criteria for glioma, which are based on changes in tu-mor size, and whether there is blood-brain barrier (BBB) breakdown on CE-MRI. This protocol can also be used for diagnosis and for assessing progression in follow-up scans after surgery or radiotherapy. Serial monitoring of patients with glioma after therapy can be used to determine recurrence or progression through increased contrast enhancement. However, in thefirst 3 months after treatment, contrast agent enhancement can increase due to damage to normal brain tissue, a phenomenon known as pseudoprogression. This standard MR protocol is poor at distinguishing between pseudoprogression and real progression; therefore, the patient must often wait an additional 3 months for a prognostic assessment.
Functional Imaging
Anatomic images can be complemented by additional func-tional images that measure a specific biologic property. Diffusion-weighted MRI (DW-MRI) can be used to assess treatment response, the loss of tumor cellularity post-treatment leading to an increase in the apparent diffusion coefficient of tissue water.6-8 DW-MRI, with two or three b values between 0 and 1,000 s/mm2, has been proposed for routine imaging of patients with brain tumors5,6and can be used to monitor response to radiotherapy and chemotherapy.7-9 The technique can also be used to distinguish between tumors and abscesses. Dynamic contrast-enhanced MRI can be used to measure theflow of contrast agent across a damaged BBB, whereas dynamic susceptibility MRI can be used to indicate angiogenic regions of a tumor, regardless of BBB integrity.10Perfusion MRI techniques are particularly useful for grading glioma.11-13Although it is unlikely that functional imaging modalities could ever be as accurate or as cost effective as biopsy for the purpose of diagnosis or grading, particularly with the growing importance of predictive genomic and epigenomic biomarkers, they can nevertheless be used to target biopsies. For example, using CE-MRI, which in glioma reveals BBB breakdown in areas that likely contain high-grade tumor. Functional imaging modalities would appear to have greater potential in distinguishing true progression from pseudoprogression. For example, dynamic susceptibility MRI and MR spectroscopic imaging (MRSI) have shown promise in discriminating pseudoprogression from re-currence.14Amide proton transfer MRI, in which mobile peptides and proteins are detected using chemical exchange saturation transfer, has shown some promise in monitoring progression. In an animal model, the technique was shown to distinguish tumor recurrence from ra-diation necrosis,15and Park et al16showed that amide proton transfer may be better than MRSI in this regard. Identifying early recurrence may enable reirradiation17or the initiation of alternative treatments. MR spectroscopy (MRS) and spectroscopic imaging of brain tumor metabolites has been reviewed recently.18 Grading of ce-rebral neoplasms has been attempted by analyzing the profile of metabolites detected in 1H MR spectra of tumors in vivo.19,20 However, although it shows improved sensitivity and specificity compared with anatomic imaging, this technique has so far failed to provide the diagnostic certainty required for widespread clinical acceptance. Discovery of the isocitrate dehydrogenase (IDH) 1 mutation in 70% to 90% of low-grade gliomas and secondary
glioblastomas has led to a new diagnostic paradigm where mutant IDH1 tumors are associated with a more favorable prognosis.21 Human gliomas expressing mutant IDH 1 and 2 have been identified by1H MRS detection22of the oncometabolite and prod-uct of mutant IDH, 2-hydroxyglutarate.23Loss of 2-hydroxyglutarate has been used to assess treatment response.24
In summary, functional imaging methods have been demon-strated to provide additional information for diagnosis, delineating tumor margins,25,26staging,27 monitoring treatment response,28,29 detecting recurrence,30 and monitoring disease progression.14 Al-though the utility of individual functional imaging methods for specific applications have been compared,16,31-33when combined in multiparametric MRI protocols they can collectively give better sensitivity and specificity.30,34,35However, multiparametric methods
require extra scan time and have inherent systematic errors, which are difficult to correct for, limiting comparison of absolute parameter values between different instruments and protocols.30,35,36
Guiding Surgery and Radiotherapy
Maximal surgical resection is prognostic for low-37and high-grade glioma.38 However, complete resection must be balanced against the risk of neurologic morbidity. Preoperative resection planning and intraoperative surgical resection margins can be informed by determining eloquent brain regions, such as white matter tracts, using diffusion tensor imaging (DTI).39,40 Im-provements in the algorithms that calculate the probable position of these white matter tracts from DTI data have allowed preser-vation of language pathways and also assessment of pathway damage postsurgery.41 Eloquent brain regions can also be de-termined using functional MRI (fMRI). The patient is imaged while performing certain tasks to map regions of the cortex for speech and motor function. Petrella et al42 showed that fMRI allowed a more aggressive resection strategy and Berntsen et al43 showed that a combination of fMRI and DTI led to changes in resection margins and even a complete change in therapeutic strategy. Despite these advances, variable sensitivity and specificity have been reported and, as such, the gold standard—intraoperative mapping with electrodes during awake brain surgery—remains the mainstay in regions adjacent to eloquent cortex. Imaging can also be used to identify regions within tumors that exhibit poor prognostic features and therefore could be used to target radiation, increasing dose to more aggressive areas.44-46This approach will be facilitated by the recent introduction of the MR-linac, in which a linear accelerator is incorporated into a split magnet to allow real-time MRI guidance and monitoring of radiotherapy.47
Detecting Treatment Response
When MR is being used in a clinical trial of a new drug to assess treatment response, it would be best to choose a functional imaging technique that is tailored to detect the expected readout.28 For example, perfusion imaging has the potential to show whether an antiangiogenic drug has hit its target,48,49the change in contrast enhancement providing a faster readout of treatment response than monitoring changes in tumor size using Revised Assessment in Neuro-Oncology criteria. The implementation of a multi-parametric MRI protocol for post-therapy monitoring of patients with brain tumors should therefore be patient-group and therapy
specific. Development of such protocols will require large, mul-ticenter trials to find the best combination of MRI methods for accurately detecting treatment response and to standardize image acquisition and analysis across multiple sites and vendor instruments.
Increasing Sensitivity
A fundamental limitation, particularly of MRS, has been a lack of sensitivity, which can result in long image acquisition times. The introduction of high-field (7 Tesla) instruments into the clinic,50,51 in combination with parallel imaging and MRfingerprinting,52-54
will increase sensitivity and should reduce scan times, although it remains to be seen whether there will be widespread introduction of these high-field machines into the clinic. The sensitivity of spec-troscopic measurements of tissue metabolism can also be increased by the use of hyperpolarized13C-labeled cell metabolites. Nuclear spin hyperpolarization of 13C-labeled substrates increases their sensitivity to detection in the13C MRS(I) experiment by 104-fold to 105-fold, allowing real-time imaging of metabolicfluxes in vivo. The
13
C nuclear spins in a labeled substrate arefirst hyperpolarized in a separate low temperature process (approximately 1.2 K) at high magneticfields; the frozen sample is then warmed rapidly to room temperature and injected intravenously into the patient. The hyperpolarized13C signal can be used to image the location of the labeled substrate in the body and its metabolic transformation into other metabolites, although the transient nature of the hyper-polarized 13C signal (the half-life in the body is approximately 30 seconds) means that only fast metabolic processes can be studied over relatively limited spatial regions.55
Nevertheless, the technique has already translated to the clinic with an initial study in prostate cancer,56and studies are under way
on other cancers, including glioma. The majority of studies have used pyruvate because it is rapidly taken up by cells and metabolized and is a key metabolite that sits at the junction between glycolysis and the tricarboxylic acid cycle (Fig 1). Early studies focused on monitoring treatment response57and disease progression58in an-imal models. Initial studies in glioma xenografts reported increased [1-13C]lactate production from [1-13C]pyruvate in brain tumors versus normal brain as a result of upregulation of aerobic glycol-ysis.59 Lower [1-13C]lactate levels were found after treatment of orthotopic glioblastoma xenografts with the mammalian target of rapamycin inhibitor everolimus,60and the efficacy of temozolomide alone61 or in combination with a second-generation dual PI3K/ mammalian target of rapamycin inhibitor, voxtalisib,62 has been demonstrated. The hyperpolarized [1-13C]lactate-to-[1-13
C]pyru-vate ratio has been proposed as a biomarker of response to ra-diotherapy (Fig 2).63The production of [1-13C]2-hydoxyglutarate, after injection of hyperpolarized [1-13C]a-ketoglutarate has been used to image IDH1 status64 in orthotopic xenografts, and the conversion of hyperpolarized [1-13C]a-ketoglutarate to glutamate was shown to be reduced in mutant IDH1 tumors.65
POSITRON EMISSION TOMOGRAPHY
Basic Principles
A short half-life positron-emitting isotope (eg,18F, half-life 110 minutes;11C, half-life 20 minutes) generated in a cyclotron is incorporated into a tracer and then injected intravenously into the patient. The emitted positron (antielectron) migrates a short distance (typically less than 1 mm) before colliding with an electron. The subsequent annihilation event results in the emission of two 511 keVg-rays at almost exactly 180° with respect to each
Glycolysis Pyruvate Alanine Citrate αKG Succinate Malate OAA Glutamate Glutamine Lactate CO2 Isocitrate FumarateSuccinyl-CoA LDH ALT PDH PC G6P PPP 2-HG Mut IDH1 HP 13C5 glutamine HP 13C1 glutamate HP 13C glucose HP 13C1/13C2 pyruvate HP 13C1ααKG ALT, GLDH, BCAT1, AST GLS αKG Citrate Acetyl-CoA Bicarbonate CA ATP ADP GS
Fig 1. Schematic illustration of metabolic pathways observable using hyperpolarized13
C-labeled probes. [U-2
H, U-13
C]glucose measures
flux in glycolysis and the pentose phosphate pathway (PPP). [1-13C] pyruvate exchanges the hyperpolarized13
C label with the endogenous lactate and alanine pools and is converted ir-reversibly into CO2, which is in a rapid
equi-librium with bicarbonate. The label in [2-13
C] pyruvate is incorporated into acetyl-coenzyme A and allows assessment of flux in the tri-carboxylic acid cycle. [5-13
C]glutamine can be used to monitor glutaminolysis and [1-13
C] glutamate exchanges the hyperpolarized13
C label with a-ketoglutarate. [1-13
C]a -ketogluta-rate can be used to probe reversible conversion to glutamate and to 2-hydroxyglutarate. For clarity, some intermediate metabolic steps are not shown. ALT, alanine transaminase; AST, aspartate transaminase; BCAT, branched chain amino acid transaminase; CA, carbonic anhy-drase; GLDH, glutamate dehydrogenase; GLS, glutaminase; GS, glutamine synthetase; IDH1, isocitrate dehydrogenase 1; LDH, lactate de-hydrogenase; OAA, oxaloacetate; PC, pyruvate carboxylase; PDH, pyruvate dehydrogenase.
other. These are detected by a circular array of scintillation detectors placed around the subject. If two detectors are struck effectively si-multaneously, then one can deduce that the positron-emitting isotope must lie on a line between these two detectors. By collecting data from multiple annihilation events, back-projection reconstruction methods can be used to generate an image of the location of the labeled material in the body. If attenuation of theg-rays by body tissues is corrected for, the technique can generate quantitative images with picomolar sensitivity. PET detector arrays are often used in conjunction with computed tomography, which provides an anatomic image for po-sitional reference. More recently, with the development of detectors that are insensitive to the effects of magneticfields, PET/MR machines have been introduced into the clinic.66These combine the contrast mechanisms available with MRI with the molecular information provided by PETand promise to increase the specificity of the imaging exam. For example, a decrease in tumor uptake of the glucose analog [18F]fluorodeoxyglucose (FDG) may be a reflection of cell death or a metabolic change in the tumor; by combining the FDG-PET exam with DW-MRI measurements, it may be possible to distinguish be-tween these two possibilities.
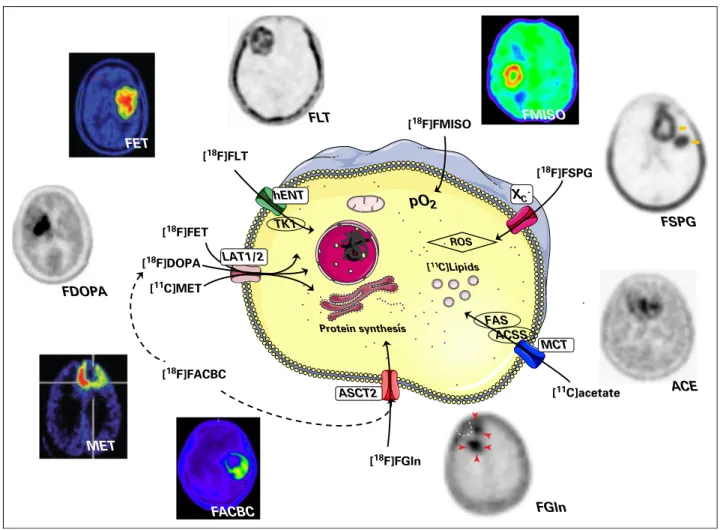
PET can be used for whole-body mapping of biologic pro-cesses67 (Fig 3) and has been used in neuro-oncology when an-atomic imaging is ambiguous for primary or differential diagnosis, noninvasive grading, prognostication, surveillance after radio-therapy, chemotherapy and surgery and for tumor delineation for targeting biopsy, resection, and irradiation.75
The majority of PET studies in cancer have used the glucose analog FDG, exploiting the high glycolytic demand of many tu-mors. FDG is widely available but has suboptimal sensitivity in the brain because of poor contrast between the tumor and surrounding cortex and poor specificity because of uptake in nonmalignant lesions.76This has led to the development of improved PET tracers for the brain, the most promising of which are the radiolabeled amino acids. Although not yet approved for use in glioma by the Food and Drug Administration in the United States, new clinical guidelines in Europe recommend the use of amino acid PET tracers in preference to FDG wherever possible.75
Radiolabeled Amino Acids
One of the most widely used radiolabeled amino acids is the essential amino acid methionine, labeled with11C, which is taken
up by theL-type amino acid transporters (LAT) 1 (SLC7A5) and 2
(SLC7A8) and incorporated into protein. Methionine showed a better correlation with cell proliferation than FDG in gliomas.77 Amino acid PET in gliomas can be used to distinguish pseudo-progressors from genuine treatment failure.78However, the short half-life of 11C requires a local cyclotron; therefore, to increase availability, several fluorinated amino acid analogs have been de-veloped, which can be made at a remote cyclotron and shipped to the imaging facility. The majority of these are not incorporated into proteins and simply measure amino acid uptake. [18F]fl uo-roethyltyrosine (FET) and [18F]fluorodihydroxyphenylalanine are substrates for LAT1 and LAT2 and are widely used in place of methionine.72 FET has advantages over methionine and [18F]fl u-orodihydroxyphenylalanine in that there is less inflammatory and striatal uptake, respectively,74and, unlike the other amino acids, FET can distinguish high- and low-grade gliomas on the basis of tracer kinetics.784-18F-(2S,4R)-fluoroglutamine, which was developed to image glutaminolysis, showed high levels of uptake in glioblastoma, and it was suggested that it may be useful for patient management.68
A glutamate analog, (4S)-4-(3-[18F]fluoropropyl)-L-glutamate, with
affinity for the cystine/glutamate (SLC7A11) transporter, gave high levels of contrast in human patients with primary and secondary brain tumors. (4S)-4-(3-[18F]fluoropropyl)-L-glutamate potentially
could be used to assess response to oxidative stress and may therefore have a role in therapy selection.69 Trans-1-amino-3-[18 F]-fluorocyclobutane-carboxylic acid is a leucine analog that shows high uptake in glioma and was shown to be better able to delineate tumor spread than CE-MRI.71
Other Metabolic Tracers
The nucleoside analog, 39-deoxy-39[18
F]-fluorothymidine, which was developed to image tumor cell proliferation, has been used for imaging early treatment response and predicting clinical outcome in brain tumors.79However, there are instances where 39-deoxy-39[18
F]-fluorothymidine does not correlate with proliferation rate.80 Human glioblastomas have been shown to oxidize acetate, which was suggested to be an important bio-energetic and biosynthetic substrate.81 11C-acetate can be used to assess the capacity for mitochondrial oxidation and tumor fatty acid synthesis82 and has been suggested to be a poten-tially useful tracer for detecting and grading glioblastoma.72 [18F]fluoromisonidazole is reduced and retained by viable
hypoxic cancer cells and is used for defining hypoxic volumes and for
1.0 0.9 0.8 0.7 No rm a li zed In te n s i t y ( A .U.)
A
B
C
D
0.6 0.5 0.4 0.3Fig 2. Representative images of (C) hyper-polarized [1-13
C]pyruvate and (D) [1-13
C]lactate in a C6 glioma-bearing animal before (top) and 96 hours after radiotherapy (bottom). The metabolic images are shown in false color, overlaid on the1
H image of tissue anatomy. (A) A chemical shift image data set and (B) a con-trast agent enhanced proton image are shown. The tumor is visible as a contrast agent–
enhancing region at the top of the brain. (D) The [1-13
C]lactate signal from the tumor was re-duced after exposure to 15 Gy radiation. Reprinted with permission from Day et al.63
noninvasive grading of glioma.83An attractive application is esca-lating radiotherapy doses to [18F]fluoromisonidazole-positive tumor regions, which are hypoxic and therefore likely to be radioresistant.84 Studies are under way to determine whether there is any clinical benefit from this approach.85
In conclusion, imaging techniques, particularly more so-phisticated functional or molecular imaging techniques, are per-ceived as being expensive. However, modern targeted therapies are also expensive; for example, treatment of patients with glioma with a course of bevacizumab cost $80,000 in 2015.86If imaging can distinguish responders from nonresponders early during the course of treatment, there are potentialfinancial benefits for the health care system, as well as welfare benefits for the patient. Although imaging costs can be brought down by centralization, for example, the production of FDG at a limited number of centers, the distributed nature of the imaging facilities themselves means that it is difficult to reduce costs further. Nevertheless, if the imaging technique addresses an unmet clinical need, then health care systems are prepared to meet this; witness the widespread implementation of FDG-PET in oncology. The requirement to
have multiple local on-site imaging facilities brings the additional problems of standardization and validation when introducing a new imaging technique into the clinic.87
Imaging, and in particular, molecular imaging, is likely to play an increasingly important role in guiding treatment as more targeted therapies transition to the clinic.88However, imaging of early treatment response is only one way in which we can select the treatment of individual patients. Pretreatment genomic analysis of tumor biopsies or of circulating tumor DNA is also likely to play an increasingly important role in treatment selection. Until relatively recently, imaging of tumor size was the only way to obtain an indication of treatment response. The demonstration that response can also be detected through the release of circulating tumor DNA,89something that is relatively easy to collect throughout the course of treatment, requires a consideration of how imaging can be used alongside measurement of new and emerging circulating biomarkers in the future. Ultimately, imaging will only be used widely and routinely if it addresses an unmet clinical need that cannot be satisfied by competing technologies. In this respect, the capability of imaging is unique when used to guide surgery or
[18F]FET [18F]FGln Protein synthesis FGln FSPG FLT FMISO pO2 [18F]FSPG [18F]FMISO XC -ACE [11C]acetate ACSS FAS MCT [11C]Lipids [18F]FLT hENT TK1 FET MET FDOPA LAT1/2 ROS FACBC ASCT2 [18F]DOPA [11C]MET [18F]FACBC
Fig 3.Positron emission tomography images and cellular uptake mechanisms for nine clinical radiotracers for brain tumor imaging. ACE, [11
C]acetate; ACSS, acetyl-coenzyme A synthetase; ASCT2, neutral amino acid transporter, SLC1A5; FACBC, trans-1-amino-3-[18
F]-fluorocyclobutane-carboxylic acid; FAS, fatty acid synthase; FDOPA, [18F]fluorodihydroxyphenylalanine; FET, [18F]fluoroethyltyrosine; FGln, 4-18F-(2S,4R)-fluoroglutamine; FLT, 39-deoxy-39[18F]-fluorothymidine; FMISO, [18F]fl uo-romisonidazole; FSPG, (4S)-4-(3-[18
F]fluoropropyl)-L-glutamate; hENT, human equilibrative nucleoside transporter, SLC29A1; LAT1/2, large neutral amino acids trans-porters, SLC7A5 and SLC7A8; MCT, monocarboxylate transporter, SLC16A1; MET, [11
C]methionine; pO2, partial pressure of oxygen; ROS, reactive oxygen species; TK1,
thymidine kinase 1; XC2, cystine/glutamate transporter, SLC7A11. Images reprinted with permission from Venneti et al,68Mittra et al,69Bruehlmeier et al,70Kondo et al,71
Yamamoto et al,72
Toyota et al,73
biopsy, or spatially targeted treatments, such as intensity-modulated radiotherapy.
AUTHORS’DISCLOSURES OF POTENTIAL CONFLICTS OF INTEREST
Disclosures provided by the authors are available with this article at
jco.org.
AUTHOR CONTRIBUTIONS
Conception and design:All authors
Financial support:Kevin M. Brindle
Collection and assembly of data:David Y. Lewis
Data analysis and interpretation:David Y. Lewis
Manuscript writing:All authors
Final approval of manuscript:All authors
Accountable for all aspects of the work:All authors
REFERENCES
1. Blanchet L, Krooshof PWT, Postma GJ, et al: Discrimination between metastasis and glioblastoma multiforme based on morphometric analysis of MR images. AJNR Am J Neuroradiol 32:67-73, 2011
2. Kickingereder P, G ¨otz M, Muschelli J, et al: Large-scale radiomic profiling of recurrent glioblas-toma identifies an imaging predictor for stratifying anti-angiogenic treatment response. Clin Cancer Res 22:5765-5771, 2016
3. Zhou M, Chaudhury B, Hall LO, et al: Identi-fying spatial imaging biomarkers of glioblastoma multiforme for survival group prediction. J Magn Reson Imaging10.1002/jmri.25497[epub ahead of print on September 28, 2016]
4. Gillies RJ, Kinahan PE, Hricak H: Radiomics: Images are more than pictures, they are data. Ra-diology 278:563-577, 2016
5. Ellingson BM, Bendszus M, Boxerman J, et al: Consensus recommendations for a standardized Brain Tumor Imaging Protocol in clinical trials. Neuro-oncol 17:1188-1198, 2015
6. Padhani AR, Liu G, Koh DM, et al: Diffusion-weighted magnetic resonance imaging as a cancer biomarker: Consensus and recommendations. Neo-plasia 11:102-125, 2009
7. Moffat BA, Chenevert TL, Lawrence TS, et al: Functional diffusion map: A noninvasive MRI biomarker for early stratification of clinical brain tumor response. Proc Natl Acad Sci USA 102:5524-5529, 2005
8. Wen Q, Jalilian L, Lupo JM, et al: Comparison of ADC metrics and their association with outcome for patients with newly diagnosed glioblastoma being treated with radiation therapy, temozolomide, erlotinib and bevacizumab. J Neurooncol 121:331-339, 2015
9. Mardor Y, Pfeffer R, Spiegelmann R, et al: Early detection of response to radiation therapy in patients with brain malignancies using conventional and high b-value diffusion-weighted magnetic reso-nance imaging. J Clin Oncol 21:1094-1100, 2003
10. Boxerman JL, Schmainda KM, Weisskoff RM: Relative cerebral blood volume maps corrected for contrast agent extravasation significantly correlate with glioma tumor grade, whereas uncorrected maps do not. AJNR Am J Neuroradiol 27:859-867, 2006
11. Sugahara T, Korogi Y, Kochi M, et al: Corre-lation of MR imaging-determined cerebral blood volume maps with histologic and angiographic de-termination of vascularity of gliomas. AJR Am J Roentgenol 171:1479-1486, 1998
12. Law M, Yang S, Babb JS, et al: Comparison of cerebral blood volume and vascular permeability from dynamic susceptibility contrast-enhanced per-fusion MR imaging with glioma grade. AJNR Am J Neuroradiol 25:746-755, 2004
13. Kang HY, Xiao HL, Chen JH, et al: Comparison of the effect of vessel size imaging and cerebral blood
volume derived from perfusion MR imaging on gli-oma grading. AJNR Am J Neuroradiol 37:51-57, 2016
14. Abdulla S, Saada J, Johnson G, et al: Tumour progression or pseudoprogression? A review of post-treatment radiological appearances of glioblas-toma. Clin Radiol 70:1299-1312, 2015
15. Zhou J, Tryggestad E, Wen Z, et al: Differ-entiation between glioma and radiation necrosis using molecular magnetic resonance imaging of endogenous proteins and peptides. Nat Med 17: 130-134, 2011
16. Park JE, Kim HS, Park KJ, et al: Pre- and posttreatment glioma: Comparison of amide proton transfer imaging with MR spectroscopy for bio-markers of tumor proliferation. Radiology 278: 514-523, 2016
17. Ryu S, Buatti JM, Morris A, et al: The role of radiotherapy in the management of progressive glioblastoma: A systematic review and evidence-based clinical practice guideline. J Neurooncol 118: 489-499, 2014
18. Oz G, Alger JR, Barker PB, et al: Clinical proton MR spectroscopy in central nervous system disor-ders. Radiology 270:658-679, 2014
19. Vicente J, Fuster-Garcia E, Tortajada S, et al: Accurate classification of childhood brain tumours by in vivo1
H MRS - a multi-centre study. Eur J Cancer 49:658-667, 2013
20. Garc´ıa-G ´omez JM, Luts J, Juli `a-Sap ´e M, et al: Multiproject-multicenter evaluation of automatic brain tumor classification by magnetic resonance spectroscopy. MAGMA 22:5-18, 2009
21. Brat DJ, Verhaak RG, Aldape KD, et al: Com-prehensive, integrative genomic analysis of diffuse lower-grade gliomas. N Engl J Med 372:2481-2498, 2015
22. Choi C, Ganji SK, DeBerardinis RJ, et al: 2-hydroxyglutarate detection by magnetic resonance spectroscopy in IDH-mutated patients with gliomas. Nat Med 18:624-629, 2012
23. Dang L, White DW, Gross S, et al: Cancer-associated IDH1 mutations produce 2-hydroxy-glutarate. Nature 462:739-744, 2009
24. Andronesi OC, Loebel F, Bogner W, et al: Treatment response assessment in IDH-mutant gli-oma patients by noninvasive 3D functional spectro-scopic mapping of 2-hydroxyglutarate. Clin Cancer Res 22:1632-1641, 2016
25. Fouke SJ, Benzinger T, Gibson D, et al: The role of imaging in the management of adults with diffuse low grade glioma: A systematic review and evidence-based clinical practice guideline. J Neurooncol 125:457-479, 2015
26. Svolos P, Kousi E, Kapsalaki E, et al: The role of diffusion and perfusion weighted imaging in the differential diagnosis of cerebral tumors: A review and future perspectives. Cancer Imaging 14:20, 2014
27. Colonnese C, Romanelli P: Advanced neuro-imaging techniques in the management of glioblas-toma multiforme. Curr Radiopharm 5:300-307, 2012
28. Hutterer M, Hattingen E, Palm C, et al: Current standards and new concepts in MRI and PET re-sponse assessment of antiangiogenic therapies in high-grade glioma patients. Neuro-oncol 17:784-800 2014
29. Shiroishi MS, Boxerman JL, Pope WB: Physiologic MRI for assessment of response to therapy and prognosis in glioblastoma. Neuro-oncol 18:467-478, 2016
30. Verma N, Cowperthwaite MC, Burnett MG, et al: Differentiating tumor recurrence from treat-ment necrosis: A review of neuro-oncologic imaging strategies. Neuro-oncol 15:515-534, 2013
31. Fudaba H, Shimomura T, Abe T, et al: Com-parison of multiple parameters obtained on 3T pulsed arterial spin-labeling, diffusion tensor imaging, and MRS and the Ki-67 labeling index in evaluating glioma grading. AJNR Am J Neuroradiol 35:2091-2098, 2014
32. Law M, Yang S, Wang H, et al: Glioma grading: Sensitivity, specificity, and predictive values of per-fusion MR imaging and proton MR spectroscopic imaging compared with conventional MR imaging. AJNR Am J Neuroradiol 24:1989-1998, 2003
33. Tsougos I, Svolos P, Kousi E, et al: Differen-tiation of glioblastoma multiforme from metastatic brain tumor using proton magnetic resonance spectroscopy, diffusion and perfusion metrics at 3 T. Cancer Imaging 12:423-436, 2012
34. Roy B, Gupta RK, Maudsley AA, et al: Utility of multiparametric 3-T MRI for glioma characterization. Neuroradiology 55:603-613, 2013
35. Kazda T, Bulik M, Pospisil P, et al: Advanced MRI increases the diagnostic accuracy of recurrent glioblastoma: Single institution thresholds and vali-dation of MR spectroscopy and diffusion weighted MR imaging. Neuroimage Clin 11:316-321, 2016
36. Ellingson BM, Kim E, Woodworth DC, et al: Diffusion MRI quality control and functional diffusion map results in ACRIN 6677/RTOG 0625: A multi-center, randomized, phase II trial of bevacizumab and chemotherapy in recurrent glioblastoma. Int J Oncol 46:1883-1892, 2015
37. Jakola AS, Myrmel KS, Kloster R, et al: Comparison of a strategy favoring early surgical re-section vs a strategy favoring watchful waiting in low-grade gliomas. JAMA 308:1881-1888, 2012
38. Sanai N, Polley M-Y, McDermott MW, et al: An extent of resection threshold for newly diagnosed glioblastomas. J Neurosurg 115:3-8, 2011
39. Clark CA, Barrick TR, Murphy MM, et al: White matter fiber tracking in patients with space-occupying lesions of the brain: A new technique for neurosurgical planning? Neuroimage 20: 1601-1608, 2003
40. Abhinav K, Yeh FC, Mansouri A, et al: High-definition fiber tractography for the evaluation of perilesional white matter tracts in high-grade glioma surgery. Neuro-oncol 17:1199-1209, 2015
41. Caverzasi E, Hervey-Jumper SL, Jordan KM, et al: Identifying preoperative language tracts and
predicting postoperative functional recovery using HARDI q-ballfiber tractography in patients with gli-omas. J Neurosurg 125:33-45, 2016
42. Petrella JR, Shah LM, Harris KM, et al: Pre-operative functional MR imaging localization of lan-guage and motor areas: Effect on therapeutic decision making in patients with potentially resect-able brain tumors. Radiology 240:793-802, 2006
43. Berntsen EM, Gulati S, Solheim O, et al: Functional magnetic resonance imaging and diffusion tensor tractography incorporated into an intraoperative 3-dimensional ultrasound-based neuronavigation sys-tem: Impact on therapeutic strategies, extent of re-section, and clinical outcome. Neurosurgery 67: 251-264, 2010
44. Parra NA, Maudsley AA, Gupta RK, et al: Volumetric spectroscopic imaging of glioblastoma multiforme radiation treatment volumes. Int J Radiat Oncol Biol Phys 90:376-384, 2014
45. Elson A, Paulson E, Bovi J, et al: Evaluation of pre-radiotherapy apparent diffusion coefficient (ADC): Patterns of recurrence and survival outcomes analysis in patients treated for glioblastoma multi-forme. J Neurooncol 123:179-188, 2015
46. Ken S, Vieillevigne L, Franceries X, et al: In-tegration method of 3D MR spectroscopy into treatment planning system for glioblastoma IMRT dose painting with integrated simultaneous boost. Radiat Oncol 8:1, 2013
47. Lagendijk JJ, Raaymakers BW, van Vulpen M: The magnetic resonance imaging-linac system. Semin Radiat Oncol 24:207-209, 2014
48. Bennett IE, Field KM, Hovens CM, et al: Early perfusion MRI predicts survival outcome in patients with recurrent glioblastoma treated with bevacizumab and carboplatin. J Neurooncol 131:321-329, 2017
49. Hilario A, Sepulveda JM, Hernandez-Lain A, et al: Leakage decrease detected by dynamic susceptibility-weighted contrast-enhanced perfusion MRI predicts survival in recurrent glioblastoma treated with bevacizumab. Clin Transl Oncol 19:51-57, 2017
50. Di Ieva A, G ¨od S, Grabner G, et al: Three-dimensional susceptibility-weighted imaging at 7 T using fractal-based quantitative analysis to grade gliomas. Neuroradiology 55:35-40, 2013
51. Li Y, Larson P, Chen AP, et al: Short-echo three-dimensional H-1 MR spectroscopic imaging of patients with glioma at 7 Tesla for characterization of differences in metabolite levels. J Magn Reson Imaging 41:1332-1341, 2015
52. Ma D, Gulani V, Seiberlich N, et al: Magnetic resonancefingerprinting. Nature 495:187-192, 2013
53. Cloos MA, Knoll F, Zhao T, et al: Multi-parametric imaging with heterogeneous radio-frequencyfields. Nat Commun 7:12445, 2016
54. Gao Y, Chen Y, Ma D, et al: Preclinical MR
fingerprinting (MRF) at 7 T: Effective quantitative imaging for rodent disease models. NMR Biomed 28: 384-394, 2015
55. Brindle KM: Imaging metabolism with hyper-polarized13
C-labeled cell substrates. J Am Chem Soc 137:6418-6427, 2015
56. Nelson SJ, Kurhanewicz J, Vigneron DB, et al: Metabolic imaging of patients with prostate cancer using hyperpolarized [1-13C]pyruvate. Sci Transl Med 5:198ra108, 2013
57. Day SE, Kettunen MI, Gallagher FA, et al: Detecting tumor response to treatment using hyperpolarized13
C magnetic resonance imaging and spectroscopy. Nat Med 13:1382-1387, 2007
58. Albers MJ, Bok R, Chen AP, et al: Hyper-polarized13
C lactate, pyruvate, and alanine: Non-invasive biomarkers for prostate cancer detection and grading. Cancer Res 68:8607-8615, 2008
59. Park I, Larson PE, Zierhut ML, et al: Hyper-polarized13
C magnetic resonance metabolic imag-ing: Application to brain tumors. Neuro-oncol 12: 133-144, 2010
60. Chaumeil MM, Ozawa T, Park I, et al: Hyperpolarized13
C MR spectroscopic imaging can be used to monitor everolimus treatment in vivo in an orthotopic rodent model of glioblastoma. Neuro-image 59:193-201, 2012
61. Park I, Mukherjee J, Ito M, et al: Changes in pyruvate metabolism detected by magnetic reso-nance imaging are linked to DNA damage and serve as a sensor of temozolomide response in glioblas-toma cells. Cancer Res 74:7115-7124, 2014
62. Radoul M, Chaumeil MM, Eriksson P, et al: MR studies of glioblastoma models treated with dual PI3K/mTOR inhibitor and temozolomide: Metabolic changes are associated with enhanced survival. Mol Cancer Ther 15:1113-1122, 2016
63. Day SE, Kettunen MI, Cherukuri MK, et al: Detecting response of rat C6 glioma tumors to ra-diotherapy using hyperpolarized [1-13
C]pyruvate and
13
C magnetic resonance spectroscopic imaging. Magn Reson Med 65:557-563, 2011
64. Chaumeil MM, Larson PE, Yoshihara HA, et al: Non-invasive in vivo assessment of IDH1 mutational status in glioma. Nat Commun 4:2429, 2013
65. Chaumeil MM, Larson PE, Woods SM, et al: Hyperpolarized [1-13
C] glutamate: A metabolic im-aging biomarker of IDH1 mutational status in glioma. Cancer Res 74:4247-4257, 2014
66. Pichler BJ, Kolb A, N¨agele T, et al: PET/MRI: Paving the way for the next generation of clinical mul-timodality imaging applications. J Nucl Med 51:333-336, 2010
67. Lewis DY, Soloviev D, Brindle KM: Imaging tumor metabolism using positron emission tomog-raphy. Cancer J 21:129-136, 2015
68. Venneti S, Dunphy MP, Zhang H, et al: Glutamine-based PET imaging facilitates enhanced metabolic evaluation of gliomas in vivo. Sci Transl Med 7:274ra17, 2015
69. Mittra ES, Koglin N, Mosci C, et al: Pilot pre-clinical and pre-clinical evaluation of (4S)-4-(3-[18F]
fluoropropyl)-L-glutamate (18
F-FSPG) for PET/CT im-aging of intracranial malignancies. PLoS One 11: e0148628, 2016
70. Bruehlmeier M, Roelcke U, Schubiger PA, et al: Assessment of hypoxia and perfusion in human brain tumors using PET with 18F-fluoromisonidazole and 15O-H2O. J Nucl Med 45:1851-1859, 2004
71. Kondo A, Ishii H, Aoki S, et al: Phase IIa clinical study of [18
F]fluciclovine: Efficacy and safety of a new PET tracer for brain tumors. Ann Nucl Med 30: 608-618, 2016
72. Yamamoto Y, Nishiyama Y, Kimura N, et al:
11
C-acetate PET in the evaluation of brain glioma:
Comparison with11
C-methionine and18
F-FDG-PET. Mol Imaging Biol 10:281-287, 2008
73. Toyota Y, Miyake K, Kawai N, et al: Comparison of 49-[methyl-11C]thiothymidine (11C-4DST) and 39 -deoxy-39-[18F]fluorothymidine (18F-FLT) PET/CT in hu-man brain glioma imaging. EJNMMI Research 5:7, 2015
74. Juhasz C, Dwivedi S, Kamson DO, et al: Com-parison of amino acid positron emission tomographic radiotracers for molecular imaging of primary and met-astatic brain tumors. Mol Imaging 13:1-16, 2014
75. Albert NL, Weller M, Suchorska B, et al: Re-sponse Assessment in Neuro-Oncology working group and European Association for Neuro-Oncology recommendations for the clinical use of PET imaging in gliomas. Neuro-oncol 18:1199-1208, 2016
76. Dunet V, Pomoni A, Hottinger A, et al: Perfor-mance of18
F-FET versus18
F-FDG-PET for the diagnosis and grading of brain tumors: Systematic review and meta-analysis. Neuro-oncol 18:426-434, 2016
77. Kim S, Chung JK, Im SH, et al:11
C-methionine PET as a prognostic marker in patients with glioma: Comparison with18
F-FDG PET. Eur J Nucl Med Mol Imaging 32:52-59, 2005
78. Galldiks N, Langen KJ, Pope WB: From the clinician’s point of view–what is the status quo of positron emission tomography in patients with brain tumors? Neuro-oncol 17:1434-1444, 2015
79. Bollineni VR, Kramer GM, Jansma EP, et al: A systematic review on [18
F]FLT-PET uptake as a measure of treatment response in cancer patients. Eur J Cancer 55:81-97, 2016
80. Heinzmann K, Honess DJ, Lewis DY, et al: The relationship between endogenous thymidine con-centrations and [18
F]FLT uptake in a range of pre-clinical tumour models. EJNMMI Res 6:63-73, 2016
81. Mashimo T, Pichumani K, Vemireddy V, et al: Acetate is a bioenergetic substrate for human glioblas-toma and brain metastases. Cell 159:1603-1614, 2014
82. Lewis DY, Boren J, Shaw GL, et al: Late imaging with [1-11
C]acetate improves detection of tumor fatty acid synthesis with PET. J Nucl Med 55:1144-1149, 2014
83. Hirata K, Kobayashi K, Tamaki N: Hypoxia im-aging with18
F-FMISO PET for brain tumors, in Kuge Y, Shiga T and Tamaki N, (eds): Perspectives on Nuclear Medicine for Molecular Diagnosis and Integrated Ther-apy. Tokyo, Japan, Springer, 2016, 229-XXXX
84. Barker HE, Paget JTE, Khan AA, et al: The tumour microenvironment after radiotherapy: Mechanisms of resistance and recurrence. Nat Rev Cancer 15:409-425, 2015
85. Fleming IN, Manavaki R, Blower PJ, et al: Imaging tumour hypoxia with positron emission to-mography. Br J Cancer 112:238-250, 2015
86. Kovic B, Xie F: Economic evaluation of bev-acizumab for the first-line treatment of newly di-agnosed glioblastoma multiforme. J Clin Oncol 33: 2296-2302, 2015
87. O’Connor JPB, Aboagye EO, Adams JE, et al: Imaging biomarker roadmap for cancer studies. Nat Rev Clin Oncol 10.1038/nrclinonc.2016.162 [epub ahead of print on October 11, 2016]
88. Brindle K: New approaches for imaging tumour responses to treatment. Nat Rev Cancer 8:94-107, 2008
89. Dawson S-J, Tsui DWY, Murtaza M, et al: Analysis of circulating tumor DNA to monitor metastatic breast cancer. N Engl J Med 368:1199-1209, 2013
Affiliations
Kevin M. Brindle,Richard J. Mair, andAlan J. Wright, Cancer Research UK Cambridge Institute, Cambridge;David Y. Lewis,
Cancer Research UK Beatson Institute, Glasgow, United Kingdom; Jos´e L. Izquierdo-Garc´ıa, Fundaci ´on Centro Nacional de Investigaciones Cardiovasculares Carlos III and Centro de Investigaci ´on Biom´edica en Red Enfermedades Respiratorias, Madrid, Spain.
AUTHORS’DISCLOSURES OF POTENTIAL CONFLICTS OF INTEREST
Brain Tumor Imaging
The following represents disclosure information provided by authors of this manuscript. All relationships are considered compensated. Relationships are self-held unless noted. I = Immediate Family Member, Inst = My Institution. Relationships may not relate to the subject matter of this manuscript. For more information about ASCO’s conflict of interest policy, please refer towww.asco.org/rwcorascopubs.org/jco/site/ifc.
Kevin M. Brindle
Research Funding:GE Healthcare (Inst), MedImmune (Inst)
Patents, Royalties, Other Intellectual Property:Patents with GE
Healthcare on various aspects of DNP technology Jos´e L. Izquierdo-Garc´ıa No relationship to disclose David Y. Lewis No relationship to disclose Richard J. Mair No relationship to disclose Alan J. Wright No relationship to disclose