BioSystems 56 (2000) 1 – 11
Connectance in
Sorghum
development: beyond the
genotype – phenotype duality
G.N. Amzallag *
Department of Plant Sciences,The Hebrew Uni6ersity of Jerusalem,Jerusalem 91904, Israel Received 15 September 1998; received in revised form 20 October 1999; accepted 8 November 1999
Abstract
Connectance, the level of linkage between organs, was measured in different lines ofSorghum bicolorduring their reproductive development. It was compared with expression of characters, their level of variability and their heritability. A negative relationship is observed between connectance and heritability. Further results indicate that connectance does not simply introduce a noise factor in expression of a pre-existing information, but that it is directly involved in phenotypic expression and plasticity. Connectance appears as partly determined by the nature and dynamics of the network of relationships. It is concluded that the phenotype is not restricted to the deterministic expression of a pre-existing program, the genotype. Morphogenesis also involves another dimension, self-organized, which confers reliability, stability and adaptability to the developmental processes. The complex interactions between these two dimensions and their evolutionary consequences are discussed. © 2000 Elsevier Science Ireland Ltd. All rights reserved.
Keywords:Morphogenesis; Connectance; Self-organization; Developmental network; Adaptability; Phenotypic plasticity
www.elsevier.com/locate/biosystems
1. Introduction
It is generally assumed that the phenotype re-sults from a deterministic, though complex, ex-pression of a pre-existing information, the genotype. Indeed, a direct relationship between genotype and phenotype may be observed in adult organisms. However, the control of developmen-tal processes is not directly related to the gene-en-coded information. For example, discrete morphological patterns are represented at a defined frequency within a population, and those
independently of the genetic variation encoun-tered (Alberch, 1980). From these observations, Alberch (1980) concluded that ‘‘The complexity of interactions during development renders the anal-ysis of patterns of morphological evolution im-possible to reduce to a problem of change in gene frequency’’. This opinion was confirmed by stud-ies in quantitative genetics in which normal distri-butions of characters are observed independently of the frequency distribution of specific alleles (Barton and Turelli, 1989).
Complex models including multiple sets of al-lele interactions were proposed in order to explain this feature in terms of genotype/phenotype
dual-* Fax: +972-2-6584425.
ity. As emphasized by Lewontin (1974), this mode of interpretation involving a cumulative effect of specific alleles ‘‘comes from a general Cartesian world view that things can be broken down into parts without losing any essential information…’’ (Lewontin, 1974).
Development is extremely extended in plants, as compared with animals. This may be the reason why, in plants, most of the morphological, behav-ioral and physiological differences among individ-ual do not ‘mendelize’ (Sultan, 1992), and why the plasticity observed during development is so adaptive (Bradshaw, 1965; Moran et al., 1981; Sultan, 1987). Accordingly, there must be another central factor,generated by the de6elopment itself,
which enables harmonized achievement of the de-velopment in spite of genetic, dede-velopmental or environmental perturbations. Such a property has been termed canalization (Waddington, 1942),
equifinality (von Bertalanffy, 1950), correcti6e
pleiotropy (Warburton, 1955), or adapti6e deter
-minism (Seligmann and Amzallag, 1995). Its in-volvement does not imply any vitalistic explanation, but only to consider living organisms in development as open systems with a sponta-neous tendency to reach the minimal free-energy status (Prigogine and Wiame, 1946). More re-cently, Conrad (1990) suggested the existence of thermodynamic basins of attraction sponta-neously emerging in the phenotypic landscape, which are involved in a structural increase in complexity and adaptive responses during devel-opment. These considerations point to the emer-gence of a self-organized dimension during development (Conrad, 1983; Ito and Gunji, 1997; Hiett, 1999). Recently, experimental measure-ments have confirmed the self-organizing nature of specific transition phases in plant development (Amzallag, 1999a,b).
Theoretical considerations suggest that emer-gence of the self-organization dimension in devel-opment results from changes in the level of self-association (Chauvet, 1993). On the other hand, it was observed that, in Sorghum bicolor, the level of linkage between different organs is not constant during development, and that sudden modifications occurred specifically during the transition phases (Amzallag, 1999a). More
gener-ally, Trewavas and Malho (1997) have suggested that the phenotypic dimension is generated by the network of cell-to-cell, and organ-to-organ rela-tionships. All these considerations indicate that the level of linkage during development may be both the result and the condition for emergence of self-organizing processes. The aim of the present study is to investigate whether connectance, a quantification of the network of relationships within the developing organism, is an expression of the self-organized dimension of development. This hypothesis is tested here through analysis of connectance and its relationship with expression and transmissibility of reproductive characters in
S. bicolor.
2. Materials and methods
2.1. Plant material and growth conditions
Seeds of S. bicolor (inbred line, parent male of the commercial cultivar 610) were a gift of the Hazera Seed Company, Israel. The first genera-tion of plants was grown in optimal condigenera-tions in a greenhouse, as previously described (Amzallag, 1998). Seeds from eight plants were harvested separately and defined eight lines of progenies. A year later, 15 seeds from each plant were ran-domly taken and grown in a field (three separated blocks of five plants) as previously described by Amzallag et al. (1998). These eight lines were used for calculation of the link between heritability and connectance. There was less than 10 individuals in two of these lines. They were considered for calcu-lation of the connectance of each organ and its comparison with heritability after examination of the calculated connectances (see below, and Fig. 1). However, these two lines were not considered for further analyses (Figs. 2 – 5, Tables 1 – 3) in order to prevent any bias in comparison of connectances.
2.2. Measurements
G.N.Amzallag/BioSystems56 (2000) 1 – 11 3
main tiller. Stem height was defined as the length between the first adventitious roots and the top of the spike. Total seed weight was measured and the average seed weight was determined after weigh-ing three groups of 10 seeds randomly taken. The number of seeds was estimated as the ratio be-tween total and average seed weight. After remov-ing the seeds, the shoot was dried at 60°C for 2 weeks. Because some old leaves were frequently missing, shoot dry weight (DW) was measured after removing all the blades. The blades from the four last leaves were weighed and considered as an estimation of the weight of functional leaves during seed maturation.
Connectance was calculated on the basis of six characters for analysis of its relationship with heritability (Fig. 1). These six characters are stem height, shoot DW, total seed weight, harvest in-dex (total seed weight/shoot DW ratio), average seed weight, and relative fertility (number of seeds/total stem weight ratio). The link between connectance and character expression (Figs. 2 – 5, Tables 1 – 3) was analysed after a recalculation of connectance based on a new set of eight charac-ters which are: stem height, number of seeds, total seed weight, average seed height, leaf weight (DW of the four last leaves), stem DW, spike DW (without seeds), and fertility (estimated as the ratio between spike DW and the number of seeds).
2.3. Calculations
Heredity was estimated for each character as the r-coefficient between parental and mean progeny value. The coefficient of variation (CV) of a parameter P was calculated as follows:
CV(P)=100×avg(P)/S.D.(P) (1)
where avg(P) and S.D.(P) are respectively the between-line mean and S.D. calculated for the parameter P. Standardisation of the p-value of a parameterP(abbreviated assp) was performed as follows:
sp=[p-avg(P)]/S.D.(P) (2)
Connectance, a term defined by Gardner and
Ashby (1970), is the expression, within an ensem-ble (P1,…,Pm) of measured characters, of the level
of linkage between a character Pkand the (m−1)
others. The r-coefficients for linear regression be-tween the character Pkand each one of the other
characters was calculated. Before using them as parametric variables, the r-coefficients (non-nor-mally distributed) were transformed into z-values (normally-distributed), according to Sokal and Rohlf (1981):
z=0.5×ln[(1+r)/(1−r)] (3)
Within a population, connectance of a character Pk (abbreviated as C(Pk)) is defined as the mean of the absolute value of z for all the (m−1) correlations including the character
Pk.
C(Pk)=[1/(m−1)]× %
m−1
i=1
z(Pk,Pi) (4)
The z-transformation values are influenced by the size of the population considered for calculation of ther-coefficients. The calculation of the mean connectance of a character between populations with different sizes (as performed in Fig. 1) was realized after examination of the
z-values. The characters (P1,…Pk,…,Pm) were
measured on each population f including nf sam-ples.
For a character Pk (one of the m characters previously considered), the linkage with them−1 other characters in the population f was quantified by the ensemble of z-coefficients
[zf(Pk, P1),…,zf(Pk, Pm−1)]
The zf-coefficients were weighted (wzf)
accord-ing to Sokal and Rohlf (1981):
wzf(Pk, Pi)=(nf−3)×zf(Pk, Pi) (5)
Thus, the connectance Cof a characterPkwas calculated, on the basis of a number ofs popula-tions, as follows:
C(Pk)=
!
1/(m−1)× % sf=1
(nf−3)
n
"
× %
s
f=1 %
m−1
i=1
3. Results
3.1. Connectance and heritability
Heritability (h) of each one of the six consid-ered characters was calculated as the r-coefficient for the relationship between parental value and offspring mean value for the eight lines consid-ered. The level of linkage between a character and the five others was calculated separately for each line. The absolute value of theser-coefficients was
z-transformed (according to Eq. (3)), and exam-ined as a function of the population size (accord-ing to Eq. (5)). For each character, these values were averaged (according to Eq. (6)), and consid-ered as a global estimation of the connectance for the character. This global connectance was com-pared to the heritability calculated for the same character. A negative significant correlation (PB
0.01) is observed (Fig. 1). This indicates that heritability of a character is inversely proportional to its linkage to other developmental events. Two interpretations may be suggested:
1. Pre-existing information, as quantified by heri-tability, is the single source of control of the development. Thus, the linkage of a character to the others generates a ‘developmental noise’ which disturbs expression of this pre-existing information.
2. The network of relationships is also a source of information for development, which com-pletes, substitutes or even counteracts expres-sion of the pre-existing information.
These hypotheses are tested in the following.
3.2. Connectance and 6ariability
In a homogeneous population exposed to a uniform environment, the noise in expression of a character may be estimated by the coefficient of variation (CV). The CV (Eq. (1)) and connectance (Eq. (4)) were calculated separately for each one of the eight characters and each one of the six lines considered (see Section 2). Large differences in CV and connectance are observed between the lines and between the studied characters (Tables 1 and 2). Corresponding connectance (Table 2) and CV (Table 1) values were plotted together. A
positive, significant (PB0.001) correlation is
ob-served (Fig. 2). Large between-characters differ-ences in CV and connectance are observed (Tables 1 and 2). In order to test whether the positive correlation (Fig. 2) is due to these initial differ-ences, all the values of Tables 1 and 2 were standardized (according to Eq. (2), see Section 2) before plotting. A positive, significant correlation was also observed (r=0.336, PB0.05, not
shown). This result confirms the link between connectance and phenotypic variation, and sug-gests that connectance generates a noise in expres-sion of a pre-existing information. However, an accurate analysis of Fig. 2 reveals a complex situation. A negative significant relationship may be observed between CV and connectance below a critical value of 0.50 in connectance (exponential regression, 17 df, r= −0.56, PB0.02, not
shown).
3.3. Relationship between connectance and de6elopment
G
.
N
.
Amzallag
/
BioSystems
56
(2000)
1
–
11
5
Table 1
Within-line variability for the eight measured charactersa
Stem height Total seed wt. Number of seeds Mean seed wt. Relative fertility Mean CV per Shoot DW
Line Leaf DW Spike DW
line
10 20.2 25.3 40.8 5.4 31.6 30.3 12.6 22.4 23.6
30.8 24.7 56.4 34.6
45.8 36.3
15 31.7 47.1 3.9
46.1
27.2 32.4 38.4 6.3 35.8 12.6 28.8 28.5
20
6.2 44.8 36.0 15.1 25.1 29.5
25 34.1 33.8 40.6
32.7 16.2 34.0 27.6
35.6
31.2 37.2 4.9
30 28.9
32.8
19.0 23.5 27.1 4.7 26.6 11.9 34.8 22.5
45
39.4
27.6 29.7 38.6 5.2 32.0 15.5 33.6
Mean CV
3.28 4.37 11.11
6.23 6.43
S.D. 3.83 5.97 0.84
aFor each line, the variability is estimated as the coefficient of variation (CV) calculated from the 15 individuals sampled (13 individuals sampled in line 10). Relative
fertility is the ratio between number of seeds and spike dry weight (DW).
Table 2
Connectance of the eight studied characters, as calculated separately for each one of the six linesa
Leaf DW Shoot DW
Line Spike DW Stem height Total seed wt. Number of seeds Mean seed wt. Relative fertility Mean connectance per line
0.66 0.73 0.82 0.43 0.86 0.80
10 0.24 0.32 0.61
0.83 0.73 0.50 0.64
15 0.97 0.72 0.76 0.24 0.67
20 1.05 1.00 0.89 0.43 1.14 1.12 0.71 0.22 0.82
0.86 0.71
25 0.75 0.62 0.93 0.85 0.55 0.17 0.64
0.30 0.34 0.29 0.27
30 0.60 0.56 0.26 0.31 0.36
45 0.37 0.29 0.31 0.46 0.69 0.66 0.38 0.60 0.47
Mean 0.68 0.63 0.59 0.42 0.86 0.78 0.48 0.31
0.26 0.24 0.23 0.11 0.18
S.D. 0.17 0.20 0.14
Fig. 1. Relationship between connectance and heritability inS.
bicolor grown in an optimal environment. Connectance and heritability are calculated as described in Section 2. A negative significant (PB0.01) correlation is observed.
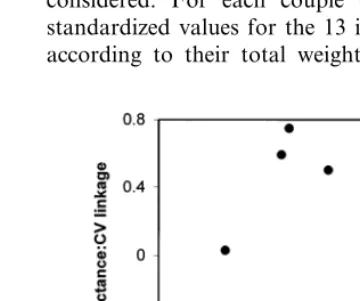
Fig. 3. Relationship between phenotypic and connectance comparison of lines. For each couple of lines, the connectance and phenotypic comparisons (Table 3) have been plotted together.
of ‘phenotypic similarity’ between two lines is generally estimated by comparing mean values of the characters, but a more sensitive method was preferred here. Values of the eight characters studied were standardized (according to Eq. (2), see Section 2) for all the individuals of all the lines. By this transformation, it was possible to
compare individuals simultaneously for all their characters independently of their real value. All the 15 samples from each line were ranked ac-cording to their total weight. The 13 largest plants (there was only 13 individuals in line 10) were considered. For each couple of lines, the 104 standardized values for the 13 individuals ranked according to their total weight were plotted
to-Fig. 2. Relationship between connectance and variability. Co-efficient of variations calculated for each parameter and each line (Table 1) have been plotted as a function of the corre-sponding connectance value (Table 2). A significant, positive correlation is observed (r=0.412,PB0.001, 46 df). Data have been separated as a function of the connectance value of 0.5 (circles for lower values and triangles for upper values) in order to illustrate the negative relationship existing for connec-tance values lower than 0.5.
G.N.Amzallag/BioSystems56 (2000) 1 – 11 7
Fig. 5. Coordination in connectance fluctuations. For each couple of parameters, the connectance calculated for each line (Table 2) has been plotted and the r-coefficient calculated. Continuous line: significant correlation at PB0.05; dashed line: significant correlation atPB0.10. No line is represented ifP\0.10.
inter-individual diversity in connectance. The mode of calculation used in this study prevents any possibility to calculate connectance for each individual and to analyze its variation within a line. However, lability in connectance of a charac-ter may be estimated by its between-line fluctua-tions. For example, the low S.D. observed for connectance of stem height suggests that it is less labile than that measured for leaf weight (Table 2).
For each character, the CV and the correspond-ing connectance calculated for each line were plot-ted together. The r-coefficient of this correlation was considered as an estimation of the link be-tween connectance and variability in expression of the character. This r-coefficient was plotted as a
Table 3
Phenotypic and connectance comparisons between the six lines considereda
Connectance Couple Phenotypic
of lines comparisons comparisons 0.312
10 30 0.187 0.501
0.446
10 45 0.283
20 0.334
15 0.947
15 25 0.336 0.812
0.318 0.538
20 30 0.174 0.515
20 45 0.127 0.538
0.058 0.531
30 25
25 45 0.288 0.450
0.574
45 0.088
30
26
df 102
aFor each line, 28r-coefficients are calculated by
correlat-ing values for all the possible couples of the eight parameters studied. The z-transformation of the absolute value of these
r-coefficients (see Section 2) has been calculated. The similarity between two lines is estimated by plotting the corresponding
z-values and calculating ther-coefficient (26 df) for the linear regression. The phenotypic comparisons have been calculated by plotting together the standardized values of all the eight characters measured for 13 individuals of each line, ranked according to their shoot DW. The r-coefficient calculated between two corresponding sets of data (102 df) provides an estimation of the phenotypic similarity between the lines.
gether. The r-coefficient for the linear regression between these two sets of standardized values was considered as an estimation of the phenotypic similarity between the two compared lines. This analysis was performed for all the possible cou-ples of the six lines studied. Different levels of phenotypic similarity are observed (Table 3).
The between-line levels of similarities in connec-tance and in phenotype were compared. A posi-tive correlation was observed (Fig. 3). This suggests that connectance is not only a noise in expression of pre-existing information, but that it also influences the development in an oriented way.
3.4. Connectance and indi6iduality
function of the S.D. of connectance for the same character (Table 2). A positive relationship is observed below a certain level of lability in con-nectance (about 0.18, see Fig. 4). This suggests that, below a critical value of lability, expression of a character is controlled by its connectance. The link between connectance and variability pro-gressively decreases beyond this critical value (Fig. 4). This suggests that an increased lability in connectance reduced its involvement in character expression, which became probably mainly deter-mined by a pre-existing information.
3.5. Control of lability in connectance
The determining influence of connectance in expression of a character seems conditioned by its lability (Fig. 4). Thus, it may be asked whether connectance itself is the expression of a pre-exist-ing information (which is also perturbed by noise) or is an ‘autonomous factor’ involved in pheno-type expression. This point was investigated by comparing between-line variations in tance. For each couple of characters, the connec-tances calculated for each one of the six lines considered (Table 2) were plotted together and the
r-coefficient was calculated. This measurement provides an estimation of the interdependency in connectance variations. Connectance varies inde-pendently for some characters (especially stem height and fertility) but is strongly related for other (such as spike weight, seed weight or num-ber of seeds) (Fig. 5). When compared with Table 2, it appears that lability of a connectance is related to its level of interdependency, suggesting that it is controlled by the structure of the network.
4. Discussion
4.1. The self-associated dimension of de6elopment
Reproductive development is more stable than vegetative development in plants (Hueter, 1969; Sherry and Lord, 1996). Berg (1959) related this enhanced stability to an increase in interdepen-dency in expression of the floral characters, as
compared with the vegetative ones. This observa-tion was confirmed by the fact that flowers polli-nated by insects, which are especially stable in their structure, are more intercorrelated in their development than wind-pollinated flowers (Berg, 1960). Accordingly, it seems that connectance is involved in precise expression and reliability of complex patterns in development. The positive relationship observed here between the pheno-typic and connectance levels (Fig. 3) strengthens this assumption. However, the situation is more complex than initially assumed. Connectance seems directly involved in expression of a charac-ter only below a critical level (Fig. 4) which is conditioned by its stability (Fig. 5 and Table 2).
Chauvet (1993) considered that stability of a system is globally increased by enhancing the level of self-association. However, this phenomenon is far from being continuous. Gardner and Ashby (1970), as well as May (1972), have described a sudden drop in stability of interrelated systems beyond a certain value of connectance. They also showed that this critical destabilizing value de-pends on the number of interrelated parameters.
Experimental measurements indicate that con-nectance is not a constant function during devel-opment. It increases towards adult stages of development (Riska, 1986; Stearns and Kawecki, 1994). However, as shown in S. bicolor, sudden drops are also observed during critical transition phases (Amzallag, 1999a). As a consequence, con-nectance may be a central factor for expression of a character which suddenly becomes a disturbing noise, and reciprocally. This consideration indi-cates that development is not a linear phe-nomenon. There are some phases with high levels of genotypic expression, and others in which this dimension is considerably reduced because of the spontaneously emerging properties of the develop-mental network.
hy-G.N.Amzallag/BioSystems56 (2000) 1 – 11 9
brids and parental generations in plants, Grant (1979) concluded that fluctuations in relationship are unpredictable. This evidence suggests that there is no simple genetic control of connectance. This conclusion is shared by Trewavas and Malho (1997) and assumes that the connective network enabling complex integrated responses in plants results from cell-to-cell communications during development. During differentiation, it is both generating and generated by the emerging individ-uality at the cellular level (Trewavas, 1999). This network of relationships, also observed between organs in the whole organism in development, is not simply controlled. It depends both on the interaction between local and general hormonal regulation (Amzallag, 1999c), and on adaptive adjustment of the sensitivity of the cell to its own environment (Trewavas, 1987; Csaba, 1994; Amzallag, 1999d). All these considerations confirm that the metacellular network is not di-rectly determined by pre-existing information, but that it is an expression of the self-organization dimension of development. Thus, although related to genetic expression, connectance may be consid-ered as an autonomous dimension in development.
4.2. Towards a new definition of the phenotype
It is generally assumed that phenotypic and genotype variations are strongly related (Chev-erud, 1988). However, this opinion was challenged by Willis et al. (1991), who noticed that a corre-spondence may exist for simple traits but not for complex developmental, adaptive and behavioral characters. A phenotypic plasticity is generally observed in expression of these traits.
Phenotypic plasticity, which is generally adap-tive, is considered as resulting from complex envi-ronment – genotype interactions during gene expression, which generate a specific ‘phenotypic landscape’. This interpretation does not disprove the deterministic model of control of the pheno-type by the genopheno-type, but it considerably compli-cates it. Furthermore, the present results show an even more complex situation, because the network of relationship may be determinant for develop-ment (Figs. 1 and 3), and those through criteria of
stability which are determined by the network itself (Gardner and Ashby, 1970). The reliability of this self-generated information is conditioned by thermodynamic considerations relative to adaptability of open systems (see Section 1) rather than accurate expression of a pre-existing program.
Involvement of a new dimension does not elim-inate the crucial role of gene expression during critical periods of development, but it generates a new interpretation: proteins produced by specific cells during precise phases of development may be involved in macrodevelopmental events through: (1) a stimulation and/or control of expression of further specific genes, generating a precise spatio-temporal pattern of protein production which di-rectly controls the developmental event; (2) induction of a local perturbation, which is espe-cially efficient because it occurs during a transi-tion phase of extremely high sensitivity to perturbations. In this latter case, the developmen-tal network is adaptively modified so that a new developmental pattern is spontaneously emerging. These two modes of action of gene expression are not mutually incompatible but rather complemen-tary, and those at different scales of biological organization. The negative relationship between connectance and heritability (Fig. 1) may be inter-preted as an expression of this complementarity.
Accordingly, morphogenesis results from intri-cate interferences between a deterministic interac-tion between environment and genetic expression and a self-organized dimension generated by the development itself. This latter is characterized by high sensitivity to environmental information (ex-ternal or generated by cellular productions), adaptability, and emergence of discrete states of stability. Although this second dimension is not deterministic, it may be ‘predictable’ through the ability of self-organized structures to reach the minimal free-energetic status.
4.3. E6olutionary consequences
causes and effects. This straightforward genotype/
phenotype correspondence enables interpretation of evolution in Darwinian terms. However, a low heritability is frequently observed in development, behavioral and life-history traits (Atchley 1987; Price and Schluter 1991), and heritability is even reduced for organisms exposed to unfavorable environments (Gebhardt-Henrich and van Noord-wijk, 1991; Larsson, 1993). Moreover, self-organi-zation is involved in emergence of properties which are crucial for survival in a perturbed envi-ronment. For example, in S. bicolor exposed to salinity, the mode of osmo-regulation (Na-includ-ers or Na-exclud(Na-includ-ers) is not the simple expression of a pre-existing information but it is generated by self-organizing processes (Amzallag, 1999b). Together with lack of a direct genotype/ pheno-type relationship in development (see Section 1) this evidence suggests that the Darwinian model of evolution is an abusive oversimplification. De-velopment is not operating in a one-dimensional axis (the genotype axis). An organism in develop-ment evolves in a three-dimensional space, in which genetic information is the first axis, con-nectedness of self-organizing processes is the sec-ond, and dynamics of time (involving non-linear processes between locally asynchronous time and globally synchronous time, see Matsuno, 1998) is the third axis which enables integration of the two first axes. Coexistence of these three axes enables non-deterministic but reliable integration of envi-ronmental and pre-existing information, as well as a spontaneous increase in complexity during development.
According to these considerations, the central question in evolutionary studies is not to test the validity of models integrating fitness, heritability and natural selection after assuming a direct link between genotype and phenotype. The first prob-lem is rather to estimate the relative importance of self-organizing and genetic dimensions in pro-cesses affecting the organism as a whole, such as macrodevelopment, integrative physiology, life-history and behavior.
The contribution of these two dimensions and their time-scale integration is not equivalent throughout development. Transition phases in de-velopment seem more influenced by self-organized
processes than phases of quantitative growth. Be-cause of the correspondence between ontogeny and phylogeny, it is likely that archaic and recent species do not display the same level of self-orga-nized and pre-existing information in their devel-opment. In this case, the relative involvement of self-organization in development, and its quantifi-cation through connectance, may open new per-spectives in our understanding of the dynamics of evolution, in morphogenetic creativity and in adaptability of the living organisms.
References
Alberch, P., 1980. Ontogenesis and morphological diversifica-tion. Am. Zool. 20, 653 – 667.
Amzallag, G.N., 1998. Induced modifications in reproductive traits of salt-treated plants ofSorghum bicolor. Isr. J. Plant Sci. 46, 1 – 8.
Amzallag, G.N., 1999a. Adaptive nature of the transition phases in development: the case ofSorghum bicolor. Plant Cell Environ. 22, 1035 – 1041.
Amzallag, G.N., 1999b. Individuation on Sorghum bicolor: a self-organized process involved in physiological adaptation to salinity. Plant Cell Environ. 22, 1389 – 1399.
Amzallag, G.N., 1999c. Regulation of growth: the meristem network approach. Plant Cell Environ. 22, 483 – 493. Amzallag, G.N., 1999d. Plant evolution: towards an adaptive
theory. In: Lerner, H.R. (Ed.), Plant Response to Stresses: From Hormone to Genome Reorganization. Marcel Dekker, New York, pp. 171 – 245.
Amzallag, G.N., Nachmias, A., Lerner, H.R., 1998. Influence of the mode of salinization on the reproductive traits of field-grown progeny inSorghum bicolor. Isr. J. Plant Sci. 46, 9 – 16.
Atchley, W., 1987. Developmental quantitative genetics and the evolution of ontogenies. Evolution 41, 316 – 330. Barton, N.H., Turelli, M., 1989. Evolutionary quantitative
genetics: how little do we know? Annu. Rev. Genet. 23, 337 – 370.
Berg, R.L., 1959. A general evolutionary principle underlying the origin of developmental homeostasis. Am. Nat. 93, 103 – 105.
Berg, R.L., 1960. The ecological significance of correlation pleiades. Evolution 14, 171 – 180.
von Bertalanffy, L., 1950. The theory of open systems in physics and biology. Science 111, 23 – 29.
Bradshaw, A.D., 1965. Evolutionary significance of pheno-typic plasticity. Adv. Genet. 13, 115 – 155.
G.N.Amzallag/BioSystems56 (2000) 1 – 11 11 Cheverud, J.M., 1988. A comparison of genetic and
pheno-typic correlations. Evolution 42, 958 – 968. Conrad, M., 1983. Adaptability. Plenum, New York. Conrad, M., 1990. The geometry of evolution. BioSystems 24,
61 – 81.
Csaba, G., 1994. Phylogeny and ontogeny of chemical signal-ing: origin and development of hormone receptors. Int. Rev. Cytol. 155, 1 – 48.
Gardner, M.R., Ashby, W.R., 1970. Connectance of large dynamic (cybernetic) systems: critical values for stability. Nature 228, 784.
Gebhardt-Henrich, S.G., van Noordwijk, A.J., 1991. Nestling growth in the great tit. 1. Heritability estimates under different environmental conditions. J. Evol. Biol. 3, 341 – 362.
Grant, V., 1979. Character coherence in natural hybrid popu-lations in plants. Bot. Gaz. 140, 443 – 448.
Hiett, P.J., 1999. Characterizing critical rules at the edge of chaos. BioSystems 49, 127 – 142.
Hueter, C.A., 1969. Constancy of the pentamerous corolla phenotype in natural populations ofLinanthus. Evolution 23, 572 – 588.
Ito, K., Gunji, Y.P., 1997. Self-organized marginal stability resulting from inconsistency between fuzzy logic and deter-ministic logic: an application to biological systems. BioSys-tems 41, 179 – 190.
Larsson, K., 1993. Inheritance of body size in the barnacle goose under different environmental conditions. J. Evol. Biol. 6, 195 – 208.
Lewontin, R.C., 1974. The analysis of variance and the analy-sis of causes. Am. J. Hum. Genet. 26, 400 – 411.
Matsuno, K., 1998. Dynamics of time and information in dynamic time. BioSystems 46, 57 – 71.
May, R.M., 1972. Will a large complex system be stable? Nature 238, 413 – 414.
Moran, G.F., Marshall, D.R., Muller, W.J., 1981. Phenotypic variation and plasticity in the colonizing speciesXanthium strumarumL. Aust. J. Biol. Sci. 34, 639 – 648.
Price, T., Schluter, D., 1991. On the low heritability of life-his-tory traits. Evolution 45, 853 – 861.
Prigogine, I., Wiame, J.M., 1946. Biologie et thermody-namique des phe´nome`nes irre´versibles. Experentia 2, 451 – 453.
Riska, B., 1986. Some models for development, growth and morphometric correlations. Evolution 40, 1303 – 1311. Seligmann, H., Amzallag, G.N., 1995. Adaptive determinism
during salt-adaptation inSorghum bicolor. BioSystems 36, 71 – 77.
Sherry, R.A., Lord, E.M., 1996. Developmental stability in flowers of Clarkia tembloriensis (Onagraceae). J. Evol. Biol. 9, 911 – 930.
Sokal, R.R., Rohlf, F.J., 1981. Biometry, 2nd edn. W.H. Freeman, San Francisco, CA.
Stearns, S.C., Kawecki, T.J., 1994. Fitness sensitivity and the canalization of life-history traits. Evolution 48, 1438 – 1450. Sultan, S.E., 1987. Phenotypic plasticity and plant adaptation.
Acta Bot. Neerl. 44, 363 – 383.
Sultan, S.E., 1992. Phenotypic plasticity and the neo-dar-winian legacy. Evol. Trends Plants 6, 61 – 71.
Trewavas, A., 1987. Sensitivity and sensory adaptation in growth substance responses. In: Hoad, G.V., et al. (Eds.), Hormone Action in Plant Development. Butterworth, Lon-don, pp. 19 – 37.
Trewavas, A., 1999. The importance of individuality. In: Lerner, H.R. (Ed.), Plant Response to Stress: From Phyto-hormones to Genome Reorganization. Marcel Dekker, New York, pp. 27 – 42.
Trewavas, A.J., Malho, R., 1997. Signal perception and trans-duction: the origin of the phenotype. Plant Cell 9, 1181 – 1195.
Waddington, C.H., 1942. Canalization of development and the inheritance of acquired characters. Nature 150, 563 – 565. Warburton, F.E., 1955. Feedback in development and its
evolutionary significance. Am. Nat. 89, 129 – 140. Willis, J.H., Coyne, J.A., Kirkpatrick, M., 1991. Can one
predict the evolution of quantitative characters without genetics? Evolution 45, 441 – 444.