DEFORMATION MONITORING OF MATERIALS UNDER STRESS IN LABORATORY
EXPERIMENTS
D. Skarlatos a, *, S. Yiatros a
a CUT, Civil Engineering and Geomatics Faculty, BO Box 50329, 3603, Limassol, Cyprus (dimitrios.skarlatos,
Stylianos.yiatros)@cut.ac.cy
Commission V, WG V/1
KEY WORDS: Deformation analysis, material testing, load test, close range photogrammetry, multi camera, image matching
ABSTRACT:
Photogrammetry is a valid alternative solution to linear variable differential transformer (LVDT) measurements in structural testing in laboratory conditions. Although the use of LVDTs boasts a high degree of accuracy, on the other hand it is limiting as it offers measurements between two points and it thus might be unable to capture localized deformations and strains over a bigger area of a structural specimen. In this aspect photogrammetry seems to offer certain advantages. Commercial solutions provide limited testing envelopes, while on the other hand, the wide range on new materials need more versatile techniques. Based on the need to develop an in-house photogrammetric toolbox to support several structural and material experiments in the department Advanced Pore Morphology (APM) aluminium foam specimens developed at Fraunhofer IFAM in Germany and cured at CUT, were tested under monotonic compressive load. Data acquisition, analysis and results, along with lessons learnt from the process are presented in this work.
1. INTRODUCTION
Phogrammetric techniques have a broad potential for measurement tasks in civil engineering structures and material testing (Maas, Hampel, 2006). In particular, for material testing the use of strain gauges or other localized techniques for capturing strains and failures locations are hindered due to the size and porous structure of some materials. Therefore, a remote sensing method such as photogrammetry offers a more versatile solution in monitoring the structural behaviour of a specimen, following the strain distribution across the whole specimen, pinpointing locations of local failure and validating the position of the crosshead of the testing rig.
1.1 Aim
Early experience with deformation monitoring using photogrammetry clearly indicates advantages over traditional linear variable differential transformer (LVDT), such as three dimensional measurements, unrestricted measurement range and immunity to nonlinear systematic errors (Whiteman, et al., 2002). Strain gauges and inductive displacement transducers are incapable of measuring many points (Hampel, 2010, Tsakiri, et al., 2004). Low cost setup, versatility and potential of high precision (Maas and Hampel, 2006) along with ability to monitor large structures (Detchev et al., 2011), whether in the lab or on site (Albert et al., 2002), offer a clear edge to close range photogrammetric techniques. The possibility of automating the whole process and having an evaluation of precision though least squares (Detchev, et al. 2011), brought photogrammetry a step closer to structural monitoring and material testing.
* Corresponding author
Effects such as lateral drift or rotations of the tested specimen during the experiment, may be parasitic with traditional methods, but photogrammetry may overcome such problem (Caperan et al., 2012). Nevertheless, real time monitoring using photogrammetry is hard to achieve. Some photogrammetric commercial solutions allow for real time measurements, but on the other hand have a very small testing envelope.
In addition, photogrammetry also produces more noise over measurements (Albert et al., 2002), in comparison to other techniques, especially in natural points, where reliability deteriorates.
2. THEORY 2.1 Previous work
Considerable work has been seen in the field of deformation monitoring using photogrammetry, varying from simple 2D free network approach (Albert et al., 2002) to crack monitoring and from laboratory tests to on site bridge (Albert et al. 2002) or reservoir walls (Maas, 1998) deformation monitoring.
Whiteman et al. (2002) compares LVDT deflection measurements over a pre stressed concrete beam, against photogrammetric ones. Retro reflective targets were positioned on the 7.6m x 0.29m x 0.6m beam. Australis software was used or the camera calibration and photogrammetric calculations. Although the stereo video cameras used, had a very low resolution of 768 x 574 pixels, the reported accuracy was 0.24mm on the vertical axis of interest. Comparison of photogrammetry and LVDT was satisfactory and shows close agreement, as the low resolution cameras do not allow for a direct comparison.
Albert et al., (2002) have tested on site, an old concrete bridge photogrammetric results displayed significant noise and a standard deviation of 0.1 - 0.2 mm, authors were content with the acquired accuracy using such a simple set up, while proving the potentials of the method.
Tsakiri et al. (2004) monitored 140 targets over a 1.5m x 0.14m x 0.07m timber beam under deflection loading. Five epochs were captured under load, while 17 targets were fixed on stable components to act as photogrammetric control points. A single Sony DSC-F707 CCD camera was used during pauses of the loading experiment to capture 7 photos with 70% overlap and two oblique photos. Each epoch was treated as a block and aerial triangulation was performed to calculate three dimensional coordinates on the pre-signalized targets. Both self-calibration and pre-calibration of the camera was performed, revealing similar results. Self-calibration approach was finally selected. Bundle adjustment measurements were performed manually and the final coordinates of the targets as calculated by BINGO were estimated 2.0 mm on average.
Lee et al., (2008), followed a 2D approach to measure 1500 targets on a 6 m T-beam under shear test. The attained precision was 0.06 mm and the experiment was focused on near real time crack detection and measuring over 12 epochs.
Detchev et al. (2011), implemented a seven camera setup on top of a 3m concrete beam under deflection loading test. Cameras were pre-calibrated and their exterior orientation was considered stable during the experiment. Aluminium bars with targets were attached on the bottom of the beam, in order to overcome the difficulty to observe the upper part, where the hydraulic actuator was applying force to the beam. Photogrammetric measurements were compared with 1D laser transducers, revealing differences of 0.3mm to 0.4mm.
Marcis et al., (2011) have used a five camera rig to capture the deformations of a metal joint in a rhombic reinforced system. Photomodeler software was used to create and automatically track 38 coded targets along the epochs. Photos from Nikon D200 and a Nikkor 20mm lens were captured during regular 1-2 min test pauses, using time trigger to avoid any vibrations. Acclaimed accuracy reached 0.1 mm.
Chounta and Ioannidis (2012) have used CMOS synchronised stereo camcorders to calculate three dimensional displacement of 34 targets over a reinforced concrete beam, over 31 loading epochs. The targets were covering an area of approximately 0.7m x 1.0m over the reinforced concrete beam. Automatic target detection was achieved and correlation and adaptive least square image matching were used to follow targets across the epochs. The estimated accuracy of target localization was 0.5-1mm in object space.
Caperan et al., (2012) tested a hybrid composite 14.07m x 2.5m x1.55m beam. The field of view of the stereo rig was limited to 6m and the object pixel size was 4 mm. Three dimensional displacements were monitored by targets and painted texture patterns. Photogrammetric measurements were compared with traditional sensors, showing good correlation. Optical distortions of up to 18 pixels were corrected using a large chessboard and Bouguet’s calibration toolbox (2007). Template image matching was used for tracking points along the epochs and across the images. The attained accuracy was 1/50 of the pixel size. Noise on the photogrammetric measurements is still noticeable, although very limited.
Detchev et al., (2014) have used eight Canon EOS 1000D zoom lens cameras and a projector to measure parts of a concrete beam under load. Five laser transducers were used as control sensors. Internal precision of results was 0.03 mm implying a 0.1mm accuracy, which was certified by the laser transducers with 10-30 μm accuracy, where photogrammetric measurements had RMSE of 0.06 mm. Additionally, the authors tested different shutter speeds against ISO settings, where the ISO priority proved to be more important than speed, over such slow experiments with speed of a couple mm every minute.
2.2 Scope
Despite the fact that significant work has been already done over deformation monitoring using photogrammetry, there are still several aspects that need to be addressed. In fact, the potential of photogrammetry in material testing is by far not yet exploited (Mass and Hampel, 2006).
Deformation monitoring applies either on a limited number of pre signalised targets, or a significant number of points selected from a random pattern painted over the object. In all cases, an image matching algorithm is used to automatically trace the points along the epochs, hence automatically locating and measuring the same point in several photos. Natural targets are not reported in such tests, as image matching techniques might fail in poor texture areas. Our work tries to overcome such problems, as the use of pre-signalised targets in such small specimens is impossible. Therefore, natural targets are manually selected in epoch 0 and then automatically traced along the epochs. Once the targets are manually selected, automatically tracking them across epochs should be an easy task based on the assumption that there are no large deformations and displacements among epochs.
Triggering and synchronising the cameras to each other as well among other instrumentation is not a trivial task, which is better addressed by Caperan et al., (2012).
2.3 The material
The Advanced Pore Morphology (APM) metal foam (Baumeister et al, 2007) specimen tested, is a hybrid metal foam comprising aluminium foam spheres produced by powder metallurgy methods at Fraunhofer IFAM in Bremen, Germany and coated with a thermosetting adhesive. Metal foams, while thought of as novel materials, they have been first conceived in the 1920’s while evidence of their successful production is found in the 60s in the United States (Banhart 2015). Ashby et al (2000) offers a comprehensive review of contemporary techniques to produce metal foams including some basic design applications, while more recently Szynisewski et al (2012) reported an extensive review of metal foam types, existing and potential applications. Metal foams are a special category of porous metals that boast low weight and high energy absorption with usual metallic properties such as ductility.
3. METHODOLOGY
3.1 Camera set up
Three DSLR Nikon D90 cameras with a Nikkor 24 mm fixed lens were used for the experiment. Cameras were pre calibrated using a chessboard and Bouguet’s (2007) calibration method and algorithm. Nikon D90 has an APS-C CMOS sensor, with 4288 x 2848 pixels and physical dimensions of 23.6 mm x 15.8 mm, resulting in a 5.5 μm pixel size. The camera object distance and the layout of the cameras was a trade off between focal length, anticipated accuracy, size of the specimens, relatively large size of the compression platens, minimum focusing distance, etc. The best possible setup was a horizontal one (fig. 1). Cameras were positioned at 0.5m from the sample surface with slightly convergent geometry, 10 degrees inwards, so that the specimens are imaged towards the center of the photo frame, in order to avoid high remaining radial distortion. At the same time this slight inclination provided further benefits since almost all control point targets were within frame. Camera principal distance as estimated in the calibration reports was on average 24.3mm, resulting in a 1:21 scale size over the sample distance and 0.113 mm pixel size over the object. Distance of camera to control points was 1.2m and distance between cameras (base) was 0.2m, as the cameras were positioned on the MENCI ZScan bar, with calibrated, predefined fixed positions.
Figure 1. Camera setup with respect to specimen, loading hydraulic press and lights. Axes marked are parallel to coordinate system established.
A rough analysis for the expected precision, should be made beforehand. Given the coordinate system axes and the camera axis, the precision of a 3D point on an otherwise perfect stereopair is given by,
, the accuracy of points along the camera axisH
, the flying height above the objectc
, the principal distanceB
, the base of the stereopairp
, the precision of measuring x-parallax.with values H=0.5 m, c=24.3 mm, base B=0.2 m. If half pixel size precision is attained in photo measurements, then σxy and σp equal to 2.75 μm and 3.87 μm respectively, and σΧΖ and σY are calculated from eq. 1 as 0.057 mm and 0.200 mm respectively. Image matching techniques have reported accuracy of up to 1/50 of pixel size (Hampel, 2010), on signalized targets. On natural points, the accuracy deteriorates, depending primarily on local texture. Scholars suggest 0.5 to 0.33 pixel size as an average expectancy of image matching in natural points, thus the aforementioned figures might improve to 0.037mm and 0.113mm respectively. By using triplets of images, these values are expected to further improve. It should be noted here that the load is applied over the Z axis, where the expected accuracy is estimated to vary between 0.057-0.037mm.
Figure 2. Full frame photo triplet; left, central and right.
3.2 Coordinate system and targets
The coordinate system selected for the experiment was a local geodetic one, with Z axis being vertical (fig. 1). Twelve artificial targets were measured using a Leica TS06Plus total station, with 1" angular accuracy and 2mm + 2ppm in reflector-less measurements, like the ones employed for the pre-signalised control points targets in the background (fig. 2). All total station measurements were taken from a single position, avoiding the need of traverse. The coordinate system was set up to be parallel to the wall featuring control points, hence the sample surface under investigation is not parallel to XZ plane, due to manual misalignment. Although photogrammetry allows for reestablishment of the coordinate system, this was not attempted here since it not sure whether the points over the sample surface form a perfect plane or not.
3.3 Experiment execution
The pilot experiment in question is based on BS EN ISO 13314:2011 “Mechanical testing of metals – ductility testing – compression test for porous and cellular metals”.
X Z
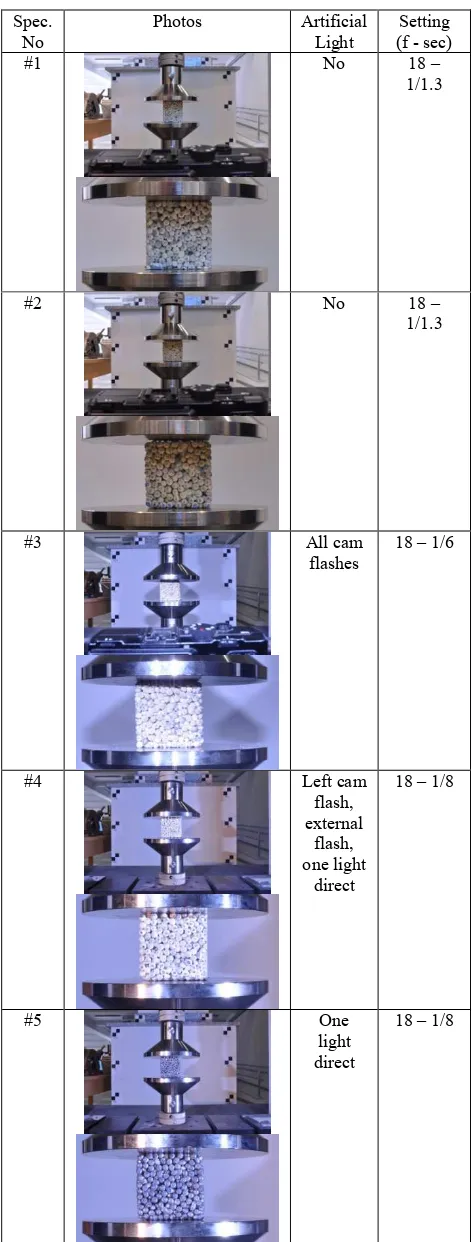
Spec. No
Photos Artificial Light
Setting (f - sec)
#1 No 18 –
1/1.3
#2 No 18 –
1/1.3
#3 All cam
flashes
18 – 1/6
#4 Left cam
flash, external
flash, one light
direct
18 – 1/8
#5 One
light direct
18 – 1/8
Table 1. Lighting and camera settings
The uniform colour of the specimens’ spheres was a major problem for photogrammetric processing. Image matching techniques, both correlation and Adaptive Least Squares Matching (ALSM) would fail in areas with uniform colour (Mikhail et al., 2004) and therefore some artificial pattern should be applied. The side of the specimen in front of the cameras was pressed against an ink stamp pad. to create dots over the spheres, which in return had some pattern and enough information for the image matching algorithms (table 1) to work successfully. Five APM specimens were tested under various conditions, including displacement speed and lighting (table 1). Low lighting conditions lead to slow shutter speed, which in return may lead to motion blur (spec. 1 and 2, table 1). Strong lights would allow for a faster shutter speed to avoid motion blur, but may lead to hard shadows (spec. 3, table 1) or loss of detail and washed out markers (spec. 3 and 4). In case of dark spheres (spec. 5, table 1), a different approach is needed with white markers over the predominately black specimen. The latter one wasn’t processed photogrammetry due to poor photographs and lack of texture. The cameras were synchronised using an electronic remote shutter hub, where one button simultaneously triggers all three cameras. The first epoch (0) was captured without any load and the upper platen slightly touching the specimen. After that the electronic press began compressing the specimen and the epochs were captured using manual triggering, based on time. One epoch was recorded every one minute, or roughly every 0.5 mm, as the load was applied using displacement control at a constant speed of 0.5 mm/min. It is expected though, that there should be discrepancy both at the start of the experiment (epoch 0, with no load at all) and along the epochs, as they were not electronically synchronized.
4. PROCESSING AND RESULTS
4.1 Data processing
For image processing a modified method of Chounta and Ionnidis (2012), was utilized (fig. 5 and 6). The exterior orientations were manually measured over the first triplet of epoch 0. The manual measurements were refined using Adaptive Least Square Matching (ALSM) and an artificial template simulating the targets. Photogrammetric resection was used to calculate exterior orientation values and estimate standard deviations of unknowns. Although the cameras were stable during the execution of the experiments, and the triggering was done electronically, it cannot be deduced that they were not moved unintentionally. Therefore, the matches were automatically transferred to the next triplet as initial values and automatic target measurement using ALSM was repeated. Over each photo, an independent photogrammetric resection was performed and compared to epoch 0, with 99% confidence level. All epochs, over each specimen experiment, were compatible with epoch 0, hence the cameras were considered stable throughout the experiment and the EO of epoch 0, was used for all the rest triplets.
Figure 5. Exterior orientation calculation
Figure 6. Point transfer along cameras.
Correlation and ALSM using the main (central) camera as template to be matched to the left and right cameras, displayed large failure rates, because of the convergence angle in combination with the spheres’ depth and lighting conditions. Therefore, it was decided to adopt a different approach and transfer points along the epochs instead of across the cameras. This approach, although controversial, proved much more robust. After the initial manual measurements, which provide very good and reliable initial approximation for ALSM matching on epoch 0, the following point transfers were done along epochs. Hence, the points from the left camera on epoch 0, were transferred to left camera of epoch 1, etc.
4.2 Results
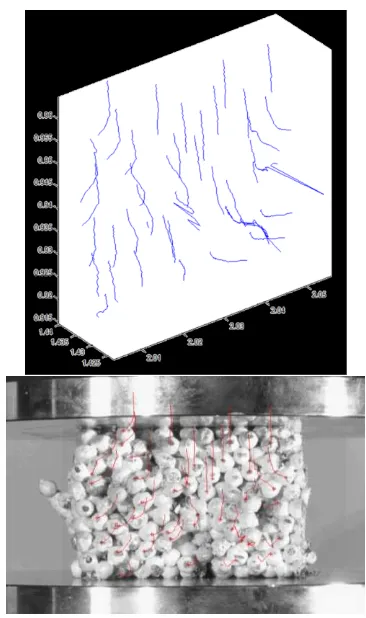
Final 3D coordinates of the points were calculated and plotted (fig. 7). Visual inspection, shows that there is consistency over the points’ trajectories, apart from two points, which indeed were separated from specimen’s main body after the limit point and loosely moving after that. Therefore, their movements were correctly traced by photogrammetry.
The average standard deviation of the 3D points calculated based solely on the geometry of the intersection, was 0.29, 0.10, 0.22
mm on axis X, Y, Z respectively. Hence over the load axis the estimated accuracy was 0.22 mm, which is four times worse than the expected values of 0.057 mm.
The trajectories (fig. 7) display a small amount of noise, as expected and suggested by the precision evaluation.
Figure 7. Three dimensional displacements of 41 points, over 24 epochs, in specimen 4 (above) and the trajectories of the marked points over the central cam, last epoch.
In order to validate photogrammetry, one point closely to upper platen, was selected for comparison purposes with the crosshead displacement due to its proximity.
Figure 8. Comparison of a single point’s vertical movement of the specimen, close to the top platen captured with photogrammetry and the crosshead displacement.
0 1 2 3 4 5 6 7 8 9 0
500 1000 1500 2000 2500 3000 3500
Displacement (mm)
L
o
a
d
(
N
)
Photogrammetry Crosshead Displacement
Manual measurements of control points’
targets in triplet, for epoch 0
Refinement of measurements using ALSM
Transfer the targets’ pixel
coordinates on the next epoch Photogrammetric resection for exterior orientation calculation
Store EO and standard deviations
Repeat until last epoch
Manual measurements of selected points in each photo of the triplet, for epoch 0
Using central camera as template, refine manual measurements across cameras
using ALSM, epoch 0
Calculate intersection using
triplet, estimate standard deviations Transfer points, from each
camera to the next epoch, using correlation
Calculate intersection using
triplet, estimate standard deviations
Refine matches using ALSM and repeat until
The preliminary results show a good correlation between the crosshead and photogrammetric results, especially up to the limit point. The minor differences can be attributed to the manual triggering of the cameras and epoch 0, which doesn’t exactly correspond to the beginning of the experiment, and creates a visible step in the beginning of the photogrammetric measurements (fig. 8). Having sufficient data points throughout the surface of the specimen will lead to the development of strain maps throughout the surface of the specimen which can be used to calibrate numerical models.
5. CONCUSSIONS
Application of photogrammetry to material testing is very prominent technique, since size of the specimen is irrelevant to the method. Simple solutions regarding pattern application over the specimens, provide versatility to the method. Even preliminary results, without synchronization among cameras and electronic press, nor optimum equipment, undoubtedly proved that 3D reliable measurements are to be expected, at a fraction of the cost of commercial solutions. In addition, at such slow progress experiments, shutter speed is not significant for motion blur and image degradation.
On the other hand, several lessons were learnt and must be amended prior to fully implement this technique to more specimens or complex experiments. Synchronization of cameras and loading machine must be solved. Lenses with larger focal distance, will allow camera positioning to more favourable layout, both in terms of geometry, pixel size over the sample and allow for better positioning of lights for uniform conditions.
Collection of more epochs to reduce displacements will improve reliability of point transfer. More cameras may further improve accuracy. A full error analysis throughout the process, to fully investigate error propagation and provide reasonable precision results, should also be a scope of future work, as an internal measure of accuracy.
ACKNOWLEDGEMENTS
The authors would like to thanks Mr Marios Papayiannis, research student at CUT for preparing the APM samples.
REFERENCES
Albert, J., Maas, H. G., Schade, A., & Schwarz, W., 2002. Pilot studies on photogrammetric bridge deformation measurement. In Proceedings of the 2nd IAG Commission IV Symposium on Geodesy for Geotechnical and Structural Engineering, pp. 21-24.
Ashby, M.F., Evans, A.G., Fleck, N.A., Gibson, L.J., Hutchinson, J.W., Wadley, H.N.G., 2000. Metal foams: a design guide.
Butterworth-Heinemann.
Banhart, J., 2015. The long road to porosity. Plenary talk at MetFoam 2015, Barcelona, Spain.
Banhart, J., Seeliger, H.-W., 2008. Aluminium Foam Sandwich Panels: Manufacture, Metallurgy and Applications. Advanced Engineering Materials 10, pp. 793–802.
Baumeister, J., Rausch, G., Stöbener, K., Lehmhus, D., Busse, M., 2007. Verbundwerkstoffe mit Aluminiumschaum –
Anwendungen im Schienenfahrzeugbau. Materialwissenschaft und Werkstofftechnik 38, pp. 939–942.
Bouguet, J., Y., 2007. Camera calibration toolbox for MATLAB, http://www.vision.caltech.edu/bouguetj/calib_doc/
index.html#parameters, visited 30.11.2015
Capéran, P., Poljanšek, M., Gutiérrez, E., Primi, S., Paulotto, C., 2012. Optical 3-dimensional measurements on a FRP beam tested at serviceability limit. Composite Structures, 94(12), pp. 3465-3477.
Chounta, I., Ioannidis, C., 2012. High accuracy deformation monitoring of a concrete beam using automatic photogrammetric techniques. FIG Working Week “Knowing to manage the
territory, protect the environment”, Rome, Italy, 6-10 May, 2012.
Detchev, I., Habid, A., El-Badry, M., 2011. Case study of beam deformation monitoring using conventional close range photogrammetry. ASPRS annual conference, Milwaukee, Wisconsin, May1-5, 2011.
Detchev, I., Habid, A., He, F., El-Badry, M., 2014. Deformation monitoring with off-the-self digital cameras for civil engineering fatigue testing. The International Archives of Photogrammetry, Remote Sensing and Spatial Information Sciences, Vol. XL-5, 23-25 June, Riva del Garda, Italy, pp. 195-202.
Hampel, U., 2010. Crack detection during load tests in civil engineering material testing with digital closed range photogrammetry – algorithms and applications. In: The International Archives of the Photogrammetry, Remote Sensing and Spatial Information Sciences, Newcastle upon Tyne, UK, Vol. XXVIII, Part 5, Com. V Symposium, pp. 268-271.
Lee, T., K., Al-Mahaidi, R., 2008. An experimental investigation on shear behaviour of RC T-beams strengthened with CFRP with photogrammetry. Composite Structures 82(2), pp. 185-193.
Maas, H., 1998. Photogrammetric techniques for deformation measurements on masonry reservoir walls. In Proceedings of IAG Symposium on Geodesy for Geotechnical and Structural Engineering, Eisenstadt, Austris, pp. 319-324.
Maas, H-G., Hampel, U., 2006. Photogrammetric techniques in civil engineering material testing and structure monitoring.
Photogrammetric Engineering & Remote Sensing 72(1), pp. 39-45.
Marcis, M., Frastia, M., 2011. Measuring deformations of steel column using convergent photogrammetry. INGEO, 5th
International Conferenceon Engineering Surveying, Brijuni, Croatia, 22-24 Sept, pp. 211-218.
Mikhail, E., M., Bethel, J., S., McGlone, J. C.,2004. Manual of photogrammetry (5th ed). American Society of Photogrammetry and Remote Sensing, Bethesda, USA, pp. 1151.
Smith, B.H., Szyniszewski, S., Hajjar, J.F., Schafer, B.W., Arwade, S.R., 2012. Steel foam for structures: A review of applications, manufacturing and material properties. Journal of Constructional Steel Research 71, pp. 1–10.
Tsakiri, M., Ioannidis, C., Papanikos, P., Kattis, M., 2004. Load testing measurements for structural assestment using geodetic and photogrammetric techniques. 1stFIG International symposium on
enginnering surveys for construction works and structural engineering, Nottingham, UK, 28 june – 1 July, 2004.
Whiteman, T., Lichti, D., D., Chandler, I., 2002. Measurement of deflections in concrete beams by close range digital photogrammetry. ISPRS Com IV Symposium: Geospatial theory, processing and applications. IAPRS Volume XXXIV, Part 4.