* Corresponding author.
PRODUCT ACCURACY EFFECT OF OBLIQUE AND VERTICAL NON-METRIC
DIGITAL CAMERA UTILIZATION IN UAV-PHOTOGRAMMETRY TO DETERMINE
FAULT PLANE
C. Amrullah 1*, D. Suwardhi 1, 2, I. Meilano 1,3
1 Geodesy and Geomatics Engineering, Faculty of Earth Science and Technology, Institut Teknologi Bandung, Indonesia ([email protected])
2 Remote Sensing and Geographic Information Science Division ([email protected]) 3 Geodesy Division ([email protected])
Youth Forum
KEY WORDS: UAV-Photogrammetry, DEM, Oblique and Vertical Camera, Accuracy, Fault Plane.
ABSTRACT:
This study aims to see the effect of non-metric oblique and vertical camera combination along with the configuration of the ground control points to improve the precision and accuracy in UAV-Photogrammetry project. The field observation method is used for data acquisition with aerial photographs and ground control points. All data are processed by digital photogrammetric process with some scenarios in camera combination and ground control point configuration. The model indicates that the value of precision and accuracy increases with the combination of oblique and vertical camera at all control point configuration. The best products of the UAV-Photogrammetry model are produced in the form of Digital Elevation Model (DEM) compared to the LiDAR DEM. Furthermore, DEM from UAV-Photogrammetry and LiDAR are used to define the fault plane by using cross-section on the model and interpretation to determine the point at the extreme height of terrain changes. The result of the defined fault planes indicate that two models do not show any significant difference.
1. INTRODUCTION
UAV-Photogrammetry (Unmanned Aerial Vehicle Photogrammetry) describes a photogrammetric measurement platform, which operates remotely controlled, semi-autonomously, or semi-autonomously, without a pilot sitting in the vehicle. The platform is equipped with a photogrammetric measurement system, including, but not limited to a small or medium size still-video or video camera, thermal or infrared camera systems, airborne LiDAR system, or a combination thereof. (Eisenbeiss, 2009). UAV- Photogrammetry uses the non-metric camera as the air photo acquisition instrument having the problem with instability of photography product geometric accuracy (Udin and Ahmad, 2012).
To increase the accuracy, it is necessary to put oblique camera addition along with vertical camera in UAV-Photogrammetry. The main objective is to add the number of overlapped/overlapping photos and to add the angle in observing the objects, making the number of tie points in the shape of 3D point cloud. (Fritsch, et al.., 2011).
The distribution of ground control points at the survey area will have effect on the survey accuracy, time, and cost. If coordination of activities on the ground and in the air can’t be established due to inaccessibility or communication problems, or if it fails due to equipment breakdown, then application of conventional photogrammetry becomes a valuable option. The decrease of ground control points may be done without decreasing the accuracy level significantly. (Lembicz, 2006).
One of the products resulted by UAV- Photogrammetry is Digital Elevation Model (DEM) which can be used to distribute the active fault around the world (Horspool, et.al. 2011). The UAV- Photogrammetry DEM product can be used to analyse the
geomorphology of Lembang Fault. The Lembang Fault has considerable size and tremendous topography expression. This fault distance is only 15 km north of Bandung city and it is one of earth disaster sources in West Java. (Horspool, et.al. 2011).
2. METHOD AND DATA
2.1 Modern Photogrammetry
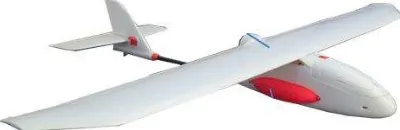
Considering the long-distance and long fly duration; weather resistance; manoeuvrability to the displacement path; the weight and dimensions of the camera taken as well as the research areas having dynamic contour shapes, this research uses the type of fixed-wing UAV (Eisenbeiss, 2009). Figure 1 shows you the picture of UAV fixed wing.
Figure 1 UAV fixed wing
UAV- Photogrammetry uses non-metric digital camera as the instrument for the aerial photograph acquisition. The Non-metric digital camera (Figure 2) has a problem in terms of geometry quality instability from the photographic products (Udin and Ahmad, 2012). To ensure the photographic product geometry quality to be maintained, a calibration procedure with non-metric cameras need to be done. (Wolf, 1974).
Figure 2 Non-metric camera (Canon power shot S110)
The desired oblique aerial photographs are oblique aerial photographs with the type of high oblique (Shufelt, 1999). Then, it is used the camera with mounting (Figure 3) angle 42º for the right camera and -42º for the left camera from the optical axis. It should be noted that the image scale variations are caused by the camera angle or tilt, on the side of the smaller angle, so the object on the ground will have diverse scale (Rupnik et al., 2014). There is also an image shift with variable size affected by high-flying, high-objects, a large of camera tilt, and shooting location. The image shift due to the slope is not found at its nadir and increases along with the radial distance from nadir (Wolf, 1974).
Figure 3 Oblique camera housing
2.2 Planning
The success of photogrammetry project depends highly on the planning. In commonly, the fly planning requires two things: mapping area equipped with the area planning map and fly specification including the resolution scale, fly high, overlap, side lap and others (Wolf, 1974). The specification of fly high is presented at
.
Table 1 Flight plan specification
Fly High 125 m and 250 m
GSD 125 m 0.050 m
250 m 0.100 m
Overlap 80%
Sidelap 60%
UAV maintains the size of GSD (Ground Sample Distance) by lowering and increasing the height flight at the change of ground level at the lowland areas, people dwellers, or high land.
To be able to increase the horizontal and vertical accuracy of the image, it is required some Control Points (Ground Control Point abbreviated as GCP and Check Point abbreviated as CP) distributed at the survey areas are required (Suradji, et al., 2010). The GCP and CP position determination can be used in the terrestrial (ETS, Electronic Total Station) or extra-terrestrial (GPS, Global Positioning System) methods. By looking at the required photo resolution, the GPS-RTK method is selected/used because/since it has position typical accuracy of 1-5 cm assuming the phase ambiguity can be set correctly. (Abidin, 2007). The control point distribution figure can be seen at the Figure 4.
Figure 4 Control point distribution
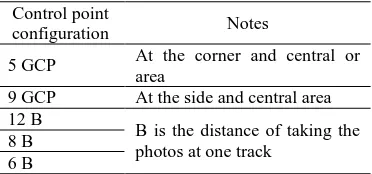
The distance between the horizontal and vertical control points is called the bridging horizontal distance (iho) and the vertical distance bridging (ive) with model base units (B). The GCP configuration used among others are 5 GCP on each corner and the central model; 9 GCP in the corner, side and central model; 6, 8 and 12 B; a test is then conducted with 21 tester points (Check Point abbreviated as CP). The GCP and CP are represented using Premark with the provisions shown in the photographs taken at the desired height.
2.3 Data Acquisition
Camera non-metric field calibration process starts with the acquisition of image calibration. The image calibration process is done using Agisoft Photoscan and the product is the value of calibration parameters (see Table 2).
Table 2 Calibration camera Canon S110 result Parameter Value Deviation Standard
Focal length c 5.334 mm 0.001 mm
x-shift X p 0.035 mm 0.001 mm
y-shift Y p -0.091 mm 0.001 mm
Radial and decentering distortion
K1 0.000 0.001
K2 0.000 0.001
K3 0.000 0.001
P1 0.000 0.001
P2 0.000 0.001
The Measurement of GCP and CP faces several challenges such ISPRS Annals of the Photogrammetry, Remote Sensing and Spatial Information Sciences, Volume III-6, 2016
communication signal blocked with hills; closed canopy on forest areas; and private estates which are not accessible. The GCP and CP measurement will give results from the total planning point measured: 96 points of GCP and 21 points of CP. The control point could measure at maximum 1 kilometre radius from base station for 5-10 minutes duration. The coordinate information is referring to the WGS'84 datum and the height reference system referring to the ellipsoid.
From the aerial photograph acquisition, it is produced four sets of aerial photo data and complement data, namely the coordinate data of UAV navigation path. The oblique and vertical photo image can be seen in Figure 5.
Figure 5 Oblique and vertical UAV aerial photo The characteristics of oblique photo are seen from the object side capture, for example, the building wall so as to provide another perspective of the objects in the 3D perspective while the vertical photo gives an overview of the top object so that the object is observed more completely.
From the aerial photograph data acquisition report, there are pretty much blurry photo in the vertical camera on the height flight of 125 m. The blurry image can reduce the number of tie points on the image matching process but it also can affect the GCP determination on the photos represented by Premark accurately and it can reduce the model photogrammetric accuracy generated (Sieberth, et al., 2014). In the same scenario, there is instability of UAV movement so that the resulting image density is uneven.
2.4 Digital Photogrammetry
The Digital photogrammetry process includes an aerial triangulation activity and 3D model development.
The aerial triangulation is positioning with the photo in general and applies to the aerial photos and close range photos. Furthermore, the aerial triangulation is also defined as a ground determination process from the field points and picture based on the measurement at photogrammetric base unit. This is done by simultaneous coordinate transformation process from a photographic coordinate system to a ground coordinate system (Wolf, 1974). The basic concept in aerial triangulation is an image matching principle, collinearity, resection, intersection, and the block adjustment.
In general, three-dimensional modelling using Agisoft Photoscan software is divided into four sections, namely align photos, build dense cloud, mesh build, and build texture.
The Align photo which is the automatic tie point generation process. It will tie acquisition point on the aerial photographs automatically. The tie point is used as the tie photo point so that two overlap images can form a model and then continue to align the image automatically. The illustration is in Figure 6.
Figure 6 Align photo result
This process is the follow up process from the aligned photos, by increasing the point cloud to be more closed. This can be done by lowering the window search at the image adjustment. The illustration can be seen in Figure 7.
Figure 7 Generating dense cloud
The build mesh process is the 3D model reconstruction process from overlapping photos. The objective of this process is to make an interpolation field in the shape of TIN (Triangular Irregular Network) from the point cloud extracted from the previous process. See Figure 8.
Figure 8 Build mesh
The build texture process is the process of giving the colour or tone at the formed interpolation model. This can be done by attaching the pixel into the photos above the interpolation field. There for, it can be seen the 3D model which represent almost the real condition.
2.5 Photogrammetry Products
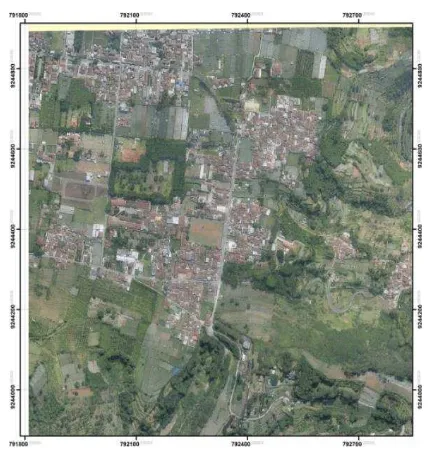
Orthophoto is the photography product showing the object in the true orthographic position; therefore giving the really vertical position. The basic different between map and Orthophoto is the presentation of the earth surface element presented; with map presenting symbols and lines. Orthophoto is resulted from perspective photo by a process called differential rectification, where it eliminates the effect of image shift referring to the photograph obliqueness and ground level relief (Wolf, 1974). The orthophoto result can be seen at Figure 9.
Figure 9 Orthophoto product
Digital Elevation Model (DEM) is a model showing the height value of each point at the model. DME shape is 3 dimensions because it includes the X, Y and Z coordinate system (Li, et.al. 2005). The possible application of DEM are flood area mapping, technical design and most importantly is for the geo-science interest in the analysis application of ground level, including the detail fault mapping (Horspool, et al., 2011). Figure 10 shows the DEM results.
DTM is a digital topographic model with separated or removed objects, such as vegetation and cultural elements, for example the building, leaving a ground level in the model. Meanwhile, DSM is a digital topographic model still includes the objects such as vegetation and cultural elements (ex. buildings) or others above the ground (Horspool, et al., 2011).
The basic concept of the slope base method is based on the observation that a large height difference between two points is probably due to a steep slope on the surface (Vosselman, 2000).
2.6 Defining the fault plane
Lembang Fault is one of the active faults elongated in Java, with a relatively large size and exceptional topographic expression, this fault is only 15 km at the north side of Bandung making the Lembang Fault into a source of terrestrial disaster. GPS survey and Lembang Fault modelling indicate a shift mostly occurring in the vertical component, which accounts for about 6 mm / year (Irsyam, et al., 2010).
The Light Detection and Ranging (LIDAR) is a technique involving an active sensor placed on the plane or helicopter. The precision location is determined using GPS Deferential and the high-flying determines the spatial resolution resulted. Most survey collects the laser signal of 1-5 return in one square meter which will generate DEM with a horizontal or spatial resolution of 0.5 to 2 meters. The vertical accuracy which can be achieved by the LIDAR on the airy and flat situation is recorded until 15 cm (Hodgson et al., 2003).
The fault plane can be identified by using DTM of the aerial photograph processing results. By using the DTM, we can identify the fault plane by viewing a cross-section from the existing model height. The fault plane can be identified by looking at the slope difference between the field levels at the model height. However, the operators must also be smart in defining the fault field because the operator must know the fault characteristics to be identified the fields. The illustrations related to the defining fault can be seen in Figure 11.
Figure 11 Fault determination
3. RESULTS AND DISCUSSION
3.1 Camera Scenario and Control Point Configuration Results
To meet the oblique camera position design and specification, the ISPRS Annals of the Photogrammetry, Remote Sensing and Spatial Information Sciences, Volume III-6, 2016
spoon and attached to the latex glue as the camera position constituents. The camera used is shown in the Table 3
Table 3 Camera scenario accuracy test affecting on the number of GCP distribution used has also been conducted; it is divided into five configuration of control points. The number of GCP changes based on the control point configuration used, while the number of CP is 21 points at the same position of each control point configuration shown in Table 4.
5 GCP is the most disperse control point configuration and 6 B is the closest control point configuration.
The adjustment at the control point will result in the residual value, which is the differential value from the data average used. The adjustment at the CP will result in the Root Mean Square Error (RMSE) value as the different value of the data at the CP with the data considered to be the correct ones from GPS measurement. The RMSE CP value is divided into the horizontal accuracy and vertical accuracy. The best model accuracy result can be seen in Table 5
Table 5 Model product accuracy
Accuracy Camera combination RMSE value (m) Horizontal 125 Combination 0.074
250 Oblique 0.071
Vertical 125 Oblique 0.057
250 Oblique 0.071
Total 125 Combination 0.094
250 Oblique 0.100
Each of the best model resulted is at the 6 B control point configuration. The accuracy of all models can be seen in Figure 12.
Figure 12 Model accuracy
From the figures above, it can be seen that the combination camera gives the stable accuracy at all of the control point configurations and increases the accuracy at the configuration of 5 GCP. The oblique camera results in the best accuracy at the all of the control point configurations both the horizontal and vertical configurations.
The best product resulted by the product validation process with statistical method is by comparing the value of GPS-RTK coordinate as the reference with the coordinate resulted by the product in the RMSE value. The horizontal coordinate is resulted from orthophoto while the vertical coordinate is resulted from DEM. This is also conducted at the LiDAR data to see the data quality shown at Table 6.
Height reference system used by DEM LiDAR does not present the supporting data, so that by seeing the undulation at the study area, it is suspected to refer to orthometric height. On the other hand, the related DEM photos use the ground control point coordinate of GPS-RTK measurement results so that it has ellipsoid height reference. So, DEM photo is conducted the height subtraction using geoid undulation from EGM 2008. ISPRS Annals of the Photogrammetry, Remote Sensing and Spatial Information Sciences, Volume III-6, 2016
3.2 UAV- Photogrammetry Products
The result produced by orthophoto is able to visualize the earth surface resulted by the overlap photos seen from the orthogonal projection side. It is happened due to the central projection change, with the concept with the concept of collinearity and co planarity. It is seen in some places that there are unshaped mosaic correctly causing the imperfect orthophoto generation.
Furthermore, other orthophoto product from this study is DEM, which is a DSM type. At the north part of the model, the imperfect DEM can be seen because there are point cloud formed as the captured horizon so that the formed interpolation field from the point cloud does not describe the real ground surface.
3.3 DEM Comparison result and Fault Definition Result
The visual DEM result of UAV-photogrammetry is different to the DEM LiDAR to be used as the comparison. Before comparing, both DEMs are conducted the same filter method. It is slope-base filtering method. The comparison results are seen at the Figure 13.
Figure 13 DEM comparison
Statistically, the height different from both model comparison average is -1.42 m with the deviation standard of 2.74 m. The minimum value is -31.92 m and the maximum value is 28.75 m. The fault field is resulted from the cross-section field cutting interpretation from the DEM used. By the study area giving the length and width of one kilometre a range division of cross section cutting of 20 meter has been conducted so that it results in 40 samples. This process is conducted at both DEMs both DEM and LiDAR. Figure 14 shows the comparison of both faults of definition result.
Visually, there is no significant different between both faults of definition results of UAV-Photogrammetry and DEM LiDAR. Statistically, it shows that the RMSE between the two faults result (LiDAR as the baseline) is 12.943 meter in horizontal and 2.834 meter for vertical.
Figure 14 Fault determination
3.4 Accuracy Discussion and Product Quality
The surface topography of the research area is very dynamic. It is probable that correction (phase ambiguity data) from base to rover (GPS-RTK) is not well transmitted. The radio signal who carry the correction data is obstructed by hill, housing object, trees, and valley. GPS-RTK precision level is 1-5 cm, the accuracy can be achieved by the circumstances in the assumption that the ambiguity phase can be determined correctly. It should be stressed that in order to achieve the accuracy level, RTK system must be able to determine the ambiguity phase by using a limited amount of data and also while the receiver (rover) is moving (Abidin, 2007).
Sources of error may occur due to the imperfect mosaic as the involvement of the oblique camera during the mosaic construction. The photo scale is affected by the obliqueness of oblique camera, so when building a mosaic, it is required a photo with a uniform scale. This causes the adjustment in making orthophoto which can lead to a shifting pixel in an image, attracted or stretchable from the position it should be.
The calibration process of non-metric camera is conducted in two months prior to the aerial photography acquisition process. Given the high instability of non-metric cameras, the calibration process should be performed before and after the aerial photography data collection process conducted to change the camera calibration constant change significantly or not (Wolf, 1974).
The number of blurred images by the vertical camera can be found mainly at an altitude of 125 meters is 36 pieces. Blurred images can reduce the number of tie points on the image matching process but it can also affect the GCP determination on the photos represented by Premark accurately and it can reduce the model photogrammetric accuracy generated (Sieberth, et al., 2014).
The camera combination usage can provide the efficient use of ground control points, as shown by the reduced RMSE value. The RMSE value decrease of the model with the vertical camera to be the combination camera is very significant. For example in id point cp002, the Z error value is 1.274 meters decreasing until 0.167 meters. This decrease is also seen in the whole configuration of the control points.
The precision position of LiDAR data is determined using GPS Differential and high-flying determining the spatial resolution ISPRS Annals of the Photogrammetry, Remote Sensing and Spatial Information Sciences, Volume III-6, 2016
one square meter to be generated the DEM with a horizontal or spatial resolution of 0.5 to 2 meters. It is also still found the noise in the LiDAR data in several areas such as hills and valleys. The vertical accuracy which can be achieved by the Lidar on the spacious and flat area situations is recorded up to 0.15 m (Hofton, et al., 2002). The vertical accuracy decline may be caused by a dense canopy research area so that the data generated can’t achieve the maximum accuracy.
The additional data information from the LiDAR as the
comparison model can’t be found especially for height reference
system. The comparison between both models is built by the assumption that the height reference system of the LiDAR data is geoid.
The datum offsets in each island using the EGM08 geoid (for the height reference subtraction) as global datum computed, the intra-island datum comparison shows distortion of 0.48 meter occurs between local height datum in Java and Sumatra (Kasenda, 2009). These factor may cause reduction of height accuracy on both LiDAR DEM and UAV DEM.
The use of filter slope-base method only considers two parameters in the search filter process: the distance search and surface slope. This use of the filtering method does not give a satisfactory results in dynamic areas such as joint valleys, hills and valleys. During testing the slope base filtering method, it gives the satisfactory results for each data sample in each region (Sithole and Vosselman, 2003). But if the area is a combination of various types of areas, it will affect the filter process conducted.
4. CONCLUSIONS AND RECOMMENDATIONS
Based on the research, it can be concluded, among others: 1. The design and implementation of the oblique, vertical
and combination camera uses can improve the horizontal and vertical accuracy stability in the entire control point configuration.
2. The DEM comparison results of LiDAR and UAV-Photogrammetry do not give any significant difference. The fault plane defined by the two types of DEM does not show significant result differences between both models.
The recommendations for further research are as the following: 1. The design of low oblique camera housing with the
inner type or having a camera angle of 132 degrees to -132 degrees to the right and left cameras, it can give good results in this study because it can reduce the captured horizon in the photo which will reduce or complicate the aerial photo data processing. The inner type of camera housing can increase the number of overlap and sidelap.
2. The application of the network method for reference station is strongly recommended in this research to avoid the lack of immeasurable point due to the obstructed hill or the measured points at the bottom of the valley.
3. To increase the model accuracy who has high canopy density, it is better to conduct the GPS static
measurements at several points, particularly at the outermost point. The GPS Static measurements will produce more accurate coordinates compared to the use of RTK.
4. The validity of supplementary information from the data used as a comparison is necessary to be ensured, such as LiDAR who has not been able to represent the height reference clearly in this study.
5. Oblique photo should not be included when making mosaic. Orthophoto development is conducted only using the vertical camera so that the resulting image scale is uniform.
6. Non-metric camera calibration process should be conducted before taking the aerial photography and after the aerial photography process to see any changes in calibration constant.
7. Filter method that can accommodate the dynamic research such as valleys, hills and residential population as an adaptive slope-base can be used. Another way can be done by dividing the filter area based on a uniform slope, separating the ridge from one another, the valley slopes, and resident housing.
ACKNOWLEDGEMENTS
This paper is a part of undergraduate research to get Bachelor of Science degree in Geodesy and Geomatics Engineering in Institut Teknologi Bandung, Indonesia.
This paper is made possible through the help and support from supervisor, engineer and research students. Please allow me to dedicate my acknowledgment of gratitude toward the following significant advisors and contributors: Dr Deni Suwardhi as the first supervisor, and Dr Irwan Meilano as second supervisor and fellow research assistant in 3D Model and Information System Laboratory.
REFERENCES
Abidin, H. Z. 2000. Penentuan Posisi dengan GPS dan Aplikasinya. Cet 2. Jakarta (Indonesia): Pradnya Paramita. p 101. Eisenbeiss, H. 2009. UAV Photogrammetry. Zurich (Switzerland): ETH Zurich. p 2.
Fritsch, D., Kremer, J., Grimm, A., Rothermel, M., Wenzel, K. 2011. Dense Image Matching Using Oblique Imagery - Towards "All-in-One" Photogrammetry. GIM International [Internet]. [cited 2015 August]. p 5. Available from: http://www.gim-
international.com/content/article/towards-all-in-one-photogrammetry
Hodgson, M., Jensen, J., Schmidt, L., Schill dan Davis, B. 2003. An evaluation of Lidar and IFSAR derived digital elevation models in leaf-on conditions with USGS Level 1 and Level 2 DEMs. Remote Sensing of the Environment. 84 (2003) pp 295– 308.
Hofton, M., Dubayah, R, Blair, J., and Rabine, D. 2002. Validation of SRTM elevations over vegetated and non-vegetated terrain using medium footprint LiDAR. Photogrammetric Engineering & Remote Sensing. Vol. 72, No. 3, March 2006, pp. 279–285.
Horspool, N., Natawidjaja, D., Yulianto, E., Lawrie, S., and Cummins, P. 2011. An Assessment on the use of High Resolution Digital Elevation Models for Mapping Active Faults in Indonesia. Geoscience Australia Record. No. 2011/19. p 37. Irsyam, I., Sengara, W., Aldiamar, F., Widyantoro, S., Triyoso, W., Natawidjaja, D., Kertapati, I., Meilano, I., Suharjdono, D., Asrurifak, I., and Ridwan, I. 2010. Development of Seismic Hazard Maps of Indonesia for Revision of Hazard Map. In SNI 03-1726-2002. Technical Report.
Kasenda, A. 2009. High Precision Geoid for Modernization of Height Systems in Indonesia. Sydney (Australia): The University of New South Wales. July 2009. pp 106-110.
Lembicz, B. W. 2006. Minimizing Ground Control Points When GPS Photogrammetry Isn't Practical. ASPRS 2006 Annual Conference. Reno, Nevada. May 1-5, 2006. pp 1-13.
Li, Z., Zhu, Q., dan Gold, C. 2005. Digital Terrain Modeling : Principles and Methodology. New York (USA): CRC Press. pp 7-11.
Rupnik, E., Nex, F., dan Remondino, F. 2014. Oblique Multi-Camera Systems - Orientation and Dense Matching Issues. The International Archives of the Photogrammetry. The International Archives of the Photogrammetry, Remote Sensing and Spatial Information Sciences, Volume XL-3/W1, 2014. EuroCOW 2014, the European Calibration and Orientation Workshop, 12-14 February 2014, Castelldefels, Spain.
Shufelt, J. A. 1999. Performance Evaluation and Analysis of Monocular Building Extraction from Aerial Imagery. IEEE Transactions on Pattern Analysis and Machine Intelligence. 21(4) pp 311-326.
Sieberth, T., Wackrow, R., Chandler, J. H. 2014. Influence of Blur on Feature Mathing and Geometric Approach for Photogrammetric Deblurring. The International Archives of the Photogrammetry. Remote Sensing and Spatial Information Sciences, Volume XL-3, 2014. ISPRS Technical Commission III Symposium, 5 – 7 September 2014, Zurich, Switzerland. Sithole, G., Vosselman, G. 2003. Comparison of filtering algorithms. ISPRS. Commission III, Working Group 3. pp 1-8. Udin, W. S., and Ahmad, A. 2012. Large Scale Mapping Using Digital Aerial Imagery of Unmanned Aerial Vehicle. International Journal of Scientific & Engineering Research, Volume 3, Issue 11, November-2012, ISSN 2229-5518. Wolf, P. R. 1974. Elements of Photogrammetry. 4th Edition. Madison: McGraw-Hill: Inc. pp 69-71.