MOPITT TOTAL COLUMN CO OVER THE INDIAN SUBCONTINENT: SPATIAL
VARIABILITY AND LONG TERM TREND
Dr. Shuchita Srivastava
Marine and Atmospheric Sciences Department, Indian Institute of Remote Sensing, Dehradun, India [email protected]
KEY WORDS: Columnar CO, MOPITT, Indo-Gangetic Plain, latitudinal variations, long term trend
ABSTRACT:
Total column carbon monoxide (CO) concentration obtained from MOPITT (Measurement Of Pollution In The Troposphere) have been analyzed over the Indian subcontinent for a period of March, 2000 to December, 2010. Average monthly variation of columnar CO is investigated over the eastern and western coasts of India (latitude > 18°N). The columnar CO concentration is found to be larger over the east coast than the west coast. The higher columnar CO concentrations (2.3 - 2.8 x 10¹⁸ molec/cm2) occur during November to April months over both the coastal regions. The lower columnar CO concentrations (1.6 - 1.7 x 10¹⁸ molec/cm2) occur during July-August months over these coastal regions when air blows from the Bay of Bengal towards the east coast and from the Arabian Sea towards the west coast. The latitudinal variations of ten year averaged columnar CO are also investigated over the eastern and western coastlines of India (23.5°N to 8.5°N). The latitudinal gradient is stronger over the eastern coast (3.2 x 10¹⁶ molec/cm2/°N) with respect to the western coast (8.6 x 10¹⁵ molec/cm2/°N) due to injection of highly polluted air mass from the Indo-Gangetic Plain over the northern part of Bay of Bengal. In order to investigate the source of pollution, variation of columnar CO concentration over the 11 polluted cities situated in the Indo-Gangetic plain has been examined. Columnar CO concentrations are found to be significantly higher over the southeast Indo-Gangetic plain and show a linear decreasing tendency from southeast to northwest cities. The maximum columnar CO concentration is observed over Patna (~ 2.48 x 10¹⁸ molec/cm2) and minimum over Multan (~ 2.19 x 10¹⁸ molec/cm2). This indicates that south-eastern part of Indo-Gangetic plain is mainly contributing towards enhancement in columnar CO concentration over the eastern coast. Columnar CO concentration showed an increasing trend during 2000 to 2010 over all the 11 cities. This increasing tendency is stronger over the cities situated in the southeast part of Indo-Gangetic plain.
1. INTRODUCTION
Carbon monoxide (CO) is an important trace gas in the atmosphere as it plays a crucial role in atmospheric photochemistry through its reaction with highly reactive hydroxyl radicals (OH). It is the most important sink of OH radicals in the unpolluted atmosphere with loss rate of 1.0 sec-1 (Sevage et al., 2001). In the urban areas, it accounts for about 12% loss of total OH radicals (Ren et. al. 2003). The OH radical acts as a detergent for several pollutant and greenhouse trace gases. An enhancement in carbon monoxide will lead to lesser OH radicals and increased lifetime of these trace constituents. Also, CO is one of the main precursors of secondary pollutant ozone (O3) in NOx rich environment and affects the ambient air quality (Crutzen and Zimmermann, 1991). Though it is not a direct greenhouse gas but it has a global warming potential because of its effects on the lifetimes of several greenhouse gases (Daniel and Solomon, 1998). Thus study of atmospheric CO has particular importance.
CO is a primary component of biomass burning, biofuel burning and vehicular exhaust. It is also produced by the oxidation of hydrocarbons which are emitted by similar sources in urban areas. Increasing industrialization and urbanization resulted into increasing trend in CO mixing ratios in the northern hemisphere during 1950 to 1980 with a rate of 1-2 ppbv yr-1 (Zander et al., 1998; Yurganov et al., 1999). The global rate of increase of CO was found to be 1 ppbv yr-1 during 1983 to 1988. This trend reversed with a decreasing rate of 2.6 ppbv yr-1 during 1988 to
1992 (Khalil and Rasmussen, 1994). Novelli et al. (1994) also showed strong decreasing tendency in CO mixing ratios of about 4 - 7 ppbv yr-1 during 1990 to 1993 over several locations in northern and southern hemispheres. The decrease in anthropogenic CO emission has been reported by Meszaros et al., (2004) over Europe during 1995-2000 with a rate of 3-4 % yr-1 and by Lin et al., (2008) over urban region of central Taiwan Basin during 1996-2006 with a rate of 24 ppbv yr-1. However, the global and hemispheric tropospheric columnar CO increased over a ten year period of 2000-2009 with a rate of 0.13-0.19 x 10¹⁶ molec/cm2 per month (Zhang, 2011).
Over the Indian region, domestic biofuel burning is largest contributor to anthropogenic CO emission followed by industrial biofuel use and transport oil use (Ohara et al., 2007). The northern Indian region particularly Indo Gangetic Plain (IGP) is a hotspot for the anthropogenic CO emissions. IGP region is extended from Indus river system in Pakistan to Panjab, Hariyana, Delhi, Uttar Pradesh, Bihar, West Bengal and Bangladesh. This is one of the most populated regions in the world having 40 % of total Indian population. The eastern part of IGP contains several coal based thermal power plants and numerous medium and small industries. Domestic cooking is another significant contributor for CO emission. Kar et al. (2008) have shown that satellite based CO observations are able to detect the strongest source areas of CO over eastern part of Bihar and West Bengal even in the lower altitude region. Satellite based measurements provide an excellent opportunity to study the regional distribution and long term trend of CO. In
the present study, we have analysed MOPITT (Measurement Of Pollution In The Troposphere) observations over Indian region. Particular emphasis is given to the difference of CO distribution between the east and west coasts of India and effects of IGP outflow over the east coast. The ten year continuous measurements have been used to study the long term trend of CO over the IGP basin.
2. DATA SOURSE
Total Column CO data were obtained from MOPITT instrument onboard the TERRA spacecraft. This spacecraft is in a polar sun-synchronous orbit at 705 km altitude with 16 days repeat cycle and a 1030 (LT) northward and southward cross over time of equator. The instrument field of view is 22 x 22 km2 with across track swath of 640 km which provides global coverage in every 3 days. The MOPITT is a cross-track scanner which senses upwelling terrestrial infrared radiation (4.7 µm) by gas correlation spectroscopy to get the profile (1000 mb, 900 mb, 800 mb, 700 mb, 600 mb, 500 mb, 400 mb, 300 mb, 200 mb and 100 mb) and total column amount of CO. The MOPITT instrumentation and CO retrieval algorithm are discussed in several research publications (Deeter et. al., 2003). The MOPITT data have been validated using in-situ aircraft measurements and results show a good agreement with the average bias less than 20 ppbv for each pressure level (Emmons et. al., 2009). MOPITT level-3 version-4 monthly data set of 1°x1° resolution has been used for a period of March, 2000 to December, 2010 in the present study. The night time measurements are not extensively validated and found to be biased by day time measurements. Thus we have used the daytime retrieval as these have the maximum information content.
3. RESULTS AND DISCUSSION 3.1 CO distribution over east and west coasts
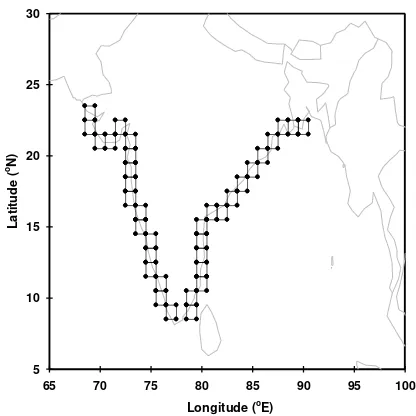
The Indian mainland is surrounded by the Bay of Bengal in the south east and by the Arabian Sea in the south west. We have chosen eastern and western coastal regions of India to study the CO distribution anomaly across the Indian subcontinent. The MOPITT CO retrieval grids are plotted over the coastlines of India from 22.5°N to 8.5°N over the eastern coast and 23.5°N to 8.5°N over the western coast (Figure 1). The black dots show the location of available CO data observed by MOPITT. The columnar CO data are calculated at each location for 10 years. The latitudinal variation of ten year averaged columnar CO are investigated over eastern coastline and western coastline of India (Figure 2). The columnar CO levels decrease with decreasing latitude over both the coastal sides. Statistically significant high correlation coefficients (r2=0.97 and r2=0.81 for east and west coasts respectively) for linear fit indicate the linear decrease of columnar CO with latitude. However, the rate of decrease is stronger over the eastern coast (3.2 x 10¹⁶ molec/cm2/°N) with respect to western coast (8.6 x 10¹⁵ molec/cm2/°N). Columnar CO values are found to be significantly higher over the northern part of east coast (24.1 x 10¹⁷ ± 4.6 x 10¹⁷ molec/cm2) than the northern part of west coast (20.9 x 10¹⁷ ± 2.4 x 10¹⁷ molec/cm2) which leads to stronger north south gradient over eastern coastline.
Longitude (oE)
Figure 1. MOPITT CO retrieval grids over eastern and western coastlines of India.
East Coast Fit (r2=0.97, slope=3.2*1016)
West Coast Fit (r2=0.81, slope=8.6*1015)
Figure 2. Latitudinal variation of total columnar CO over the eastern and western coasts of India.
The latitudinal gradient of surface level CO has also been investigated over the Bay of Bengal during few cruise based observations previously. These studies have shown identical latitudinal decrease of surface CO over the adjacent marine region of eastern coast. Lal et al. (2006) have reported a strong north south gradient (15 ppbv deg-1) of CO over the Bay of (19.5°N - 6.5°N) during February 2003. Srivastava et al (2012) also found a similar north south gradient of 10 ppbv deg-1 (21°N to 12°N) during March-April 2006. These studies suggested that the observed positive latitudinal gradient of surface level CO mixing ratios occurs due to injection of highly polluted air mass in the marine boundary layer from northern coast of the Bay of Bengal. Therefore the observed gradient in the present work is due to the Indo Gangetic Plain outflow over the northern part of eastern coast.
3.2 Seasonal distribution of CO over east and west coasts The large difference in columnar CO values is seen for latitude greater than 18.5°N. Thus the monthly variation of CO is investigated over the northern parts of both the coasts (latitude >= 18.5°N) and shown in figure 3. The magnitude of monthly cycle is larger over the east coast than the west coast. The higher CO concentrations occur during November to April months over both the coasts. A sharp peak is identified around March over the east coast when CO level reached its maximum (2.83 x 10¹⁸ ± 0.06 x 10¹⁸ molec/cm2). The lower CO columnar concentrations occur during July-August over both the coastal regions when air blows from the Bay of Bengal towards east coast and from the Arabian Sea towards the west coast. The magnitudes of CO columnar concentrations are found to be nearly same in these months over both the coastal areas. These observations are analogous to many surface level observations of CO over the Indian locations (Lal et al., 2000).
Figure 3. Seasonal variation of total column CO over the eastern and western coasts of India.
Following two processes play major role in the seasonal distribution of carbon monoxide over the coastal regions of Indian subcontinent
[1] The high level of CO columnar concentration during winter is associated to trapping of anthropogenically emitted CO in the shallower volume below the atmospheric boundary layer. The prevailing north-westerly wind blows polluted continental air over the eastern coast and north-easterly wind blows it over the western coast. This is a major cause of high level of CO during winter season.
[2] The photochemical reaction of CO with hydroxyl radical (OH) is a major loss of CO in the atmosphere. These species show opposite trends in the atmosphere (Novelli et al., 1998). Assuming OH radical number density during winter about 5 x 10⁵ molec/cm2 and during summer about 5 x 10⁶ molec/cm2 (Martinez et al., 2003; Ren et al., 2006), the lifetime of CO will be 5 months for winter and merely 15 days for summer. Thus, the loss reaction of CO plays an important role when air arrives from marine region over the observational location during summer season.
The main reason of higher magnitude of CO columnar concentration over the eastern coast is the influence of Indo Gangetic Plain outflow. Thus the CO distribution is studied in detail over this region.
3.3 CO distribution over Indo-Gangetic Plain
The IGP basin is densely populated region having about 40% of total Indian population. High population leads several anthropogenic activities which can enhance CO mixing ratio in the atmosphere like biomass burning, fossil fuel burning, industries, transport and agricultural waste burning. The eastern part of IGP has several coal based power plants and numerous industries.
Longitude (o
E)
65 70 75 80 85 90 95 100
La
ti
tud
e
(
oN)
14 19 24 29 34
Faislabad Lahore
Multan
Ludhiyana
Hissar
New Delhi
Agra
Varanasi Patna
Dhanbad
Kolkata
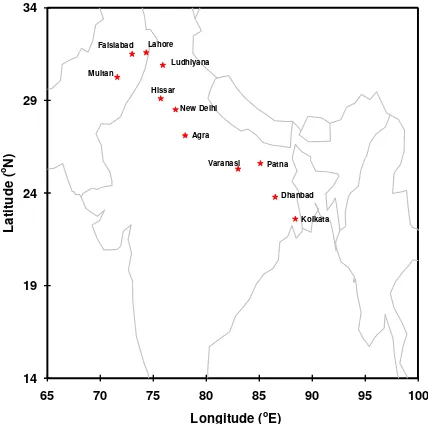
Figure 4. Eleven cities situated in the Indo-Gangetic Plain.
Figure 5. Variation of Total column CO over the eleven cities situated in the Indo-Gangetic Plain.
The ten year averaged total column CO data have been calculated at eleven locations in the IGP basin (Figure 4). The annual value is estimated using monthly data for each location. Figure 5 shows the variation of columnar CO concentration over the IGP region from northwest to southeast direction. Columnar CO concentrations are found to be significantly higher over the southeast IGP and show a linear decreasing tendency from southeast to northwest cities. The maximum columnar CO concentration is observed over Patna (~ 2.48 x 10¹⁸ molec/cm2) and minimum over Multan (~ 2.19 x 10¹⁸ molec/cm2). The rate of decrease is estimated about 2.8 x 10¹⁶ molec/cm2/city. This indicates that south eastern part of IGP is
mainly contributing towards enhancement in CO concentration over the eastern coast.
3.4 Long Term trend of CO over the Indo-Gangetic plain Total Column CO has been investigated over eleven cities in the IGP basin from March 2000 to December 2010. The CO data consist of seasonal cycle and long term trend both. The data for each location is deseasonalised using SPSS software to calculate the long term trend. The straight line has been fitted on deseasonalised CO data over each location. To check if the rate of change is statistically significant, p values are calculated for straight line fits. A statistically significant increase in columnar CO concentrations (p < 0.01) has been observed over the IGP cities. The rate of change varies between 1.09 x 10¹⁷ molec/cm2/yr and 2.32 x 10¹⁷ molec/cm2/yr. The rate of increase in columnar CO concentration over Multan, Faisalabad, Lahore and Ludhiyana are found to be1.74 x 1017 molec/cm2/yr, 1.48 x 10¹⁷ molec/cm2/yr, 1.09 x 10¹⁷ molec/cm2/yr and 1.33 x 10¹⁶ molec/cm2/yr respectively. Columnar CO concentration increased over Hissar, New Delhi, Agra and Varanasi by rate of 1.50 x 10¹⁷ molec/cm2/yr, 1.58 x 10¹⁷ molec/cm2/yr, 1.34 x 10¹⁷ developed by Ohara et al. (2007), showed that annual emission of anthropogenic CO were about 79,382 kton yr-1 in year 2000 over the India and estimated to be increased at 88,708 kton yr-1 in year 2010. This indicates 11.7 % increase per year in CO emission over the Indian region during 2000 to 2010.
4. SUMMARY AND CONCLUSION
Total column carbon monoxide (CO) concentration obtained from MOPITT instrument onboard the TERRA spacecraft have been analyzed over the east coast of India, west coast of India, and Indo-Gangetic plain for a period of March, 2000 to December, 2010. Average monthly variation of columnar CO is investigated over the eastern and western coasts of India for the latitude greater than 18°N. Total column CO concentration is found to be significantly higher over the east coast than the west coast. The higher columnar CO concentrations ranging from 2.3 2.8 x 10¹⁸ molec/cm2 to 2.8 x 10¹⁸ molec/cm2 have been observed during November to April months over both the coastal regions. The lower columnar CO concentrations (about 1.6 x 10¹⁸ molec/cm2 to 1.7 x 10¹⁸ molec/cm2) have been latitudinal gradient is found to be stronger over the eastern coast (3.2 x 10¹⁶ molec/cm2/°N) with respect to the western coast (8.6 x 10¹⁵ molec/cm2/°N). This feature arises due to outflow of highly polluted air mass from the Indo-Gangetic Plain over the northern part of Bay of Bengal. In order to investigate the
source locations of pollution, variation of columnar CO concentration over the eleven polluted cities situated in the Indo-Gangetic plain has been examined. Columnar CO concentrations are found to be significantly higher over the southeast Indo-Gangetic plain and showd a linear decreasing tendency from southeast to northwest cities. The maximum columnar CO concentration is observed over Patna (~ 2.48 x 10¹⁸ molec/cm2) and minimum over Multan (~ 2.19 x 10¹⁸ molec/cm2). This indicates that south-eastern part of Indo-Gangetic plain is mainly responsible for the tremendous increase in columnar CO concentration over the eastern coast of India. Columnar CO concentration trend is investigated over mentioned eleven locations during 2000 to 2010. This analysis showed an increasing trend in total column CO during the study period over all the 11 cities. This increasing tendency is found to be stronger over the cities situated in the southeast part of Indo-Gangetic plain.
ACKNOWLEDGEMENTS
Author is grateful to D. Mitra, Head MASD, IIRS; S. K. Saha, GD ERSSG, IIRS and Y. V. N. Krishna Murthy, Director IIRS for their encouragement and support.
REFERENCES
Crtuzen, P.J., Zimmermann, P.H., 1991. The changing photochemistry of the troposphere. Tellus 43AB, 136–151.
Daniel, J.S., Solomon, S., 1998. On the climate forcing of carbon monoxide. Journal of Geophysical Research 103, 13249–13260.
Deeter, M.N., et al., 2003. Operational carbon monoxide retrieval algorithm and selected results for the MOPITT instrument. J. Geophys. Res. 108 (D14), 4399. http://dx.doi.org/10.1029/2002JD003186.
Emmons, L.K., Edwards, D.P., Deeter, M.N., Gille, J.C., Campos, T., Nédélec, P., Novelli, P., Sachse, G., 2009. Measurements of Pollution in the Troposphere (MOPITT) validation through 2006. Atmos. Chem. Phys. 9, 1795e1803.
Kar, J., et al., 2008, Measurement of low-altitude CO over the Indian subcontinent by MOPITT, J. Geophys. Res., 113, D16307, doi:10.1029/2007JD009362.
Khalil, M.A.K., Rasmussen, R.A., 1994. Global decrease in atmospheric carbon monoxide. Nature 370, 639–641.
Lal, S., Chand, D., Sahu, L. K., Venkataramani, S., Brasseur, G., and Schultz M.G., 2006. High levels of ozone and related gases over the Bay of Bengal during winter and early spring of 2001, Atmos. Environ., 40, 1633–1644.
Lal, S., Sahu, L. K., and Venkataramani S., 2007. Impact of transport from the surrounding continental regions on the distributions of ozone and related trace gases over the Bay of Bengal during February 2003, J. Geophys. Res., 112, D14302, doi:10.1029/2006JD008023.
Lal S., Naja M., Subbaraya, 2000, Seasonal variations in surface ozone and its precursors over an urban site in India, Atmospheric Environment, 34, 2713-2724.
Lin Y. C., Lan Y. Y., Tsuang B., Engling G., 2008, Long-term spatial distributions and trends of ambient CO concentrations in the central Taiwan Basin, Atmospheric Environment, 42, 4320-4331.
Martinez, M., Harder, H., Kovacs, T.A., Simpas, J.B., Bassis, J., Lesher, R., Brune, W.H., Frodt, G.J., Williams, E.J., Stroud, C.A., Jobson, J.T., Roberts, J.M., Hall, S.R., Shetter, R.E.,Wert, B., Fried, A., Alicke, B., Stutz, J., Young, V.L., White, A.B., Zamora, R.J., 2003. Journal of Geophysical Research 108.
Meszaros, T., Haszpra, L., Gelencser, A., 2004. The assessment of the seasonal contribution of the anthropogenic sources to the carbon monoxide budget in Europe. Atmospheric Environment 38, 4147–4154.
Novelli, Ken A. Masarie, Pieter P. Tans, and Patricia M. Lang. 1994, Recent Changes in Atmospheric Carbon Monoxide, Science, 263 (5153), 1587-1590.
Novelli, P.C., Masarie, K.A., Lang, P.M., 1998. Distributions and recent changes of carbon monoxide in the lower troposphere. Journal of Geophysical Research 103, 19015– 19033.
Ohara, T., Akimoto, H., Kurokawa, J., Horii, N., Yamaji, K., Yan, X., and Hayasaka, T., 2007, An Asian emission inventory of anthropogenic emission sources for the period 1980–2020, Atmos. Chem. Phys., 7, 4419-4444, doi:10.5194/acp-7-4419-2007.
Ren, X., Harder, H., Martinez, M., Lesher, R.L., Oliger, A., Simpas, J.B., Brune, W.H., Schwab, J.J., Demerjian, K.L., He, Y., Zhou, X., Gao, H., 2003. OH and HO2 chemistry in the urban atmosphere of New York City. Atmospheric Environment 37, 3639–3651.
Ren, X., Brune, W.H., Mao, J., Mitchell, M.J., Lesher, R.L.,Simpas, J.B., Metcalf, A.R., Schwab, J.J., Cai, C., Li, Y., Demerjian, K.L., Felton, H.D., Boynton, G., Adams, A., Perry, J., He, Y., Zhou, X., Hou, J., 2006. Behavior of OH and HO2 in the winter atmosphere in New York City. Atmospheric Environment 40, S252–S263.
Sahu, L. K., Lal, S., and Venkataramani S., 2006. Distributions of O3, CO and hydrocarbons over the Bay of Bengal: A study to assess the role of transport from southern India and marine regions during September–October 2002, Atmos. Environ., 40, 4633–4645.
Savage, N.H., Harrison, R.M., Monks, P.S., Salisbury, G., 2001. Steady-state modeling of hydroxyl radical concentrations
at Mace Head during the EASE’ 97 campaing, May 1997.
Atmospheric Environment 35, 515–524.
Srivastava S. et al., 2012, Surface distributions of O3, CO and hydrocarbons over the Bay of Bengal and the Arabian Sea during pre-monsoon season, Atmospheric Environment, 47, 459-467.
Yurganov, L.N., Grechko, E.I., Dzola, A.V., 1999. Zvenigorod
carbon monoxide total column time series: 27 yr of measurements. Chemosphere: Global Changing Science 1, 127– 136.
Zander, R., Demoulin, P., Ehhalt, D.H., Schmidt, U., Rinsland, C.P., 1989. Secular increase of total vertical column abundance of carbon monoxide above Central Europe since 1950. Journal of Geophysical Research 94, 11021–11028.
Zhang Y., 2011, Mean global and regional distributions of MOPITT carbon monoxide during 2000–2009 and during ENSO, Atmospheric Environment, 45, 1347-1358.