Denitrification in aquaculture systems: an
example of a fuzzy logic control problem
P.G. Lee
a,*, R.N. Lea
b, E. Dohmann
b, W. Prebilsky
b,
P.E. Turk
a, H. Ying
c, J.L. Whitson
aaMarine Biomedical Institute,Uni6ersity of Texas Medical Branch,Gal6eston,TX77555-1163, USA bOrtech Engineering,Inc.,17000 El Camino Real,Houston,TX77058-2633, USA
cBiomedical Engineering Center,Department of Physiology and Biophysics,
Uni6ersity of Texas Medical Branch,Gal6eston,TX 77555-0456, USA Received 6 November 1998; accepted 22 September 1999
Abstract
Nitrification in commercial aquaculture systems has been accomplished using many different technologies (e.g. trickling filters, fluidized beds and rotating biological contactors) but commercial aquaculture systems have been slow to adopt denitrification. Denitrification (conversion of nitrate, NO3− to nitrogen gas, N2) is essential to the development of
commercial, closed, recirculating aquaculture systems (B1 water turnover 100 day−1). The
problems associated with manually operated denitrification systems have been incomplete denitrification (oxidation – reduction potential, ORP\−200 mV) with the production of nitrite (NO2−), nitric oxide (NO) and nitrous oxide (N2O) or over-reduction (ORPB−400
mV), resulting in the production of hydrogen sulfide (H2S). The need for an anoxic or
anaerobic environment for the denitrifying bacteria can also result in lowered dissolved oxygen (DO) concentrations in the rearing tanks. These problems have now been overcome by the development of a computer automated denitrifying bioreactor specifically designed for aquaculture. The prototype bioreactor (process control version) has been in operation for 4 years and commercial versions of the bioreactor are now in continuous use; these bioreactors can be operated in either batch or continuous on-line modes, maintaining NO3−
concentra-tions below 5 ppm. The bioreactor monitors DO, ORP, pH and water flow rate and controls water pump rate and carbon feed rate. A fuzzy logic-based expert system replaced the classical process control system for operation of the bioreactor, continuing to optimize denitrification rates and eliminate discharge of toxic by-products (i.e. NO2−, NO, N2O or www.elsevier.nl/locate/aqua-online
* Corresponding author. Tel.: +1-409-7722133; fax:+1-409-7726993.
E-mail address:[email protected] (P.G. Lee)
H2S). The fuzzy logic rule base was composed of \40 fuzzy rules; it took into account the
slow response time of the system. The fuzzy logic-based expert system maintained nitrate-ni-trogen concentration B5 ppm while avoiding any increase in NO2−or H2S concentrations.
© 2000 Elsevier Science B.V. All rights reserved.
Keywords:Denitrification; Fuzzy logic-based expert system
1. Introduction
The field of aquaculture has developed through the ages in a pattern suggesting that it is art rather than science. Successful aquaculturists have frequently managed their production systems using intuition, like an artist, rather than established rules and standards, like an engineer or scientist. This has acted as a barrier to the introduction of modern technologies (e.g. computer hardware and software) and management practices used in similar industries (e.g. agriculture and food process-ing). The truth is that aquaculture is a science; the physiology and behavior of the cultured species can be described and manipulated using scientific and engineering methods (Balchen, 1987; Fridley, 1987; Lee, 1991, 1993, 1995; Malone and DeLos-Reyes, 1997). This is particularly true for recirculating aquaculture systems that are comparable to simple mesocosms (i.e. small ecological assemblages), making it possible to quantify accurately environmental conditions and their effects on physiological rates (e.g. oxygen consumption, waste accumulation and feeding rate). In fact, by controlling the environmental conditions and system inputs (e.g. water, oxygen, feed and stocking density), one can regulate directly the physiological rates and final process outputs (e.g. ammonia, carbon dioxide, hydrogen ions and animal biomass increase or growth). Recirculating aquaculture systems have many advan-tages over pond culture in which most environmental conditions cannot be con-trolled and natural productivity and competition for resources are not easily quantified (Fridley, 1987; Lee, 1995, 2000; Lee et al., 1995; Turk et al., 1997).
regulations on effluents, (5) reduce management and labor costs and (6) improve product quality and consistency (Lee, 1995).
One of the major problems facing modern aquaculture filtration technology, as the degree of recirculation increases, is the cost-effective removal of nitrate, i.e. denitrification. Current nitrification systems (e.g. trickle filters, fluidized beds and rotating biological contactors) are adequate and many are commercially available (Westerman et al., 1993; Malone and DeLosReyes, 1997) but no commercial denitrification filter exists currently (Whitson et al., 1993; Lee et al., 1995; Turk et al., 1997; Lea et al., 1998). The development of cost-effective, integrated nitrogen removal systems including both nitrification and denitrification processes is essential to the advent of truly closed, recirculating commercial aquaculture systems. A long-term goal is to combine nitrification and denitrification processes into an integrated system, thereby reducing the floor space needed for biological filtration. The short-term goal, and focus of this report, is the development of a commercial, autonomous denitrification filter, using extant technology (i.e. bacterial bioreactors, process instrumentation and artificial intelligence).
Catabolism of nitrogen-containing biological molecules (primarily proteins and nucleic acids) results in the release of reduced nitrogen compounds, mainly as
ammonia (NH3) (Heales, 1985; Hopkins et al., 1993). In most animals, the
ammonia is excreted immediately or converted to a less toxic form (i.e. urea or uric acid) before it causes serious effects. In aquatic animals, ammonia can be excreted directly through the gills, skin and kidneys, becoming dissolved in the water (Spotte, 1979). In natural aquatic environments, this nutrient is usually assimilated by plants but in most artificial bodies of water, such as aquaria and aquaculture systems, there are usually insufficient plants (i.e. algae or macrophytes) to remove it. In recirculating aquaculture systems, ammonia-laden water is passed through aerobic filter beds where chemoautotrophic bacteria oxidize it first to nitrite (NO2
− )
and then to nitrate (NO3
−). This reduces the toxicity of the excreted nitrogen
because most aquatic organisms experience chronic toxicity at ammonia concentra-tions of 10−6 g l−1 (1.0 ppm), and nitrite in concentrations of 10−6 g l−1 (1.0
ppm). In contrast, these same aquatic species can tolerate nitrate concentrations as high as 5×10⁻⁴g l−1(500 ppm) (Moe, 1993). Once concentrations of nitrate build
up to toxic levels, it must be removed; in most aquaria and aquaculture systems, this is accomplished by replacement of the water (Spotte, 1979; Moe, 1993).
Nitrate and nitrite serve as terminal electron acceptors in the anaerobic respira-tion of a few bacterial species (Payne, 1973). This allows bacteria under anaerobic conditions to remove nitrate-nitrogen and nitrite-nitrogen directly from freshwater or sea water. The mean energy yield for transfer of a molar equivalent of electrons from an organic electron donor (i.e. the carbon source) to molecular oxygen is 26.5 kcal mol−1
(Payne, 1970). This compares to a mean energy yield of electron transfer from nitrate (when reduced to nitrogen gas) of 18 kcal mol−1
and from sulfate (when reduced to hydrogen sulfide, H2S) of 3.4 kcal mol
−1(McCarty, 1972).
nitrate ion, releasing one nitrite ion. This results in an undesirable release of nitrite, but in the presence of an excess of organic electron donors, both nitrate and nitrite are utilized as terminal electron acceptors (Payne, 1973) following the sequence
NO3−NO2−NON2ON2
Reduction of nitrite through its intermediates to nitrogen gas is a membrane-bound process (Esteves et al., 1986) and can be considered to be a single-step process that converts nitrite to nitrogen gas. So, the full process of denitrification can be considered as a two-step process consisting of the reduction of nitrate to nitrite followed by the reduction of nitrite to nitrogen gas (Payne, 1973). There are major differences in the efficiency of this process based on the reduced carbon source; anaerobic cultures fed methanol (MeOH) as an organic electron donor are selective for species of microorganisms that stoichiometrically release nitrogen gas and carbon dioxide from either nitrate or nitrite and methanol, respectively (Sperl and Hoare, 1971). This has been demonstrated for both freshwater and sea water (Sperl and Hoare, 1971; Balderston and Sieburth, 1976). Other carbon sources can be used but none act as predictably in terms of applied dosage. Furthermore, some carbon sources (e.g. sugars and acetate) can result in the production and accumula-tion of organic acids (e.g. acetic acid) that negatively affect bacterial and fish physiology. Hence, methanol seems ideally suited as a carbon substrate for the automated control of nitrate removal from water in recirculating aquaculture systems.
Incomplete denitrification can produce very large quantities of toxic nitrite (van Rijn and Rivera, 1990). In the absence of nitrate or nitrite as terminal electron acceptors and in the presence of an excess of organic electron donors, the next best terminal electron acceptor will be utilized by the bacteria. As cited previously, the next best (in terms of energy yield kcal mol−1
electrons) electron acceptor after nitrate/nitrite is sulfate that reduces to toxic sulfide ions (S2−
) (Breck, 1974; Balderston and Sieburth, 1976). Sulfide (in solution) or as hydrogen sulfide (re-leased as a gas from solution) is extremely toxic (Spotte, 1979). Thus, if the reaction is incomplete or if it is allowed to continue beyond the conversion of nitrogenous wastes, toxic by-products can be released. A method of monitoring and control must be utilized to prevent this from occurring.
Balderston and Sieburth (1976) suggested a means of monitoring denitrification involving oxidation – reduction potential (ORP). Breck (1974) considered redox potential (pE) under a variety of conditions; pE is related to ORP through the equation,
pE= −log(e)=eH/0.059
whereeis the free electrons and eH is ORP. Sequential removal and reduction of
oxygen, nitrate and nitrite result in sequential decrease of ORP in the media (Sille´n, 1965; Breck, 1974). Sille´n’s data indicate that complete reduction of nitrate to nitrite should result in an ORP of−200 mV and that complete reduction of nitrite
to nitrogen gas should result in an ORP of −325 mV. Further examination of both
Sille´n and Breck indicates reduction of sulfate to sulfide should result in ORP
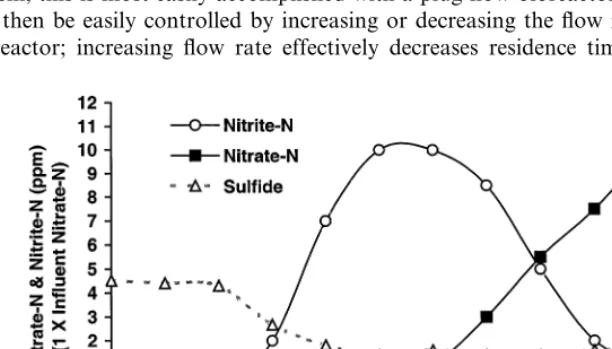
Fig. 1 shows proportions of nitrite and nitrate leaving the column (i.e. effluent stream) relative to the concentration of nitrate that enters the column (i.e. influent stream) as a function of ORP. As the ORP drops below 0 mV, the nitrate begins to be converted to nitrite and nitrite accumulates, continuing through the range 0
to −225 mV. From −225 to −400 mV, the accumulated nitrite is converted to
N2. At −400 mV, the nitrate is converted first to nitrite then the nitrite is
converted immediately to N2 without accumulating. Below −300 mV, sulfide
production increases but this is only in the ppb range. Ideally, a controller should
maintain ORP at approximately −375 to −400 mV, based on this graph (Sille´n,
1965). In this range, the denitrifying bioreactor would remove essentially all of the nitrate and nitrite with a very low level of hydrogen sulfide release. In the range
−325 to −400 mV all of the nitrate and at least 50% of the nitrite evolved in the
−200 to −250 mV range, is removed from the effluent. The nitrite can be
reoxidized to nitrate in the aerobic nitrifying filter bed before returning the effluent to the aquaculture tank. Thus assuming a 1:1 reduction of nitrite to nitrate in the aerobic filter bed, there will be at least a net 50% reduction of nitrate in the effluent
of the bioreactor if we control ORP in the −325 to −400 mV range.
When sufficient assimiable reduced carbon (i.e. methanol) is present for complete denitrification of the nitrate present, denitrification is rate limited by the bacterial biomass and residence time (Payne, 1973; Balderston and Sieburth, 1976; Bengtsson and Annadotter, 1989). So, in a biological denitrification system, the residence time (i.e. the time that water remains in contact with the denitrifying bacteria) must be controlled, to allow sufficient time for full removal of nitrate. For a flow-through system, this is most easily accomplished with a plug-flow bioreactor. Denitrification can then be easily controlled by increasing or decreasing the flow rate through the bioreactor; increasing flow rate effectively decreases residence time and increases
ORP while decreasing flow rate increases residence time and decreases ORP. In the case when sufficient methanol is provided and when high effluent nitrate levels are observed, a decrease in flow rate allows sufficient time for complete denitrification. In the case when sulfide is released, an increase in flow rate decreases the residence time and increases ORP, terminating the reaction sequence prior to sulfate reduction.
These conditions in a denitrifying system can be monitored and controlled using standard process control technology with occasional review by a human expert (Whitson et al., 1993; Lee et al., 1995; Turk et al., 1997) and they are the basis for process and design patents for denitrification (Lee et al., 1996; Turk, 1996). However by using a fuzzy logic-based expert system, it should be possible to implement a completely closed loop, autonomous control system for denitrification for large aquaculture or aquarium systems. This would enable the advent of closed, cost-effective, recirculating aquaculture filtration systems (B1% water exchange day−1).
2. Basics of fuzzy logic control
Fuzzy logic provides the next step in computerizing human thought processes. Fuzzy logic technology (Zadeh, 1965, 1992; Negoita, 1985; Zimmermann, 1991) has been recognized recently by the Institute of Electrical and Electronics Engineers (3 Park Avenue, 17th Floor, New York, NY) as one of the three key information processing technologies. This fuzzy logic attribute allows the capture of human thought processes in an optimal manner for automation. For example, if a car is going too fast and the driver finds it necessary to slow down, his braking action would be hard, soft, or intermediate depending on the criticality of the situation. Similarly, a fuzzy braking control system consists of fuzzy sets defined over a graded range of decelerating braking speeds. Due to the manner in which fuzzy logic deals with continuous transitions from one state of the system to another (e.g. fromsofttointermediatetohard) it provides the ability to handle control problems when there is uncertainty due to complex dynamics of an environment. Fuzzy systems can be developed and used to control complex processes as long as insight, and sometimes intuition, based on empirical observations about process behavior, exist in the operator’s mind. Rule-based expert systems allow one to develop computer programs in a manner that relates rules to numbers. Fuzzy logic takes the next important step by relating rules to fuzzy sets.
The basis of fuzzy logic systems is a fuzzy set that describes the membership of an object by a number in the unit interval [0, 1] as opposed to either 0 or 1 (member or nonmember) as in classical set theory. For example, one fuzzy set might be
young. One might define young as follows: 10 years old isyoung with membership
1, 30 years old is young with membership 0.45, and 50 years old is young with
membership 0.1. That is, everybody is young to a degree. Hence, fuzzy systems
There have been many successful applications of fuzzy systems, particularly in the area of control and modeling (Mamdani, 1977; Sugeno, 1985; Takagi and Sugeno, 1985; Yasunobu and Myamota, 1985; Lea, 1988, 1989; Lee, 1990; Lea and Jani, 1991, 1992, 1994, 1995; Ying et al., 1992; Sugeno and Yasukawa, 1993; Lea et al., 1995, 1997; Pin and Watanabe, 1995; Takagi, 1995; Takagi et al., 1995; Takahashi, 1995; Wakami et al., 1995). Fuzzy control techniques have been applied in aquaculture for the development of a real-time machine vision system (Whitsell and Lee, 1994; Whitsell et al., 1997).
Reasoning with fuzzy logic, sometimes referred to as fuzzy reasoning, is some-thing that everyone does at all ages. A young girl learning to ride a bicycle learns
to compensate for falling by shifting her weight and position a small or large
amount one way or the other on the bicycle. Even more difficult is the problem of learning to ride a unicycle but it is certain that in the process of learning one does not model mathematically the physical process (although it can be modeled). Other routine tasks that employ fuzzy logic are parking a car, steering in order to hold the car in the proper lane or changing lanes to pass or avoid a collision. In this case, we steer asmall,medium, orlargeamount to the left or right while possibly braking
slightlyorstrongly, if necessary to avoid a car in front of us. Other similar tasks are adjusting a thermostatupordownif we are toohotor toocoldor determining how
much to water our grass by assessing thedryness of the ground.
Fuzzy logic is a rule-based approach to control that is particularly suited to complex systems where accurate mathematical models cannot be developed or that
require too much time and/or other resources to develop. The reason fuzzy
logic-based control works well in certain complex systems, where classical rule-based expert systems tend to fail, is due to the nature of fuzzy logic inferencing which computes degrees of existence, or criticality, of a problem, or the degree of necessity for a control action. In order to use fuzzy reasoning to build a fuzzy logic expert system for an aquaculture denitrification bioreactor, it was necessary to model, with fuzzy sets, the properties such as6ery high,high,normal,low, and6ery lowwith respect to the control variable ORP, short,medium, andlong with respect to residence time in the bioreactor, andpositi6e,positi6e small,zero,negati6e small,
and negati6e with respect to water pump rate change and methanol pump rate
change, respectively. It is a natural approach to the design of control systems to automate functions that historically have been performed by human experts based on their evaluation of information from sensors and information from other humans. Thus, based on knowledge provided by system designers (i.e. aquacultur-ists), it was decided that feasible memberships values of ORP in the fuzzy sethigh
were, high (−300)=0.0, high (−200)=0.2 and high (0)=0.9, where −300,
−200, and 0 were expressed in mV. Similar fuzzy sets were prepared for each
property of a control or action variable. In contrast using classical Boolean logic, a value of the variable ORP must fall into either the sethigh ornot high but not both so that every discrete ORP value had a degree of membership, a value between 0 and 1, in the fuzzy sethigh.
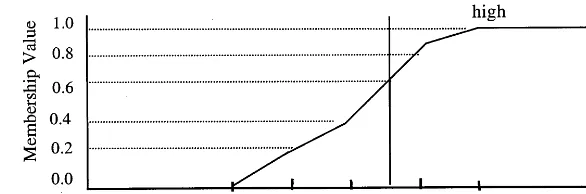
Fig. 2. An example of a fuzzy membership function for ORP. The horizontal axis represents ORP in mV and the vertical axis represents the membership function of a given ORP in the fuzzy set.
control or action variable based on a thorough understanding of how the system works, at least from a qualitative point of view, and how actions actually affect the process. The following italicized words have fuzzy interpretations, i.e. 6ery high
typically does not mean precisely greater than or equal to a predetermined ORP measurement, but rather it implies a predetermined ORP about which the opera-tor’s concern shifts from slight to extreme such that the ORP reading is considered
6ery high. For example, in the denitrification rule base there is a rule, ‘if ORP is highand residence time is shortthen the change to the water pump rate should be
negati6e.’ Another rule states, ‘if ORP is low and residence time is long then the
change to water pump rate should be positi6e.’ Furthermore, the membership
functions for all variables (e.g. ORP, residence time and water pump rate change) must have a domain specified, usually referred to as the universe of discourse, consisting of all conceivable states of the variable.
A typical method of forming such functions is to create a piece-wise linear function (Fig. 2) that interpolates the function between key values that have been
defined by a system designer such as the values assigned above for ORP, −300,
−200, and 0 mV. With such a rule, if −300 is considered to be acceptably below
the high range, then high (−300) should be equal to 0 so that no action will be taken based on rules that require a high ORP level. On the other hand when ORP is 100 mV, if the designer wantshigh (100)=1.0, then the system should take the maximum action at that variable reading (i.e. set the pump rate change to
maximum positive). If the ORP is −100 mV andhigh (−100)=0.4, then pump
rate change would be in thepositi6e smallrange. The preceding rules are simplified
for the purpose of illustrating the idea. Therefore, if someone developed the denitrification control system with rules such as, ‘if ORP is low then increase the
water pump rate’ and ‘if ORP is high then decrease the water pump rate,’ the
control system would not work very well since after reducing pump speed the expert system must wait a reasonable amount of time to observe the effect of the change on the system before additional actions were taken.
Human experts placed in this type control situation develop rules that they follow, but these rules are usually of a vague nature such as,
(Rule1) if ORP is high and residence time is short then pump rate change
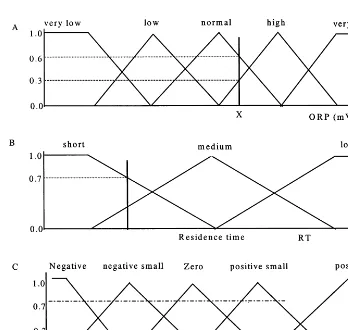
For example, consider the graph in Fig. 3A that shows five fuzzy set membership functions describing the state of ORP in each of the five sets,6ery low,low,normal, high, and 6ery high, where the horizontal axis is the axis of the monitored variable
ORP. The current indicated value of ORP, X, would be interpreted to benormalto
a degree approximately 0.6, whereas it would behighto a degree 0.3. Consequently, the rule would fire (i.e. trigger) at less strength than a rule that states,
(Rule2) if ORP is normaland residence time isshort then pump rate change
should be negati6e small.
Example sets of fuzzy membership functions representing residence time (RT) and pump rate change (DPR) are also given in Fig. 3B, C, respectively. Note here that the first rule and the second rule listed above both evaluate RT as short to
degree approximately 0.7, estimating from the graph, whereas for the first rule,
ORP ishighto degree approximately 0.3 and for the second rule ORP isnormalto
a degree 0.6. However, even though one rule has a weaker strength than the other, they both fire (i.e. trigger) and contribute to the strength of the control action.
In order to illustrate how these rules are combined, we must have an intersection
operator, and, and a union operator, or, the extensions of the Boolean set
operations of intersection and union. We will take these to be the operators originally suggested by Zadeh in his seminal paper (Zadeh, 1965) although many others have been proposed and studied for different applications (Negoita, 1985). We choose Zadeh’s operators, for this example, since they are particularly simple to apply, and have been used successfully in many applications. In Zadeh’s definition, the intersection of two fuzzy sets is taken to be the minimum of the degrees to which each of the fuzzy set conditions are satisfied while the union is taken to be
the maximum of the degrees. Therefore, the degree to which ORP is high and RT
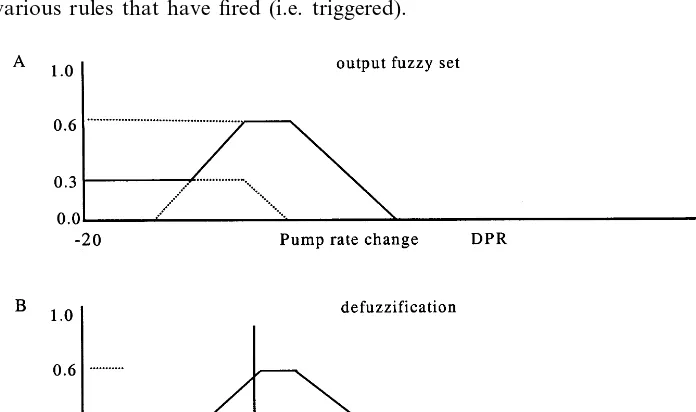
is short is the minimum of {0.3, 0.7} which is 0.3. Thus the degree to which the antecedent of the rule (Rule1) is satisfied is 0.3 and this degree is projected to the fuzzy consequence by clipping the fuzzy set negati6eat the 0.3 level (Fig. 4A) and
this clipped membership function is the fuzzy output for Rule1. On the other hand, the degree to which ORP isnormaland RT isshort is the minimum of the set {0.6, 0.7} which is 0.6. Therefore the second rule (Rule2) will fire with strength 0.6 and
the fuzzy setnegati6e smallis clipped at a height of 0.6, as indicated in Fig. 4B, to
get the output of the second rule.
These two output fuzzy sets from the two active rules are then combined, using the union of fuzzy sets, as in Fig. 5A to form an output fuzzy set that results from the combination of the two rules. In Fig. 5B, the vertical line at DPRorepresents
the defuzzified degree pump rate change that will be commanded by the control system. It is determined by a common method of defuzzification based on the centroid of the area under the fuzzy set output curve in Fig. 5A enclosed by the solid lines. In this method, the vertical line (i.e. centroid) that splits the area into two equal parts is determined, and the point at which it intersects the pump rate change axis, DPRo is taken to be the defuzzified value that will be used to adjust
the pump rate. This is the pump rate change that will be commanded based on the input ORP and RT and the result of the firing (i.e. triggering) of the two rules in the example. It should be noted that in a fuzzy system there may be many rules that fire simultaneously. However if other rules fire, their consequent fuzzy sets would also be combined with these two by taking unions of fuzzy sets as many times as is appropriate based on the number of firing rules. Other methods of defuzzification are also used by different practitioners but the one described in the example is one that is particularly useful and intuitive. It illustrates how the consensus action is determined from the combination of the weights of the actions as indicated by the various rules that have fired (i.e. triggered).
3. Materials and methods
3.1.Aquaculture tank system
A 14 500 l raceway composed of a 10 500 l rectangular fiberglass culture tank (6.1×2.4×0.9 m) and a 4000 l rectangular fiberglass filtration tank (4.2×1.8×0.9 m) were automated using modern process control technology. The basic tank designs and control system operation have been described by Yang et al. (1989), Turk and Lee (1991), Lee (1993), Whitson et al. (1993), and Lee et al. (1995). One common design feature of these tank systems is the use of airlift pumps to circulate the water, ensuring that dissolved oxygen levels are saturated, that dissolved carbon dioxide levels are low (i.e. gas stripping) and that energy is conserved using low head pressure filtration (Turk and Lee, 1991). Research animals
(e.g. squids of the species Sepioteuthis lessoniana) were cultured in a raceway
continuously during the 3 years of operation (Lee et al., 1994; Lee, 2000). In fact, six consecutive generations of squid were cultured and several generations repro-duced within the raceway (Lee et al., 1995). The biomass load of the squid and food (live fish and shrimp at a feeding rate of 30% body wt day−1) was moderate, 1 – 5
kg m−3. For the final validation of the research, the denitrifying bioreactor was
installed on a 2-m diameter circular tank (1500 l) used to culture freshwater guppies; design and operation were similar to the previously described systems (Lee 1993; Lee et al., 1994, 1995; Turk et al., 1997). An industrial process control system was designed and installed on each tank system (Whitson et al., 1993; Lee et al., 1995). The original design was based on a microcomputer supervisory control and data acquisition system (SCADA), linking 386/486 series personal computers (PC) with
standard industrial control signal multiplexers (Dutec Model IOP-AD+ and
IOP-DE composed of 16 analog and 16 digital inputs/outputs (I/O) channels,
respectively; Dutec Inc., Jackson, MI) and software. Each I/O channel required its own signal conditioning module that could accept various voltage or current signals (i.e. 4 – 20 mA, 0 – 1 V or 0 – 100 mV).
Currently, the system has become a subprocess in a more comprehensive dis-tributed control system (DCS) that serves three separate aquaculture facilities (Lee, 1995). The process control software originally used was a graphical interface product for the Microsoft Windows™ operating environment: FIX DMACS™ for Win-dows™ by Intellution (Norwood, MA). The program can run on any PC and utilizes NetDDE™, to allow transfer of data between Windows™ compatible programs. Inputs and outputs can be displayed as floor plans, graphs, charts or spreadsheets in real-time and all data can be archived to the hard disk or other media. Control functions include: set point control, PID (proportional/integral/derivative) control, batch control, statistical process control and custom control blocks.
3.2.Denitrification system
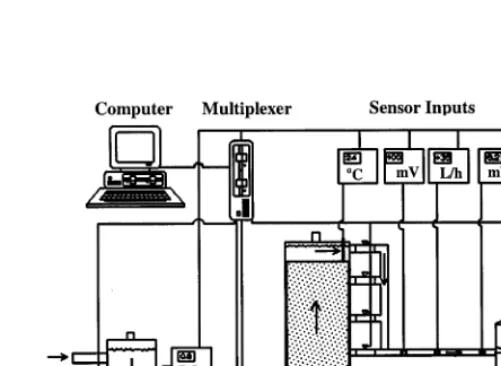
1995, 1996). A block diagram of the denitrification system is as shown in Fig. 6. A bioreactor was composed of a sparge column to remove excess oxygen from the influent water by injecting N2, the anaerobic filter beds where the denitrifying
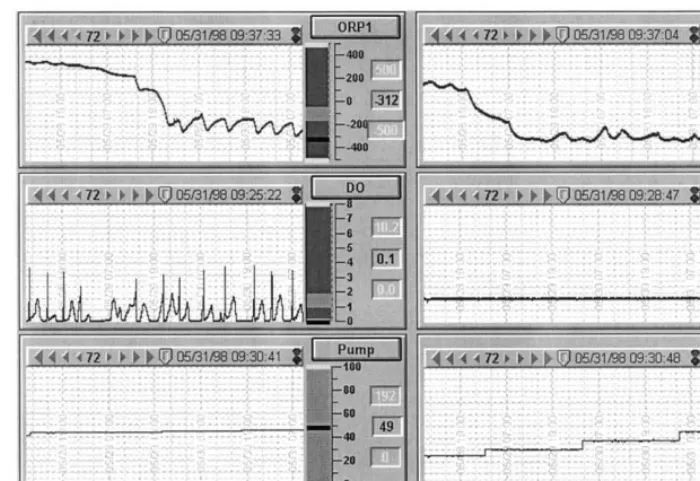
bacteria grow and a reoxygenation column to reoxygenate the effluent, using an air blower. The bioreactor influent was drawn from the aerobic biofilter and the effluent was discharged into an upflow, activated carbon filter upstream from the aerobic biofilter. All major functions of the bioreactor including ORP of the effluent, column retention time, carbon (i.e. methanol, MeOH) feed rate, DO and sparge rate were monitored and controlled by the intelligent control system and displayed graphically on a video display monitor (Fig. 7). This figure shows the measured variables (i.e. ORP, methanol injection rate, water flow rate, water pump rates and DO) over a typical 72-h period of operation. Dissolved oxygen is controlled between 0.8 and 1.2 mg l−1
; it has been determined empirically that dissolved oxygen needs to be maintained at or below this level for effective continuous denitrification (Payne, 1973). The control system utilizes two pumps, one for controlling water flow rate and one for controlling methanol feed rate. Based on the sensor inputs and knowledge of the pump rates, the fuzzy controller generates changes in these two pump rates to achieve the desired residence time and carbon feed rate.
3.3.Fuzzy expert system de6elopment and implementation
Data from the historical logs of the process control system (FIX DMACS™) were used to derive correlations between absolute ORP, changes in ORP, column
Fig. 7. Monitor display for the process control software; ORP1, top left, is ORP sensed at the output of the first column of the bioreactor in mV; ORP2, top right, is ORP sensed at the output of the bioreactor in mV; DO, left center, is dissolved oxygen sensed in the sparge column in ppm; flow, right center, is flow rate through the bioreactor in l h−1; pump, lower left, is the percent of maximum capacity for the main flow pump; and MeOH, lower right, is methanol flow injection in ml h−1.
residence time and carbon feed rate. Both column residence time, a function of water pump rate and carbon feed rate affect the metabolism rate of the anaerobic bacteria in the bioreactor, determining the breakdown rate of the nitrogen compounds. This stage of the research was broken into two tasks: (1) learning the complete relationship of the ORP-denitrification function, and (2) describing the metabolic state and denitrification rate for the anaerobic bacteria filter expressed by ORP changes in the column effluent. The validation protocol was to observe the environmental state at a given time from a historical database, generate outputs from the expert system for pump rate changes, and compare the expert system control actions with recorded actions of experts correlated to the state of the system. Finally, the fuzzy control system was allowed to autonomously control the bioreactor.
program LOOKOUT™ (National Instruments Inc., Austin, TX) using Net-DDE™. The sensor signals were thereby input to LOOKOUT™ where some elementary smoothing operations were performed on the data which were then passed to Til Shell™ where more data processing was performed prior to process-ing of the data by the fuzzy rule base and inferencprocess-ing system. The control actions generated by the fuzzy rule base were then returned to LOOKOUT™ for con-trolling the process.
4. Results and discussion
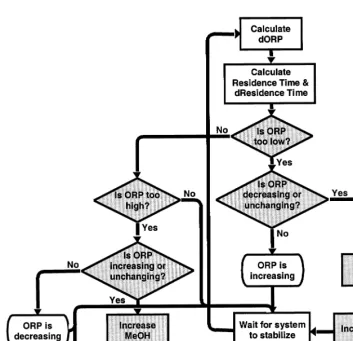
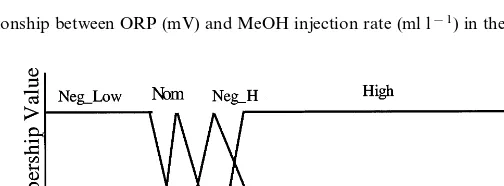
A flow diagram of the logic used by human experts and implemented into the fuzzy controller is displayed in Fig. 8. The logic used by human experts relies on the key input (i.e. ORP) and calculated values (i.e. change in ORP, residence time and change in residence time) is used to make changes in the key outputs (i.e. water pump rate and MeOH pump rate). The decision blocks (diamonds) and the action blocks (squares) are shaded for emphasis while the unshaded blocks repre-sent input blocks (biscuits) and calculation blocks (squares). The shaded decision blocks (shaded diamonds) are specifically where fuzzy logic was implemented for interpretation of the existing conditions. Output actions (shaded squares) were implemented with fuzzy logic too, as they are best executed in degrees with actions that are proportional to the severity of the requirement for change. For example, if ORP was much lower than desired, the pump rate was increased by a large amount compared with the case where ORP was only slightly lower than desired. Although several environmental parameters were monitored (i.e. DO, pH, temperature and ORP), the most significant bioreactor input signal was ORP as it displays a significant relationship with the methanol injection rate (Fig. 9). Boosting the injection rate of MeOH clearly had a dramatic effect, causing the ORP to decrease precipitously while cutting the MeOH produced quite the oppo-site effect.
The fuzzy controller was then designed and implemented into the bioreactor system. In particular, a rule base was constructed that incorporated rules involv-ing ORP, change in ORP, methanol feed rate, and residence time of the water in the bioreactor. There were \40 rules in the rule base controlling the water pump and methanol feed rate. Some of the rules controlled water pump and methanol rates jointly while others controlled water pump rate and methanol feed rate separately. When nitrate concentration of the influent increased, the ORP in-creased. This increase was counteracted by increasing MeOH injection so that the rate of denitrification increased. Hence, nitrate removal was maintained such that effluent concentration remained near 0 ppm.
The membership functions for the values of ORP are shown in Fig. 10 where
Neg-Low,Nom,Neg-High, andHighrepresentnegati6e-low,nominal,negati6e-high,
Fig. 8. Flow diagram of denitrifying bioreactor control logic used to develop the fuzzy logic rules. The shaded blocks represent decision and output blocks and the unshaded blocks represent input and calculation blocks. See text for details.
change in X as a function of time. For example, d –ORP indicates the change in the variable as a function of time, whereas d –PumpRate and d–MeOH indicate a recommended increase or decrease for the respective pump rate. In these rules, the italicized words represent fuzzy sets. In addition to the fuzzy sets for ORP, other fuzzy set labels used in the rules areZforzero,Nfornegati6e, and Pfor positi6e.
Furthermore, ifXis a fuzzy set,NOT Xis the fuzzy set defined byNOT X=1−X.
d –PumpRate are in general different, as ishigh for Res –time and high for ORP. Strictly speaking such fuzzy set labels should be subscripted by the variable when the same name is used to refer to different variables.
Rule1. IF (ORP ISNom) AND (d –ORP ISZ) THEN d –PumpRate ISZ.Rule
One in natural language — If the ORP is within the accepted range and there is
no change in the ORP then do not change the water pump rate (i.e. column residence time stays the same).
Rule2. IF (ORP IS Neg-Low) AND (Res –time IS HIGH) AND (d –ORP IS
NOT P) THEN d –PumpRate ISP.Rule Two in natural language — If the ORP is less than −400 and column residence time is too long and the ORP is stable or decreasing then increase the water pump rate (i.e. shorten the column residence time).
Rule3. IF (d –ORP IS Z) AND (ORP IS Nom) THEN d –MeOH IS Z.Rule
Three in natural language — If the change in ORP is stable and ORP is within the accepted range then continue to add methanol at the current rate (i.e. do not change carbon feed rate).
Rule4. IF (d –ORP IS Not N) AND (Res –time IS Not LOW) AND (ORP IS
Neg-High) THEN d –MeOH ISP.Rule Four in natural language — If the ORP
is stable or increasing and the column residence time is within the accepted range or abo6e and ORP is abo6e −350but below −225 then increase methanol feed rate
(i.e. increase carbon feed rate).
Fig. 9. Relationship between ORP (mV) and MeOH injection rate (ml l−1) in the functioning bioreactor.
Each rule is fired (i.e. triggered), with varying strength, based on the degree to which the fuzzy antecedent of the rule is satisfied. The strength of the rule is determined through the evaluation of the fuzzy membership functions at the current values of the input variables and combining multiple inputs using the selected definition of the fuzzy setand operator. Inferencing, to obtain a consensus output fuzzy set, is accomplished by applying the selected fuzzy setoroperator to all active rules (i.e. those rules with non-zero antecedent values). The definitions ofand and
orthat are used in our control system are those defined by Zadeh (1965) and which were discussed above in the section on fuzzy control basics. The inferencing step produces a fuzzy set that must be defuzzified (i.e. a crisp value that represents the output fuzzy set) and reflects the strengths of the active rules that contribute to it. There are several ways of defuzzifying an output fuzzy set but the one chosen for this study was the centroid method that was discussed above in the section on fuzzy control basics. The crisp value obtained through defuzzification can then be used to determine the next course of action or inaction. Notice again that fuzzy member-ship classes are generally not exclusive, as is required in Boolean logic, and that a value of ORP can belong to two or more classes (Fig. 10). In fact, it is usually the case that a value of an input variable will have membership in at least two adjoining classes.
As mentioned previously, compounds are utilized by bacteria in descending order of electronegativity (i.e. first O2, then NO3−, then NO2−, then NO and finally SO42−).
Long residence times, low bacteria biomass, low levels of carbon, or high DO can cause nitrite accumulation without complete nitrite reduction. Any of these four conditions will be correlated with aHigh or Neg-H (negati6e high) ORP reading
(i.e. a reading significantly more positive than−400 mV). On the other hand, short residence times and high levels of carbon injection can cause the generation of hydrogen sulfide (H2S); this condition is correlated typically to Neg-Low (negati6e
low) ORP readings (i.e. more negative than −400 mV).
Although as Fig. 9 clearly indicates, certain changes in ORP are important and are strongly correlated to changes in MeOH feed rate, they are not easy to detect instantaneously. The difficulty of recognizing short-term changes in ORP is due to several conditions; the most important is the constant recirculation of the water within the system. Since water in a culture system is not completely homogeneous, we should not expect uniform ORP readings, although long-term trends should be observable. Future research will focus on use of an integral term of d –ORP over an interval of time to capture such changes in ORP. Positivity and negativity of the integral, for example, can indicate whether a short-term change is real or simply reflects the non-homogeneity of the biological system.
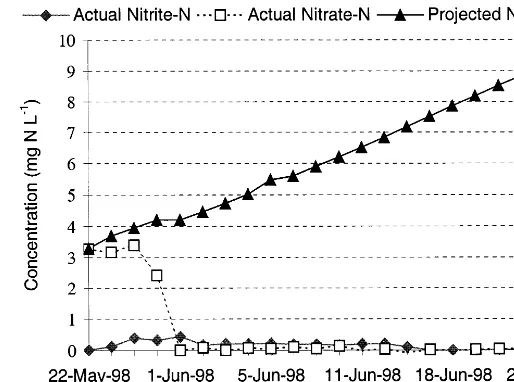
Fig. 11. Actual nitrate-nitrogen and nitrite-nitrogen concentrations (ppm) as a function of time compared to the projected accumulation of nitrate-nitrogen (ppm) in the absence of the controller.
is displayed in Fig. 9 and demonstrates that these pump rates can be used to control ORP and thereby denitrification rate.
Fig. 11 shows the nitrite and nitrate levels that actually existed in the freshwater guppy system during a 1-month period of operation beginning in late May 1998 and ending in late June 1998 as well as the projected nitrate levels had no bioreactor been present. The actual levels clearly indicate that nitrate was removed while nitrite was maintained$0. There was a slightly elevated reading for nitrate (3 ppm) early during the time period but the controller reduced this to practically zero after approximately a week. The projected nitrate build-up, in the absence of denitrification, is also shown on the same graph. Together these graphs indicate that the bioreactor was performing its task of reducing nitrate to a very low level — well below the target level of 10 ppm. In addition, pH was stabilized by denitrification (7.890.48 during the same time period) because free hydrogen ions (i.e. electrons) were removed from solution at low ORP (i.e. reducing environment).
The temperature was constant, 27.190.3°C and ammonia-nitrogen concentration
was usually below 0.1 mg l−1 during the period of operation. Hence, the
perfor-mance of the fuzzy logic controller was acceptable and independent of human input. In fact, the performance was much better than previous reports using the classical process control version of the bioreactor (Whitson et al., 1993; Lee et al., 1995; Turk et al., 1997).
outperformed the previously implemented classical process control system (Whitson et al., 1993; Lee et al., 1995) because of its ability to deal with continuous changes and to generate small or large control actions relative to the degrees of exhibited symptoms of problems (in our case the ORP and ORP change indicators) without human supervision. Furthermore, with fuzzy logic systems, several rules determin-ing the same control parameter (e.g. residence time) may fire simultaneously with varying strengths, depending on the degree of the input parameter in fuzzy sets
high, low, or medium. The inference mechanism, in such situations, combines the outputs of the various rules to form a consensus control action based on the strengths of all the contributing rules, approximating the human expert’s intuition based on their experience.
Acknowledgements
This research was funded in part by a contract from the Department of Commerce’s Small Business Innovative Research Grant Program (NA66RB0332), National Oceanic and Atmospheric Administration. It was also partially supported
by grants from the National Sea Grant Program (R/M-53) and the Texas A&M
University Sea Grant Program (R/M-58) as well as the Ortech Engineering, Inc.
research budget, the Marine Medicine budget of the Marine Biomedical Institute and the Biomedical Engineering Center at the University of Texas Medical Branch. The views expressed herein are those of the authors and do not necessarily reflect the views of the Department of Commerce or any of its sub-agencies or any of the above granting institutions. The authors would like to thank Christopher Zuercher and James Sinclair for their assistance with the set-up and operation of the bioreactor and the other employees of the National Resource Center for Cephalopods who assisted in the maintenance of the squid and fish production systems.
References
Balchen, J.G., 1987. Bridging the gap between aquaculture and information sciences. In: Balchen, J.G. (Ed.), Automation and Data Processing in Aquaculture. Pergamon, Oxford, pp. 11 – 15.
Balderston, W., Sieburth, J.M., 1976. Nitrate removal in closed-system aquaculture by columnar denitrification. Appl. Environ. Microbiol. 32, 808 – 818.
Bengtsson, G., Annadotter, H., 1989. Nitrate reduction in groundwater microcosm determined by15N gas chromatography-mass spectroscopy. Appl. Environ. Microbiol. 55 (11), 2861 – 2870.
Breck, W.G., 1974. Redox levels in the sea. In: Goldberg, D. (Ed.), The Sea — Ideas and Observations on Progress in the Study of the Seas, vol. 15. Marine Chemistry. Wiley, New York, pp. 153 – 180. Esteves, J.L., Mille, G., Blanc, F., Bertrand, J.C., 1986. Nitrate reduction activity in a continuous
flow-through in marine sediments. Microbial Ecol. 12, 283 – 290.
Heales, D., 1985. Water quality changes during the conditioning of small, closed seawater systems. Report 176. CSIRO Marine Laboratories, Cleveland, Qld, Australia.
Hopkins, J.S., Hamilton, R.D., Sandifer, P.S., Browdy, C.L., Stokes, A.D., 1993. Effect of water exchange rate on production, water quality, effluent characteristics and nitrogen budgets of intensive shrimp ponds. J. World Aquacult. Soc. 24 (3), 304 – 320.
Hopkins, T.A., Manci, W.E., 1993a. Aquaculture: opportunity now, part 2 — the power of opportunity. Aquacult. Mag. 19 (1), 30 – 38.
Hopkins, T.A., Manci, W.E., 1993b. Aquaculture: opportunity now, part 3 — education and coopera-tion. Aquacult. Mag. 19 (2), 60 – 72.
Lea, R., 1988. Automated space vehicle control procedures for rendezvous proximity operations. Informatics Telematics Int. J. 5, 179 – 185.
Lea, R., 1989. Applications of fuzzy sets to rule-based expert system development. Informatics Telematics Int. J. 6, 403 – 406.
Lea, R., Jani, Y., 1991. Fuzzy logic captures human skills. Aerospace America, pp. 25 – 27.
Lea, R., Jani, Y., 1992. Fuzzy logic in autonomous orbital operations. Int. J. Approximate Reasoning 6 (2), 151 – 184.
Lea, R., Jani, Y., 1994. Tether operations in space using fuzzy logic based length control. In: Mitra, S., Gupta, M., Kraske, W. (Eds.), Neural and Fuzzy Systems: The Emerging Science of Intelligence Computing, SPIE Optical Engineering Press, pp. 113 – 132.
Lea, R., Jani, Y., 1995. Intelligent sensor systems for space operations. In: Yen, J., Langari, R., Zadeh, L. (Eds.), Industrial Applications of Fuzzy Logic and Intelligent Systems. IEEE Press, New York, pp. 207 – 225.
Lea, R., Jani, Y., Brown, R., 1995. Application of fuzzy logic and neural networks in space operations. In: Hirota, K., Sugeno, M. (Eds.), Industrial Applications of Fuzzy Technology in the World, Advances in Fuzzy Systems — Applications and Theory, vol. 2. World Scientific Publishing, Singapore, pp. 297 – 368.
Lea, R., Jani, Y., Mica, J., 1997. Fuzzy logic control: basics and applications. In: Irwin, J.D. (Ed.), The Industrial Electronics Handbook. CRC Press/IEEE Press, Boca Raton, FL, pp. 1116 – 1126. Lea, R., Dohmann, E., Prebilsky, W., Lee, P., Turk, P., Ying, H., 1998. A fuzzy logic application to
aquaculture environment control. In: Proceedings of 17th North American Fuzzy Information Processing Society Conference, Pensacola, FL, pp. 29 – 33.
Lee, C.C., 1990. Fuzzy logic in control systems: fuzzy logic controller. IEEE Trans. Syst. Man Cybernet. 20, 404 – 435.
Lee, P.G., 1991. Automation of aquaculture systems: a review and practical guide to implementation. In: Engineering Aspects of Intensive Aquaculture. Northeast Regional Aquaculture Engineering Service, Ithaca, NY, pp. 284 – 300.
Lee, P.G., 1993. Computer automation of recirculating aquaculture systems. In: Wang, J.K. (Ed.), Techniques for Modern Aquaculture. American Society of Agricultural Engineers, St Joseph, MI, pp. 61 – 70.
Lee, P.G., 1995. A review of automated control systems for aquaculture and design criteria for their implementation. Aquacult. Eng. 14, 205 – 227.
Lee, P.G., 2000. Process control and artificial intelligence software for aquaculture. Aquacult. Eng., this volume.
Lee, P.G., Turk, P.E., Yang, W.T., Hanlon, R.T., 1994. Biological characteristics and biomedical applications of the squidSepioteuthis lessonianacultured through multiple generations. Biol. Bull. (Woods Hole) 186, 328 – 341.
Lee, P.G., Turk, P.E., Whitson, J.L., 1995. Automated control of a closed recirculating mariculture system with attached denitrification filter. In: Timmons, M.B. Jr (Ed.), Aquacultural Engineering and Waste Water Management. Northeast Regional Aquaculture Engineering Service, Cornell Univer-sity, Ithaca, NY, pp. 23 – 39.
Lee, P.G., Turk, P.E., Whitson, J.L., 1996. Controlled Denitrification Process and System. Patent Number 5,482,630 US Patent and Trademark Office, Washington, DC.
Mamdani, E., 1977. Application of fuzzy logic to approximate reasoning using linguistic synthesis. IEEE Trans. Comput. C-26 (12), 1182 – 1191.
McCarty, P.L., 1972. Energetics of organic matter degradation. In: Mitchell, R. Jr (Ed.), Water Pollution Microbiology. Wiley-Interscience, New York, pp. 91 – 118.
Moe, M.A. Jr, 1993. The Marine Aquarium Reference: Systems and Invertebrates. Green Turtle Publications, Plantation, FL, p. 510.
Muir, J.F., 1981. Management and cost implications in recirculating water systems. In: Proceedings of the Bio-Engineering Symposium for Fish Culture, Vol. 1, pp. 116 – 127.
Negoita, C., 1985. Expert Systems and Fuzzy Systems. Benjamin Cummings Publishing, Menlo Park, CA.
Payne, W.J., 1970. Energy yields and growth of heterotrophs. Annu. Rev. Microbiol. 24, 17 – 52. Payne, W.J., 1973. Reduction of nitrogenous compounds by microorganisms. Bacteriol. Rev. 37 (4),
409 – 452.
Pin, F., Watanabe, H., 1995. Autonomous navigation of a mobile robot using the behaviorist theory and VLSI fuzzy inferencing chips. In: Yen, J., Langari, R., Zadeh, L. (Eds.), Industrial Applications of Fuzzy Logic and Intelligent Systems. IEEE Press, New York, pp. 175 – 190.
Sille´n, L.G., 1965. Oxidation states of Earth’s ocean and atmosphere: a model calculation on earlier states: the myth of prebiotic soup. Archiv Kemi Acta 24, 431 – 456.
Sperl, G.T., Hoare, D.S., 1971. Denitrification with methanol: selective enrichment forHyphomicrobium
spp. J. Bacteriol. 108, 733 – 736.
Spotte, S., 1979. Seawater Aquariums: The Captive Environment. Wiley, New York.
Sugeno, M., 1985. Industrial Applications of Fuzzy Control. North Holland, Amsterdam, p. 269. Sugeno, M., Yasukawa, T., 1993. A fuzzy-logic-based approach to qualitative modeling. IEEE Trans.
Fuzzy Syst. 1, 7 – 31.
Takagi, H., 1995. Survey of fuzzy logic applications in image-processing equipment. In: Yen, J., Langari, R., Zadeh, L. (Eds.), Industrial Applications of Fuzzy Logic and Intelligent Systems. IEEE Press, New York, pp. 69 – 91.
Takagi, T., Sugeno, M., 1985. Fuzzy identification of systems and its applications to modeling and control. IEEE Trans. Syst. Man Cybernet. 15, 116 – 132.
Takagi, T., Yamaguchi, T., Yamamoto, S., 1995. Knowledge processing based on fuzzy associative memory and its application to a helicopter control. In: Yen, J., Langari, R., Zadeh, L. (Eds.), Industrial Applications of Fuzzy Logic and Intelligent Systems. IEEE Press, New York, pp. 107 – 128.
Takahashi, H., 1995. Fuzzy applications for automobiles. In: Hirota, K., Sugeno, M. (Eds.), Industrial Applications of Fuzzy Technology in the World. World Scientific, Singapore, pp. 171 – 192. Turk, P.E., 1996. Bacterial Bed. Patent Number 5,556,536, US Patent and Trademark Office,
Washing-ton, DC.
Turk, P.E., Lee, P.G., 1991. Design and economic comparison of airlift versus electric pump driven recirculating systems. In: Engineering Aspects of Intensive Aquaculture. Northeast Regional Aqua-culture Engineering Service, Ithaca, NY, pp. 271 – 283.
Turk, P.E., Lawrence, A.L., Lee, P.G., 1997. Design and operation of an environmentally isolated, marine shrimp broodstock culture system using closed, recirculating water filtration. In: Advances in Aquacultural Engineering, NRAES-105. Northeast Regional Agricultural Engineering Service, Cor-nell, NY, pp. 209 – 218.
Van Gorder, S., 1991. Optimizing production by continuous loading of recirculating systems. In: Design of High Density Recirculating Aquaculture Systems, A Workshop Proceedings, Louisiana State University, Baton Rouge, LA, Sept. 25 – 27, 1991, pp. 10 – 15.
van Rijn, J., Rivera, G., 1990. Aerobic and anaerobic biofiltration as an aquaculture unit — nitrite accumulation as a result of nitrification and denitrification. Aquacult. Eng. 9, 217 – 234.
Wakami, N., Nomura, H., Araki, S., 1995. Intelligent home appliances using fuzzy technology. In: Hirota, K., Sugeno, M. (Eds.), Industrial Applications of Fuzzy Technology in the World. World Scientific, Singapore, pp. 215 – 240.
of an Aquacultural Engineering Conference. American Society of Agricultural Engineers, St Joseph, MI, pp. 326 – 334.
Whitsell, A., Lee, P.G., 1994. A plug-and-play machine vision application for aquaculture. Sci. Comput. Autom. 10 (8), 29 – 32.
Whitsell, A., Whitson, J., Lee, P.G., 1997. A machine vision system for aquaculture: real-time identification of individual animals and estimation of animal activity. In: Advances in Aquacultural Engineering, NRAES-105. Northeast Regional Agricultural Engineering Service, Cornell, NY, pp. 112 – 128.
Whitson, J., Turk, P., Lee, P., 1993. Biological denitrification in a closed recirculating marine culture system. In: Wang, J.K. (Ed.), Techniques for Modern Aquaculture. American Society of Agricultural Engineers, St Joseph, MI, pp. 458 – 466.
Yang, W.T., Hanlon, R.T., Lee, P.G., Turk, P.E., 1989. Design and function of closed seawater systems for culturing loliginid squids. Aquacult. Eng. 8, 47 – 65.
Yasunobu, S., Myamota, S., 1985. Automatic train operation by predictive fuzzy control. In: Sugeno, M. (Ed.), Industrial Applications of Fuzzy Control. North Holland, Amsterdam, pp. 1 – 18. Ying, H., Sheppard, L.C., Turk, P., Lee, P., 1992. Modeling a squid culture tank system. In: Proceedings
of the 1992 International Simulation Technology Conference, Society of Computer Simulation, San Diego, CA, pp. 412 – 415.
Zadeh, L.A., 1965. Fuzzy sets. Inf. Cont. 8, 338 – 352.
Zadeh, L.A., 1992. The calculus of fuzzy if/then rules. AI Expert 7 (3), 23 – 27.
Zimmermann, H.-J., 1991. Fuzzy Set Theory and Applications. Kluwer, Dordrecht, p. 399.