Hard clam (
Mercenaria
spp.) aquaculture in
Florida, USA: geographic information system
applications to lease site selection
William S. Arnold
a,*, Mary W. White
a, Henry A. Norris
a,
Mark E. Berrigan
b,1aFlorida Marine Research Institute,100 Eighth A6enue SE,St. Petersburg,FL 33701-5095, USA bFlorida Department of En6ironmental Protection,3900 Commonwealth Boule6ard,Tallahassee,
FL 32399-3000, USA
Received 10 June 1998; accepted 10 August 1999
Abstract
The aquaculture industry continues its worldwide growth pattern, and in Florida USA development of this industry is fully supported by state governmental entities. The informa-tion base for husbandry and marketing of aquaculture products is well established, but less information is available for determining appropriate locations for aquaculture operations. A Geographic Information System (GIS)-based approach for identifying appropriate sites for aquaculture grow-out, derived from the work on hard clam (Mercenaria spp.) aquaculture lease site selection in Florida but applicable to any aquaculture product requiring field grow-out, is described. First the application of the methodology in the Indian River lagoon on the east central coast of Florida, where clam aquaculture operations have been extant for over a decade, is discussed. It is then shown how this technology can be transferred to Charlotte Harbor, Florida, an estuary where hard clam aquaculture operations are in the incipient phase of development. In Charlotte Harbor, a 6321 ha subset of the estuary is identified that appears suited for hard clam aquaculture, dependent upon additional surveys that can be specifically targeted to the sites identified. Thus, the effort required for site-specific surveys is considerably reduced by eliminating much unsuitable area. In sum-mary the biological and management implications of this approach to lease site allocation for
www.elsevier.nl/locate/aqua-online
* Corresponding author. Tel.: +1-727-8968626; fax:+1-727-8931374.
E-mail address:[email protected] (W.S. Arnold)
1Present Address: Florida Department of Agriculture and Consumer Services, Division of Aquacul-ture, Tallahassee, FL 32399, USA.
hard clams and other suitable species are considered. Published by Elsevier Science B.V.
Keywords:GIS; Hard clam;Mercenaria; Aquaculture; Lease site selection
1. Introduction
Considerable effort has been expended on the development of suitable tech-niques for the effective culture and marketing of a variety of aquatic animal and plant species, including for example various algae, invertebrates such as clams and shrimp, and a host of vertebrate fish species (e.g. Rosenthal et al., 1995). In contrast, much less effort has been expended to assist in the crucial process of selecting a site suitable for field grow-out of the chosen species (e.g. Kapetsky et al., 1987, 1988; Meaden and Kapetsky, 1991; Ross et al., 1993; Fridley, 1995; Kapetsky and Nath, 1997; Aguilar-Manjarrez and Nath, 1998; Parker et al., 1998; Rubec et al., 1998). As a result, a substantial database is available that describes appropriate feeds, expected growth rates, reproductive seasonality, and rates of mortality for a lengthy list of potentially aquaculture-suitable species. Unfortunately, much of that information has been derived under laboratory or controlled conditions, and even the information that has been obtained from field grow-out is site-specific and may have little applicability at other sites. Such information is adequate for animals that are cultured exclusively under controlled conditions. However, field grow-out is essential to obtain the production scales and economic returns necessary to fulfil the promise of aquaculture and to adequately supplement marine capture fisheries (Meaden and Kapetsky, 1991). Successful large-scale aquaculture therefore requires the selection of a grow-out site that will provide rates of economic return predicted under laboratory and controlled grow-out situations. Until recently, that process of site selection has largely been ignored, especially in the marine environment (Aguilar-Manjarrez and Ross, 1995).
In Florida, USA, the economic potential of aquaculture is recognized both by individual citizens migrating into the industry and by local and state governmental entities responsible for management of this emerging economic sector. Aquaculture is fully supported by state government in Florida (Florida Statutes, 1996), and that support has led to the development of successful ventures particularly in the tropical fish, alligator, catfish, and (in the marine environment) shellfish industry subsectors. The hard clam (Mercenaria spp.) has emerged in the last decade as one of the most economically important aquaculture species in the marine environment. Hard clam aquaculture in Florida has expanded from an essentially non-existent industry (B1% of total 1993 commercial clam landings in Florida) to an industry
with annual landings approaching $4.6 million (\55% of total 1997 commercial
adequate and suitable nearshore habitat within which to produce clams, while minimizing conflict with other user-groups demanding access to these extremely resource-rich shallow coastal waters.
Multiple criteria must be considered when determining the suitability of a site for hard clam aquaculture (Berrigan, 1996). The State of Florida requires that hard clam leases be located in areas containing natural densities of less than five clams per m2to avoid conflict with the fishery for naturally occurring clams, and in areas that are essentially devoid (1% coverage or less) of rooted aquatic vegetation to avoid negative impacts on this important natural resource. For harvesting purposes, the lease must be located within an Approved or Conditionally Approved shellfish harvesting zone (Table 1; Berrigan, 1996), with Approved zones being most desirable and Conditionally Approved zones being least desirable. To avoid inter-ference with vessel traffic, the lease borders must be located a minimum of 30 m from the nearest recognized navigational channel. Finally, from the perspective of the culturist, sites located in water depths less than 1.8 m are most desirable for ease of maintenance and because the clams grow faster in shallower water (Arnold et al., 1991). The culturist also desires a site that is located in close proximity to a boat ramp to facilitate site access and product transport, although not so close as to experience negative impacts from boating traffic. Finally, it is useful to identify areas that have been historically characterized by water quality suitable for the
Table 1
Shellfish harvesting area classifications for Florida waters (Rodriguez, 1998)
Classification Criteria
Approved Dangerous concentrations of fecal material, pathogenic microorganisms, and poisonous or deleterious substances are not present.
Conditionally Approved The area meets Approved area classification criteria. Bacterial pollution is intermittent, and conditions associated with the release, persistence, and distribution of bacterial pollution are known. A management plan is available for closing and reopening the area that includes the administrative procedures to implement those actions.
The area is not so contaminated with poisonous or deleterious substances Restricted
that consumption of shellfish after relaying or controlled purification would be hazardous. Shellfish harvesting from Restricted areas is allowed only by special license and requires State approved monitors.
Conditionally Restricted The area will meet Restricted area classification criteria. The area is not so contaminated with poisonous or deleterious substances that
consumption of shellfish after suitable purification would be hazardous. A management plan is available for closing and reopening the area that includes the administrative procedures to implement those actions. Fecal material, pathogenic microorganisms, or poisonous or deleterious Prohibited
substances are consistently or unpredictably present in dangerous concentrations. Alternatively, surveys identify actual or potential pollution sources of high magnitude which may affect the shellfish harvesting area. Unclassified A comprehensive shellfish harvesting survey is not available for the area.
Table 2
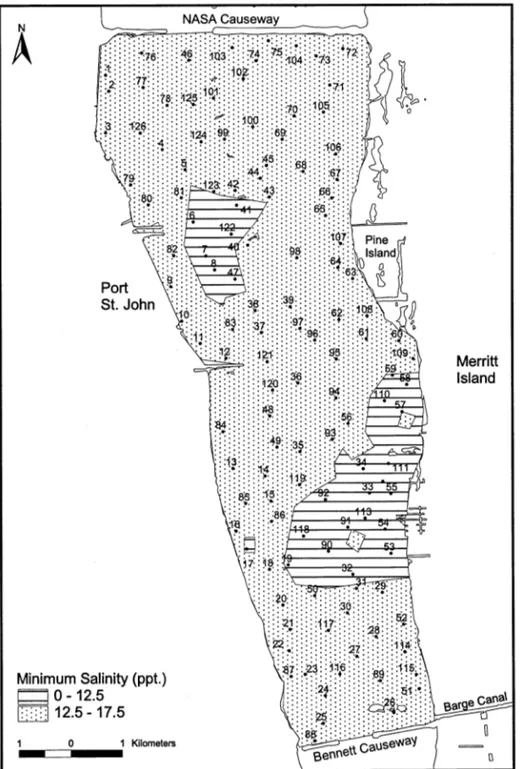
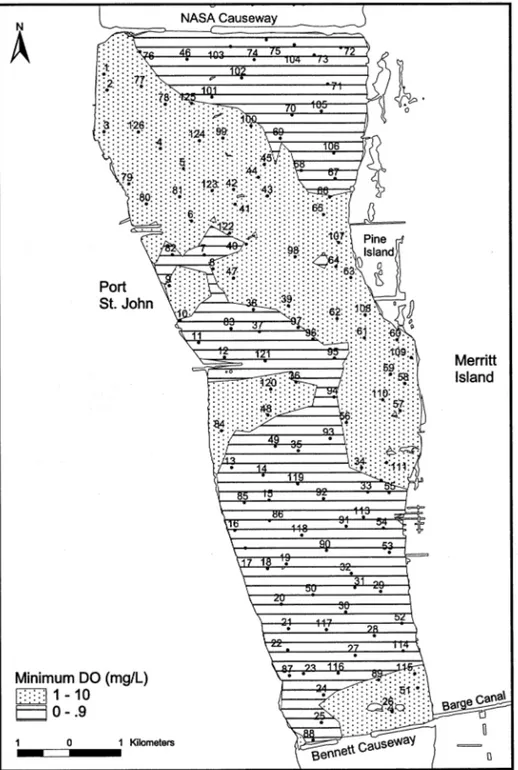
List of stations used in the determination of minimum salinity and dissolved oxygen (D.O.) in Shellfish Harvesting Area C (SHA C) of the Indian River lagoona
End year Minimum salinity (ppt) Minimum D.O. (mg/l) Station no. N Start year
98 13.0
Table 3
List of stations used in the determination of minimum salinity and dissolved oxygen (D.O.) in Charlotte Harbora
End year Minimum salinity (ppt) Minimum D.O. (mg/l) Station no. N Start year
Table 3 (Continued)
End year Minimum salinity (ppt) Minimum D.O. (mg/l)
N
aSee Figs. 11 and 12 for locations of water quality sampling stations. N=number of samples collected at that station during the sampling interval. The letter preceding the station number indicates the Shellfish Harvesting Area (SHA) from which the data were collected (G, Gasparilla Sound; M, Myakka River; P, Pine Island Sound; F, FMRI Fisheries Independent Monitoring Program).
growth and survival of the target organism throughout the 10-year life of the aquaculture lease (Berrigan, 1996).
Nath, 1997) fisheries. These applications are extended to a coastal marine inverte-brate, the hard clam Mercenaria spp., and the capabilities of GIS techniques in providing a user-friendly approach to selecting individual lease sites that may be only several hectares in areal extent are emphasized.
2. Methods
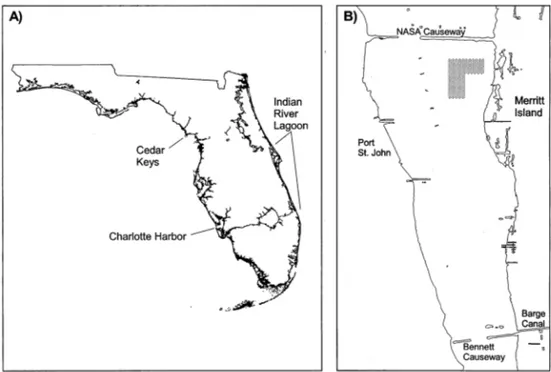
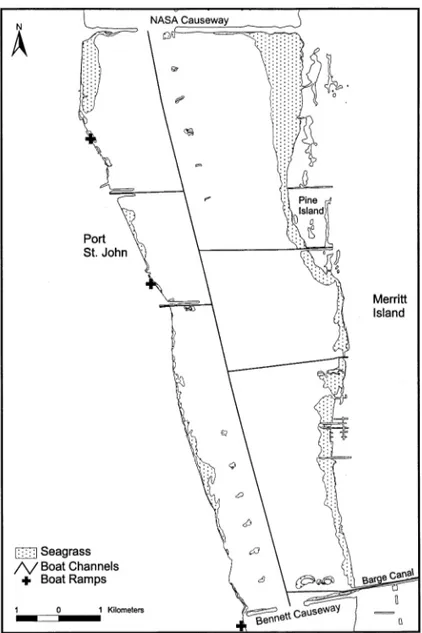
In Florida, hard clam aquaculture originally developed in the Indian River lagoon (Fig. 1A), on the east central coast of the state, during the mid-1980s (Vaughan, 1988). That lagoon also supports an important commercial clam fishery, and the distribution pattern of clams throughout the lagoon has been mapped on several occasions with particular emphasis on an area between Bennett Causeway and NASA Causeway known as Shellfish Harvesting Area (SHA) C (Fig. 1B). This area supports the most productive natural clam beds and the highest concentration of active clam aquaculture leases in the lagoon. The most recent and comprehensive survey of SHA C was conducted during 1994, when 126 randomly selected and geographically referenced stations were sampled (Fig. 2). Each sample station consisted of a 1-m2quadrat from which a SCUBA diver hand-raked all legal-sized
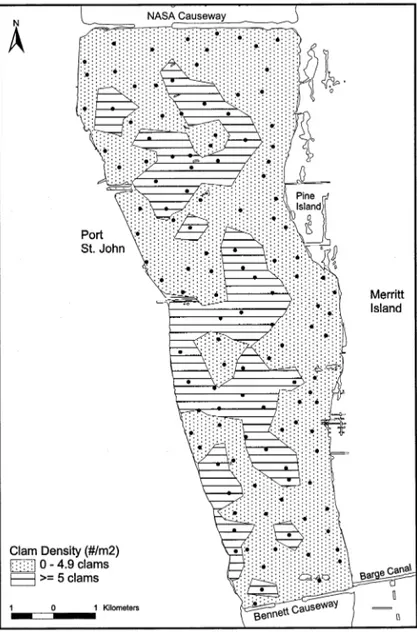
Fig. 2. Distribution of the natural hard clam population in Indian River Shellfish Harvesting Area (SHA) C during 1994. Two ranges are reported: areas with densities less than five clams per m2 are suitable for clam culture whereas those areas with densities of five or more clams per m2are reserved for access by the natural clam fishery. , locations of clam sampling stations.
clams (minimum 25.4 mm across the shell valves) and at which latitude and longitude coordinates were recorded using a Garmin GPS-75 hand-held Geographic Positioning System (GPS) unit.
were then generated within ArcView using an exponential inverse-distance matrix for weighting sample points, with an exponent of four and four nearest-neighbors. The number of nearest-neighbors defines the domain for the integration among sample points, and the exponent of the inverse-distance matrix determines the rate at which the influence of each point drops off with distance (the higher the exponent, the less influence with distance) (Anonymous, 1996).
A digital map layer representing hard clam density was generated and output. Pertinent geographically-referenced digital map layers were then added, including long-term water quality estimates for salinity and dissolved oxygen (D.O.), seagrass distribution, bathymetry, shellfish harvesting zone classifications, the location of navigable channels, and the location of boat ramps. The resultant product was a composite map of SHA C upon which the Spatial Analyst component of the ArcView software program could be applied to isolate areas that met certain preselected criteria. Spatial Analyst provides the capability to perform locational analyses on both vector (point-to-point) and binary (cell-based) data layers (Anony-mous, 1996). A cell size of 1 ha was chosen, equivalent to the minimum resolution available from the seagrass maps. The composite database can be queried to identify the location of specific features of interest to the investigator (e.g. Rubec et al., 1998, 1999). For Indian River SHA C, the location of all sites that were less than 1.8 m deep, contained no seagrass, were a minimum of 30 m from the nearest marked navigable channel, and supported fewer than five clams per m2 were requested.
Shellfish harvesting classifications and boat ramps were also considered, but those criteria were ranked because their value is relative. Two shellfish harvesting zones are suitable for hard clam aquaculture (Berrigan, 1996), but operations located within Approved zones are optimal because shellfish can be harvested essentially any time, whereas in Conditionally Approved zones there may be harvest restrictions at certain times or under certain conditions (Table 1). Thus, these zones were ranked with Approved zones being more desirable and Conditionally Ap-proved zones being less desirable according to their relative ease of access. Distance to the nearest boat ramp also was ranked; sites within 500 m of a boat ramp were ranked lowest in desirability because of interference by boat traffic that could disrupt operations and disturb the clams, whereas sites between 500 and 5000 m from the nearest boat ramp were ranked highest due to ease of access, and sites greater than 5000 m from the nearest boat ramp were ranked intermediate due to greater transport distance of clams and materials.
The resultant data sets were then categorized according to their suitability for supporting clam growth and survival.
Clams are able to survive salinities as low as 12.5 parts per thousand (ppt), but shell growth slows below 20 ppt and essentially ceases below 17.5 ppt (Castagna and Chanley 1973). Thus, four salinity categories were applied, these being unac-ceptable (B12.5 ppt), marginal (12.5 – 17.5 ppt), acceptable (17.5 – 20 ppt), and
ideal (\20 ppt). The upper limit of suitable salinity for hard clams generally
exceeds 35 ppt (Castagna and Chanley, 1973; Malouf and Bricelj, 1989), a value that was not encountered at any Indian River station.
Hard clams are tolerant of low oxygen levels, but levels of 0.9 mg/l or less may impair burrowing and possibly other physical and physiological functions (Malouf and Bricelj, 1989). Therefore a minimum acceptable D.O. of 1.0 mg/l was applied, below which the area was considered unsuitable for hard clam aquaculture.
From its origins in the Indian River lagoon, the clam aquaculture industry has expanded to several other areas of the state, including the Cedar Keys area and Charlotte Harbor (Fig. 1A). Clam aquaculture has been extant in the Cedar Keys region for several years, but the industry is just developing in Charlotte Harbor and it is in that estuary that these techniques have their most timely application. Charlotte Harbor was therefore used as an example of the application of the methods for the selection of sites suitable for hard clam aquaculture and as a means of determining what additional information is required in order to make informed lease-site selections within that estuary.
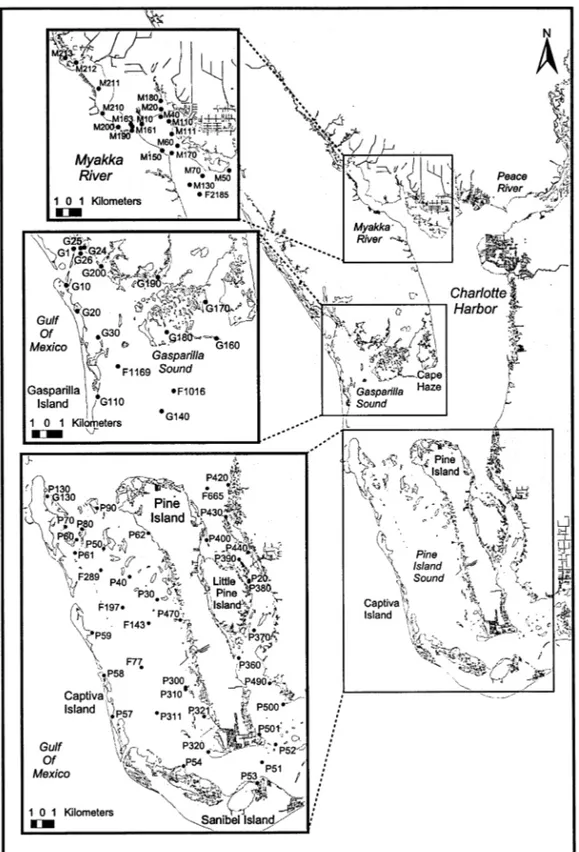
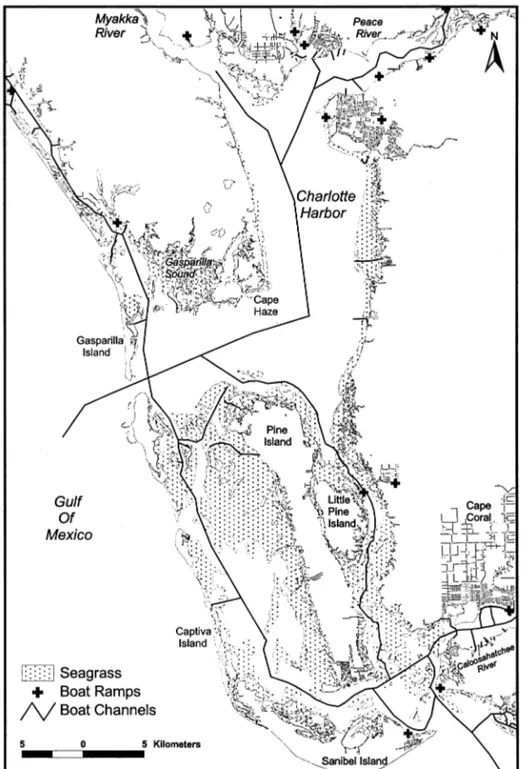
Information on seagrass distribution, long-term water quality estimates for salinity and D.O. collected at 79 stations (Fig. 3) during 1984 through 1998 (Seagle, 1996; Rodriguez, 1998; Rodriguez and Seagle, 1998; McMichael, unpub. data), bathymetry, the location of boat ramps and navigable channels, and shellfish harvesting classifications was available for the Charlotte Harbor estuary. However, clam distribution surveys have not been conducted in Charlotte Harbor, so a clam data layer was not included in this analysis. Using the same techniques that were applied to the Indian River SHA C analysis, the available data were used to construct a composite GIS map of the estuary. Spatial Analyst was then used to query the database for the location of sites that contained no seagrass, occupied water depths less than 1.8 m, were no closer than 30 m to the nearest navigable channel, and possessed suitable water quality characteristics as described above for the Indian River. The relative suitability of the resultant sites was determined based upon location within an Approved or Conditionally Approved shellfish harvesting zone and upon distance to the nearest boat ramp. The same ranking scheme was applied to the salinity, harvesting zone, and boat ramp criteria as was applied in the Indian River.
3. Results
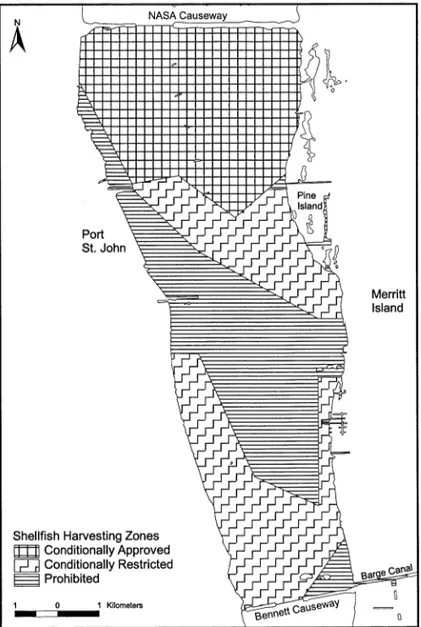
and western shorelines (Fig. 5), the distribution and abundance of legal-sized clams recorded during 1994 (Fig. 2), historical minimum salinity (Fig. 6) and D.O. (Fig. 7) distribution patterns, the location of navigable channels (Fig. 5), and shellfish harvesting zones (Fig. 8). No Approved shellfish harvesting zones were located within SHA C. Also, the status of each zone changes with season (Vanderbleek, 1993), so the most restrictive classification was used (winter; December – February) in the analyses to provide for the most conservative placement of leases. Thus, restrictions on clam harvest may be less stringent during certain times of the year, but they have been modeled using the more stringent harvesting conditions.
Fig. 5. Location of seagrass beds, boat ramps, and navigation channels in Shellfish Harvesting Area (SHA) C of the Indian River lagoon, Florida.
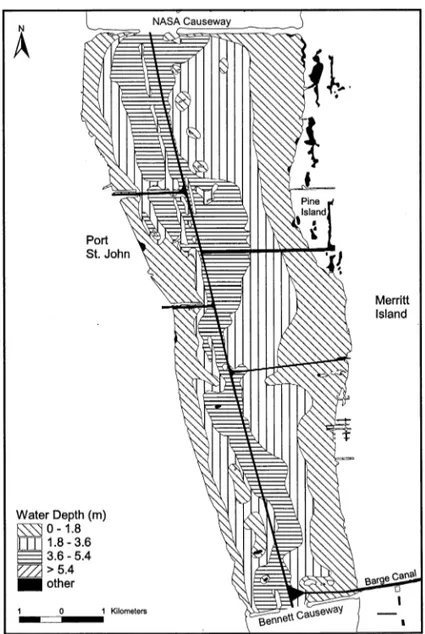
The analysis of Indian River SHA C was conducted after the allocation of 28 lease sites within that area (see Fig. 1B for approximate locations). Although water
Fig. 7. Minimum dissolved oxygen (D.O., mg/l) contours in Shellfish Harvesting Area (SHA) C of the Indian River lagoon, Florida. Numbers denote sample station locations (see Table 2).
Fig. 8. Shellfish harvesting classifications in Shellfish Harvesting Area (SHA) C of the Indian River lagoon, Florida, during winter (December – February). Only the Conditionally Approved area is suitable for hard clam aquaculture.
Fig. 9. Areas suitable for hard clam aquaculture leases in Shellfish Harvesting Area (SHA) C of the Indian River lagoon, Florida. Areas categorized as ‘unsuitable’ are not appropriate for hard clam aquaculture due to the presence of seagrass, high density clam populations recorded during the 1994 survey, low levels of D.O. recorded between 1987 and 1998, excessive water depth or the proximity of navigable channels, or low salinity conditions inimical to clam survival. Of the remaining area, those cells classified as ‘prohibited’ (=Prohibited or Conditionally Restricted classification) do not meet shellfish harvesting water quality standards. In the legend, CA, Conditionally Approved shellfish harvesting area; D.O., dissolved oxygen (mg/l); Sal, salinity (ppt); range in meters represents water depth (first) or distance to the nearest boat ramp (second).
Therefore, the results from the Indian River provide an a posteriori test of a GIS-based approach for selecting hard clam lease sites.
The State of Florida is still allocating lease sites in Charlotte Harbor and the results are applicable to that decision making process. There, available informa-tion on bathymetry (Fig. 10), seagrass distribuinforma-tion (Fig. 11), historical minimum salinity (Fig. 12) and D.O. (Fig. 13) distribution patterns, and shellfish harvesting zone classifications (Fig. 14) were used to develop a composite map of sites that met the same criteria that had been established for lease site selection in the Indian River. The result was a map identifying 1844 ha of submerged land that appears ideal for hard clam aquaculture (Fig. 15), although the nearest boat ramp is \5000 m distant. Another 4477 ha are suitable for clam aquaculture but
occasionally experience salinity levels that, though not fatal to the clams, may cause a slowing or cessation of growth (Fig. 15). As in the Indian River lagoon, most of the areas deemed not suitable for aquaculture were constrained by the presence of seagrass (17 455 ha), low levels of D.O. (227 ha), spoil areas or proximity to boat ramps (554 ha, see Fig. 9), low salinity (2881 ha), water depths exceeding 1.8 m (11 361 ha), or a Conditionally Restricted or Prohibited shellfish harvesting classification (7956 ha).
4. Discussion
Economically successful hard clam aquaculture requires a terminal field grow-out phase, and the proper selection of a site for field culture is one of the most important decisions that a hard clam farmer will have to make. For both biologi-cal and social reasons, the location of the grow-out site may largely determine the ultimate success of the venture. In Florida, it is necessary to choose sites that support economically viable growth and survival while not directly or indirectly interfering with alternative ecosystem functions such as primary production, navi-gation, or alternative fisheries (Berrigan, 1996). The application of GIS provides an effective methodology for identifying and quantifying areas of potential confl-ict, thereby removing much of the uncertainty involved in the lease-site selection process while providing a quantitative and objective means of planning the growth of the hard clam aquaculture industry.
For hard clams in the Indian River lagoon, it is desirable to maximize the area available for aquaculture while minimizing resource impacts and overlap with the natural clam fishery. Those goals were achieved by first excluding 622 ha of seagrass habitat from consideration. From the remaining area, 1737 ha of natu-rally productive clam habitat (from which a minimum of five clams per m2
Fig. 10. Water depth ranges (m) in Charlotte Harbor, Florida.
Fig. 12. Minimum salinity contours (ppt) in Charlotte Harbor, Florida. The blank areas represent Unclassified shellfish harvesting waters that were not included in the analyses.
harvesting waters are definitive, other considerations such as historic water qual-ity patterns, water depth, and clam densqual-ity are subject to reconsideration or compromise. For example, in Indian River SHA C, hard clam leases have been occupied and relatively profitable for over 10 years. During 1996 through 1998, however, landings were substantially and negatively impacted by increased rainfall within the lagoonal watershed. Salinities that previously had rarely decreased below 20 ppt (McCall et al., 1970; Arnold et al., 1996) fell to levels of 13 – 14 ppt. The results of the present study are reflective of that incident. The minimum salinities that were reported for SHA C are uniformly below the 17.5 ppt growth threshold (Castagna and Chanley, 1973), although historic hard clam growth rates in that area have been rapid relative to other areas of the lagoon (Arnold et al., 1996). If the water quality analysis had been conducted using only pre-1996 data, salinity in that area would have appeared to be ideal for clam growth, and in fact that is essentially the approach that was taken when hard clam leases in SHA C were originally allocated. It is clear that, although the application of GIS to hard clam lease siting provides a useful tool for correlating and evaluating available data, the process is dependent upon valid and representative data (Thapa and Bossler, 1992). Even more importantly, historic patterns do not necessarily provide a reliable estimate of future events. The relatively low salinity recorded in Indian River SHA C during 1996 through 1998 may be a short-term response to increased freshwater input during that time or it may be a long-term response to changing environmental conditions. That distinction is critical to the long-term success of hard clam aquaculture in SHA C of the Indian River lagoon.
The constraints placed on water depth and clam density also are subject to discussion and reevaluation. The location of suitable lease sites was restricted to that area within the 1.8 m depth contour because clam aquaculture is most effectively executed within those shallow waters. However, an individual culturist may be willing to work in deeper water if other conditions are acceptable. Thus, the total area available for hard clam aquaculture in SHA C could be increased by expanding into deeper water. In contrast, participants in the natural clam fishery have argued for a more restrictive minimum clam density. Five clams per m2
is equivalent to 100 000 clams per 2 ha lease site, which represents $10 000 in clam value using a conservative average price of $0.10 per clam and assuming that all clams are marketable (the validity of which is dependent upon the size structure of the clam population within the lease site). The total area available for hard clam aquaculture in SHA C could be considerably decreased by institut-ing a more restrictive minimum allowable natural clam density.
groups, and to discuss and consider the impacts of each alternative (e.g. Steele and Norris, 1995). Such an approach will be useful in Charlotte Harbor, where hard clam aquaculture is just developing and where lease site selection is in the incipient phase, and in other areas of Florida where the culture of hard clams or other species may be desirable and appropriate.
The 6321 ha potentially available for hard clam aquaculture in Charlotte Harbor represent an order of magnitude increase over the area available in SHA C of the Indian River lagoon. The total area considered within Charlotte Harbor (46 755 ha) was considerably greater than that considered within SHA C (5405 ha). On a percentage basis, 13.5% of submerged land that was included within the Charlotte Harbor analysis was deemed suitable for hard clam aquaculture, com-pared with 5.2% of submerged land analyzed within SHA C. The Charlotte Harbor analysis does not include a consideration of hard clam abundance because those data are not available. In SHA C, 1737 ha of non-seagrass habitat were removed from consideration due to the clam density constraint. Personal observa-tion (W.S.A. and M.E.B.) and the lack of a commercial fishery suggest that abundance of naturally occurring hard clams is considerably lower in Charlotte Harbor than in SHA C of the Indian River lagoon. Regardless, the identification of potential lease sites using GIS considerably reduces the effort required in surveying for hard clam density, since only those areas previously identified as potentially suitable need be surveyed.
The present study has attempted to include as much available and pertinent information as possible in the analysis of suitable lease sites for hard clam aquaculture in Florida, but the process could be further refined with additional information. For example, another requirement of clam leases is that they be a minimum of 305 m from privately-held upland properties (Berrigan, 1996). Thus, the present model could be constrained further by incorporating a 305 m shore-line setback, although that requirement does not pertain to land owned by the lessee and therefore may be excessively conservative. Also, at least for the Indian River lagoon, considerable information is available concerning growth patterns of natural clam populations among areas and habitats (Arnold et al., 1996). Al-though growth of naturally occurring clams may differ from that of cultured clams due to the techniques employed for aquaculture growout (e.g. mesh bag containers), growth information has been effectively applied in lease site models for fish farming in Africa (Aguilar-Manjarrez and Nath, 1998) and Latin America (Kapetsky and Nath, 1997).
and representative benthic community (Landesman, 1994; Rosenthal, 1994). The long-term impacts of clam aquaculture activities in Florida have not been stud-ied, but such studies will benefit from effective a priori surveys of the lease site that are compatible with a GIS-based analysis.
In conclusion, 281 ha of benthic habitat within the SHA C of the Indian River lagoon, and 6321 ha of benthic habitat within Charlotte Harbor, have been identified that appear suitable for hard clam aquaculture. There are presently 94 ha under lease for hard clam aquaculture in SHA C and 84 ha under lease for hard clam aquaculture in Charlotte Harbor. Thus, there remains some room for expansion of hard clam aquaculture in SHA C of the Indian River lagoon, and considerable room for expansion of hard clam aquaculture in Charlotte Harbor. The techniques which are described here will assist in the assignation of those leases in an orderly and predictable manner, and may also be used in the development of baseline environmental assessments that can be applied at lease termination to determine the environmental impacts of the lease. This application of GIS technology provides an interactive and microscale approach to aquaculture lease siting that has applicability for any species re-quiring field culture, can be used to resolve conflicts among alternative user groups, and can be used to monitor individual lease sites from initiation to termination.
Acknowledgements
Field assistance provided by Kim Bjorgo, Catherine Bray, John Gunter, Dan Marelli, James Marshall, and Justin Styer is gratefully acknowledged. Rob Hud-son assisted with preparation of map layers, and Bob Brock and Felice Drouin were instrumental in obtaining supporting literature. Tim MacDonald, Catherine Bray, and Howard Beadle provided water quality information. The final version of this manuscript was enhanced by the comments of Dr James Kapetsky and two anonymous reviewers. Partial funding was generously provided by the li-censed clammers of Brevard County, Florida.
References
Aguilar-Manjarrez, J., Nath, S.S., 1998. A strategic assessment of fish farming potential in Africa. CIFA Tech. Paper No.32, FAO, Rome, p. 170.
Aguilar-Manjarrez, J., Ross, L.G., 1995. GIS enhances aquaculture development. GIS World 8, 52 – 56. Anonymous, 1996. ArcView Spatial Analyst: Advanced spatial analysis using raster and vector data.
Environmental Systems Research Institute, Redlands, California, p. 148.
Arnold, W.S., Marelli, D.C., Bert, T.M., Jones, D.S., Quitmyer, I.R., 1991. Habitat-specific growth of hard clamsMercenaria mercenaria(L.) from the Indian River, Florida. J. Exp. Mar. Biol. Ecol. 147, 245 – 264.
Berrigan, M.E., 1996. Site selection criteria for leasing sovereign submerged lands for aquaculture purposes. Internal Report, Florida Department of Environmental Protection, Division of Marine Resources, p. 7.
Castagna, M., Chanley, P., 1973. Salinity tolerance of some marine bivalves from inshore and estuarine environments in Virginia waters on the western mid-Atlantic coast. Malacologia 12, 47 – 96.
Florida Statutes, 1996. Aquaculture definitions; marine aquaculture products and producers. Chapter 370.26, 1996 Supplement to Florida Statutes 1995, p. 1131.
Fridley, R.B., 1995. The opportunities for engineering and technology in addressing the environmental, institutional, and economic constraints of marine aquaculture in the United States. Estuaries 18, 18 – 24.
Grant, J., Hatcher, A., Scott, D.B., Pocklington, P., Schafer, C.T., Winters, G.V., 1995. A multidisci-plinary approach to evaluating impacts of shellfish aquaculture on benthic communities. Estuaries 18, 124 – 144.
Kaiser, M.J., Laing, I., Utting, S.D., Burnell, G.M., 1998. Environmental impacts of bivalve maricul-ture. J. Shellfish Res. 17, 59 – 66.
Kapetsky, J.M., Nath, S.S., 1997. A strategic assessment of the potential for freshwater fish farming in Latin America. COPESCAL Tech. Paper No. 10, FAO, Rome, p. 128.
Kapetsky, J.M., McGregor, L., Herbert, N.E., 1987. A geographical information system and satellite remote sensing to plan for aquaculture development: a FAO-UNEP/GRID cooperative study in Costa Rica. FAO Fish. Tech. Pap. No. 287, FAO, Rome, p. 51.
Kapetsky, J.M., Hill, J.M., Worthy, L.D., 1988. A geographical information system for catfish farming development. Aquaculture 68, 311 – 320.
Kapetsky, J.M., Hill, J.M., Worthy, L.D., Evans, D.L., 1990. Assessing potential for aquaculture development with a geographic information system. J. World Aqua. Soc. 21, 241 – 249.
Landesman, L., 1994. Negative impacts of coastal aquaculture development. World Aquacult. 25, 12 – 17.
Malouf, R.E., Bricelj, V.M., 1989. Comparative biology of clams: environmental tolerances, feeding, and growth. In: Manzi, J.J., Castagna, M. Jr (Eds.), Clam Mariculture in North America. Elsevier, Amsterdam, pp. 23 – 73.
McCall, D., Cook, J.G., Lasater, J.A., Nevin, T.A., 1970. A survey of salinity levels in the Indian River – Banana River complex. Bull. Environ. Contam. Toxicol. 5, 414 – 421.
Meaden, G.J., Kapetsky, J.M., 1991. Geographical information systems and remote sensing in inland fisheries and aquaculture. FAO Fish. Tech. Pap. No. 318, FAO, Rome, p. 262.
Mojica, R. Jr, Nelson, W.G., 1993. Environmental effects of a hard clam (Mercenaria mercenaria) aquaculture site in the Indian River lagoon, Florida. Aquaculture 113, 313 – 329.
Parker, M.R., Beal, B.F., Congleton, W.R. Jr, Pearce, B.R., Morin, L., 1998. Utilization of GIS and GPS for shellfish growout site selection. J. Shellfish Res. 17, 1491 – 1495.
Rodriguez, C.A., 1998. Comprehensive shellfish harvesting area survey of Pine Island, Lee County, Florida. Florida Dept. Env. Prot., Shellfish Environmental Assessment Section, p. 202.
Rodriguez, C.A., Seagle, J.S., 1998. Comprehensive shellfish harvesting area survey of Myakka River, Charlotte and Sarasota Counties, Florida. Florida Dept. Env. Prot., Shellfish Environmental Assessment Section, p. 160.
Rosenthal, H., 1994. Aquaculture and the environment. World Aquacult. 25, 4 – 11.
Rosenthal, H., Allen, J.H., Helm, M.M., McInerney-Northcott, M., 1995. Aquaculture technology: its application, development, and transfer. In: Boghen, A.D. (Ed.), Cold-Water Aquaculture in At-lantic Canada, 2nd Edition. Universite de Moncton, New Brunswick, Cananda, pp. 395 – 448. Ross, L.G., Mendoza, Q.M., Beveridge, M.C.M., 1993. The application of geographical information
systems to site selection for coastal aquaculture: an example based on salmonid cage culture. Aquaculture 112, 165 – 178.
Rubec, P.J., Bexley, J.C.W., Norris, H., Coyne, M., Monaco, M.E., Smith, S.G., Ault, J.S., 1999. Suitability modeling to delineate habitat essential to sustainable fisheries. In: Benaka, L. (Ed.), Fish Habitat: Essential Fish Habitat and Rehabilitation. American Fisheries Society, Symposium 22, Betheseda, MD, pp. 108 – 133.
Seagle, J., 1996. Comprehensive shellfish harvesting area survey of Gasparilla Sound, Charlotte and Lee Counties, Florida. Florida Dept. Env. Prot., Shellfish Environmental Assessment Section, p. 186. Steele, P., Norris, H.A., 1995. Using GIS to explore shrimp management options in Florida. Abstract,
American Fisheries Society 125th Annual Meeting, Tampa, Florida, p. 62.
Thapa, K., Bossler, J., 1992. Accuracy of spatial data used in Geographic Information Systems. Photogr. Eng. Remote Sens. 58, 835 – 841.
Vanderbleek, D., 1993. Comprehensive shellfish harvesting area survey of Body C, Brevard County, Florida. Florida Dept. Nat. Res., Shellfish Environmental Assessment Section, p. 144.
Vaughan, D.E., 1988. Clam culture: state of the art in Florida, USA. J. Shellfish Res. 7, 546.