Process control and artificial intelligence
software for aquaculture
Phillip G. Lee
a,b,*
aMarine Biomedical Institute,Uni
6ersity of Texas Medical Branch,Gal6eston,TX77555-1163, USA bAquatic Feeds and Filters,Inc.,PO Box 3131,Gal
6eston,TX 77552, USA
Received 15 August 1999; accepted 17 February 2000
Abstract
Modern research and commercial aquaculture operations have begun to adopt new technologies, including computer control systems. Aquaculturists realize that by controlling the environmental conditions and system inputs (e.g. water, oxygen, temperature, feed rate and stocking density), physiological rates of cultured species and final process outputs (e.g. ammonia, pH and growth) can be regulated. These are exactly the kinds of practical measurements that will allow commercial aquaculture facilities to optimize their efficiency by reducing labor and utility costs. Anticipated benefits for aquaculture process control and artificial intelligence systems are: (1) increased process efficiency; (2) reduced energy and water losses; (3) reduced labor costs; (4) reduced stress and disease; (5) improved accounting; and (6) improved understanding of the process. This review explores the technologies and implementation of the technologies necessary for the development of computer intelligent management systems for enhanced commercial aquaculture production. Today’s artificial intelligence (AI) systems (i.e. expert systems and neural networks) offer the aquaculturist a proven methodology for implementing management systems that are both intuitive and inferential. There have been many successful commercial applications of AI (e.g. expert systems in cameras and automobiles). The major factors to consider in the design and purchase of process control and artificial intelligence software are functionality/intuitiveness, compatibility, flexibility, upgrade path, hardware requirements and cost. Of these, intuitive-ness and compatibility are the most important. The software must be intuitive to the user or they will not use the system. Regarding compatibility, the manufacturer should be congruent with open architecture designs so that the chosen software is interchangeable with other software products. © 2000 Elsevier Science B.V. All rights reserved.
www.elsevier.nl/locate/aqua-online
* Tel.:+1-409-7722133; fax: +1-409-7726993. E-mail address:[email protected] (P.G. Lee)
Keywords: Automation; Process control; Artificial intelligence; Expert system; Fuzzy logic; Neural network
1. Introduction
The field of aquaculture has been considered by many of its practitioners to be as much of an art as a science; success of aquaculture operations has been closely associated with the intuition of the farm manager rather than with under-standing of the physiology, ecology and behavior of the cultured species. Hence, farm managers have been hesitant to trust their crops to automated management systems. However, recent research and commercial operations have begun to adopt new technologies and aquaculture as a science is evolving (Lee, 1995; Malone and DeLosReyes, 1997). Real-time trending of system parameters pro-vides the manager with unprecedented insights into the physical and biological conditions of the aquaculture facility. These insights would be impossible with manually monitored aquaculture systems because of the labor required to collect and enter data and then to prepare graphs and reports. Recirculating aquacul-ture systems have the most obvious needs for this technology but pond and offshore aquaculture systems can benefit as well.
2. Advantages and benefits of process control systems
The purpose for applying process control technology to aquaculture in devel-oped countries encompasses many socioeconomic factors, including variable cli-mate, high labor costs, increased competition for dwindling water and land resources and an unsympathetic regulatory bureaucracy. These factors are push-ing the US and other developed nations toward the use of intensive, recirculat-ing, water filtration systems and off-shore pens and cages (Fridley, 1993; McCoy, 1993; Lee, 1995; Hayden, 1997; Helsley, 1997). High efficiency, automated con-trol systems should (1) reduce simultaneously the need for high quality make-up water and the volume of pollutant-laden effluent for land-based recirculating systems, and (2) reduce labor costs for on-site supervision and normal feed wastage associated with off-shore aquaculture (Lee, 1995). Anticipated benefits for aquaculture process control systems are: (1) increased process efficiency; (2) reduced energy and water losses; (3) reduced labor costs; (4) reduced stress and disease; (5) improved accounting; and (6) improved understanding of the process.
management (Lee, 1991, 1993; Lee et al., 1995, 1999; Turk et al., 1997). This migration toward intensification and automation parallels the development of other forms of agriculture, such as, automated broiler coops (Campbell, 1988; Allison et al., 1991), nursery greenhouses (Bakker et al., 1988; Hooper, 1988; Jones et al., 1990), dairy barns and feedlots (Leonard and McQuitty, 1982; Mottram and Street 1991) and crop irrigation systems (Rao et al., 1992). These intensive agricultural production systems share many characteristics with intensive aquaculture systems and all are commodity markets (i.e. high production and low profit margins). Process control technology is big business; control system integration revenues were expected to reach US$10 billion in 1998 and the industry has been growing at a rate of \15%/year over the last 5 years (Kuhfeld, 1994).
The application of process control technology to aquaculture systems will allow the aquaculture industry to: (1) site production closer to markets; (2) improve environmental control; (3) reduce catastrophic losses; (4) avoid problems with environmental regulations; (5) reduce management and labor costs; and (6) improve product quality and consistency (Lee, 1995). The overall design and implementation (i.e. hardware and software) of aquaculture process control systems has been reviewed (Lee, 1991, 1995). These reviews included both custom-designed (i.e. user-designed) and commercially available systems. Custom-designed systems are usually designed and constructed by one individual who is technically competent with computer hardware and software; these custom systems often require thou-sands of lines of computer code to be written. This is unnecessary today because there are many cost-effective process control software programs and compatible hardware available on the market. Therefore, this review focuses specifically on the characteristics and capabilities of commercial process control and artificial intelli-gence software.
3. Process control software characteristics
3.1.Operating systems
The choices of computer platform and operating systems are the first choices to be made in selecting a process control system (Wolske, 1989; Chandler, 1994; Labs, 1994). The most appropriate criteria to use for selection are: (1) functionality or suitability to task; (2) compatibility and interconnectivity; (3) architectural expand-ability; and (4) price performance. There are essentially four operating systems used by process control integrators today, AT&T’s UNIX®, IBM’s OS/2®, DEC’s VMS®
3.2.System architecture
There are four basic designs for automated control systems used in aquaculture (Lee, 1995): (1) closed loop controller or data logger systems (Losordo et al., 1988; Madenjian et al., 1988; Green and Teichert-Coddington, 1991; Ebeling, 1991; Lyon et al., 1993); (2) programmable logic controller (PLC) systems (Padala and Zilber, 1991; Ebeling, 1993; Widmyer and Widmyer, 1993); (3) microcomputer-based supervisory control and data acquisition (SCADA) systems (Hoy, 1985; Ruohonen, 1987; Lee, 1991, 1993; Rusch and Malone, 1991, 1993; Whitson et al., 1993); and (4) distributed control systems (DCS) (Hansen, 1987; Lee et al., 1995). Each design has its advantages and limitations.
A SCADA system costs significantly less than a DCS but it sacrifices redundancy needed for some critical functions (e.g. oxygen control) (Yingst, 1988). Hence, a SCADA system may be adequate for small aquaculture facilities or it may be a logical starting point for the installation of a control system in a large facility. However, larger facilities will require a DCS due to their more complex control problems, requiring that multiple intelligent devices (i.e. multiplexers, PLCs or PCs) be integrated for a higher level of control (Grenier, 1994). While DCSs were expensive in the past, the use of personal computers has reduced these costs, improved the compatibility and simplified the operation of the DCS dramatically (Lee, 1995). In recent years, distinctions between PLC, SCADA and DCS systems are becoming less clear with the establishment of open architectures and improved compatibility (Spennato and Noblett, 1992). All of these designs require compatible software to integrate their function; choice of industry standard, open architecture components will speed implementation and reduce costs.
3.3.Modules
A typical process control software application is composed of various modules (sub-routines) that perform the needed tasks (Intellution, 1994). These modules include communications, database management, graphical interface and control algorithm functions. The first four modules discussed below are the basic building blocks for a process control system (i.e. I/O drivers; database builder, scan, alarm and control; and man-machine interface) while the others that are discussed below are enhancements. The figures (Figs. 1 – 4) used to illustrate the following software modules are actual screens used in the set-up and operation of a computer automated denitrifying biofilter (bioreactor) (Whitson et al., 1993; Lee et al., 1995; Turk et al., 1997; Lea et al., 1998).
3.3.1. I/O dri6ers
PLCs. For each specific I/O device there is a specific I/O driver that should provide capabilities for automatic communication error detection, reporting and recovery, and support for redundant communications. The most common of these devices are data multiplexers which are usually non-intelligent signal conditioners (e.g. convert digital and analog voltages into 8-bit digital data) and PLCs which are intelligent and capable of control functions. Finally, the I/O driver is used to build and update the Driver Image Table, DIT (i.e. poll table) that can be thought of as a collection of transient mailboxes (registers) containing a single data point or range of data points.
3.3.2. Process database builder
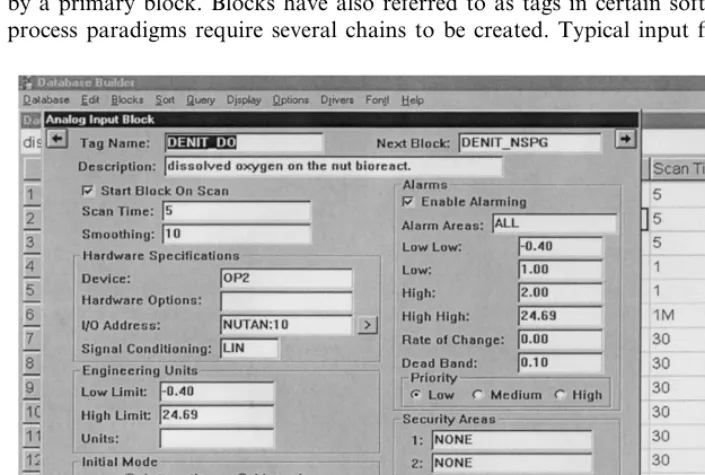
The heart of the process control software is the process database, a representa-tion of the process created using process control logic. The process database consists of blocks (i.e. coded set of process instructions that perform a specific task) and chains (i.e. series of connected blocks that create a monitoring or control loop) (Fig. 1). There are two general types of blocks; primary blocks that read data from or write data to the DIT and secondary blocks that manipulate data passed to them by a primary block. Blocks have also referred to as tags in certain software. Most process paradigms require several chains to be created. Typical input fields for an
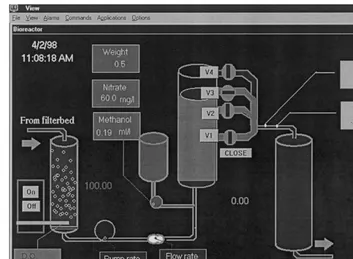
Fig. 2. The view screen for an automated denitrifying bioreactor (Lee et al., 1995), using the man-machine interface (MMI) of the process control software. Note the data windows, interactive buttons for valves, on/off buttons and animation of bubbles. For more details, see the text.
input block include the tag name, description, scan time, PO address, signal conditioning, engineering units and calibration range, alarm set points, security, and links to the next block in the chain.
Fig. 1 shows an example of a primary block that is the initial block in a chain used to control the dissolved oxygen concentration in an influent sparge column for a denitrifying bioreactor (see Fig. 2). In this example, the oxygen sensor is present at channel 10 of the NUTAN (i.e. nutrition tank system) multiplexer; the dissolved oxygen is monitored ((DENIT-DO) every 5 s. A value above the high set point value (2.00 ppm) causes a relay to open a valve to a nitrogen source (the next block; DENIT-NSPG), causing nitrogen to strip oxygen from the influent stream and keeping dissolved oxygen in the anaerobic filter below 2.0 ppm.
3.3.3. Man-machine interface (MMI)
subsystems. The first is the graphics application composed of a draw or paint program (graphics formatting for display screens) and a view program (real-time display of system function). Modern graphics applications are based on graphic user interfaces (GUI) that allow a user to personalize the display using a variety of tools including object-oriented programming technologies. The second sub-system is a Links program that accesses information in the database and passes this information between various displays and databases. These links can write informa-tion into databases and control display animainforma-tion.
The MMI is the component of a process control system that most process managers use routinely because it allows the manager to acquire needed trending information and to interact with the process (Fig. 2). This display represents a real-time view of process function for a denitrifying bioreactor. The oxygen sparge column (on the left of screen) has a dissolved oxygen (DO) reading above 2.0 ppm (the set point) so that nitrogen stripping bubbles are animated in the column. The pump rate is set for 100 l/h and the actual flow is 101.1 l/h maintained by a PID (proportional integral derivative) controller function. The bacterial column (center of screen) is set for a water depth equal to valve three (v3). The effluent has a pH of 8.06 and oxidation – reduction potential (ORP) of −365.5 mV.
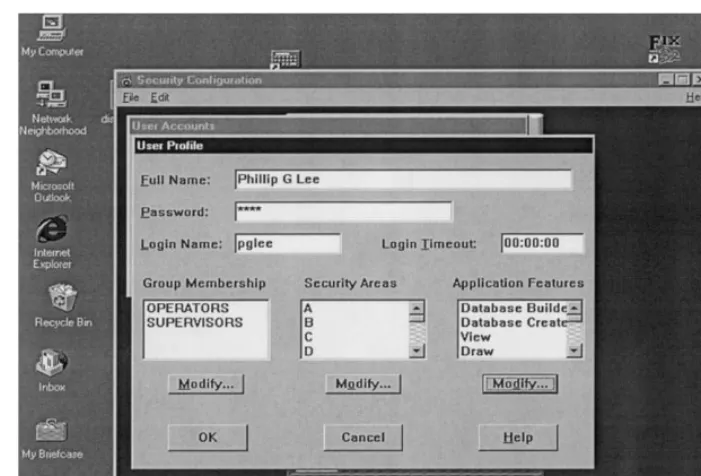
Fig. 4. Input screen for the security authorization of a user. Screen includes authorization areas and password protection. For more details, see the text.
Remember that you are using a personal computer, so have the software application personalized to meet you specific requirements. Some people prefer complex graphic schematics of their aquaculture system, some prefer buttons and dials, others prefer animated displays, while others just want spreadsheets of data available. The process control software should make all of these options available. Just as each manager has a preference for the display of data, they also have preferences for the use of pointing devices and/or keyboarding; the system should allow for many different input options. Future improvements in voice activation and virtual reality will improve our abilities as managers to interact with a process.
3.3.4. Scan, alarm and control program
3.3.5. Historical trending
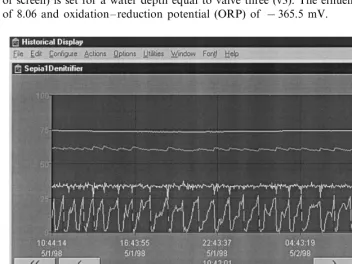
Historical trending is used to analyze process trends, archive process data, monitor efficiency of process, and analyze post-process data. The historical assign, collect and display programs allow the manager to sample real-time data from the DIT at user selected rates and then to store to disk and/or display as process displays. These three programs collectively might be thought of as the control system’s memory, short-term and long-term. The historical assign program defines your collection strategy, allowing you to identify data that you want to collect (i.e. place in a database). The historical collect program collects data that is stored in disk files; the historical display program is used to display data in user-defined trend charts (Fig. 3). This display contains trend curves for ORP, DO, water flow, pump output rate, methanol input rate and sparge valve status plotted versus time in hours. This information is both displayed and stored to disk such that an operator can access data for the current day or any previous day.
3.3.6. Recipe builder
This module allows the manager to design, implement and run recipes for a process (i.e. batch processes that have standard but repetitive steps which can be programmed). It also provides a flexible method for keeping an audit trail; this is particularly useful if the process requires the operator to change many process database values frequently. Examples of aquaculture applications would be batch processes such as algae or micro-invertebrate culture. The manager would first create a master recipe using the database builder and tag names. This master recipe would embody the expertise of the algae culturist. For each particular batch of required algae, it might need to be modified somewhat based on batch size and species so that a control recipe would be formulated from the original master recipe. The same master recipe would then be used over and over again to formulate control recipes without human error or juxtaposition of steps.
3.3.7. Tag group editor
This module simplifies recipe and display management by providing a means for accessing similar database information at different times using a single picture or symbol. For example, a large aquaculture facility is generally composed of many similar tank systems in which only some variables may vary (e.g. feeding rate and temperature). It would be unnecessarily repetitious to use the database builder to configure every individual tank system. The tag group editor allows you to reduce development time by defining one display and/or one control logic chain for all the similar groups of tag names (i.e. tanks).
3.3.8. DDE ser6er
One of the key attributes of the Windows®
receives data) to other application software opens up many possibilities for control paradigms and report generation. The manager can take advantage of sub-routines available in other software that are not available in the purchased process control software. This is the most common method used to interface report generation, phone dialer and artificial intelligence software with the process control software. In order for DDE to work, your computer’s software must have both a NetDDE®
server and client mode (these are provided in Microsoft’s Windows for Work-groups™ and higher operating systems or may come as part of the process control software).
3.3.9. Relational databases interface
This interface module lets the manager collect and write real-time data from the process database to an external relational database (e.g. Access®
, dBase®
and Oracle®
). These relational databases must conform to industry standards for open database connectivity (ODBC) and sort, query and logic (SQL). This interface also allows you to read data stored in relational databases and write it back to a process database. No modern process control system can be considered complete without this capability since it addresses both open architecture and compatibility. This database interface is essential for future compatibility with evolving process control software products (e.g. statistical process control and artificial intelligence systems).
3.3.10.Report generator
The report generator is used to collect essential or critical data into a report for use by the manager or other users to make decisions on the process efficiency. Report generation can be internal to the process control software or require a NetDDE®
link so that any DDE compatible application (e.g. Excel®
or Lotus®
) can be used to prepare reports. Either method can be automated such that reports are printed or displayed on a video monitor with a fixed schedule. The report generator should be able to access real-time process data, historical process databases and alarm and message files. Examples of useful reports would be weekly production statistics, feed efficiency projections, weekly or daily water quality records and materials management.
3.3.11.Security
to application features. In this case, pglee has access to all security areas and applications. In practice, a technical employee might be able to access all monitor displays of the facility and acknowledge alarms for their area of responsibility but they could not make any changes to database blocks. A financial officer might only be able to access security areas dealing with materials flow and utilities while the project manager would have access to all areas, including database blocks.
3.3.12.Alarm and messaging
Process control software should have capabilities for generating, displaying and storing a variety of alarms and messages. You should be able to route these alarms or messages to any computer linked to the system (i.e. node), printers, disk-based files, alarm summary displays, message boards and phone dialers. The alarms or messages usually require an acknowledgment from the operator before they can be turned off.
There are several general types of alarms and messages included in process control software. The most common is a database block alarm in which a database block generates an alarm when input values fall outside the upper or lower set point, a change in state occurs or when communications fail. These alarms are displayed in an alarm manager display and can be routed to audible bells, message boards and/or phone dialers; they usually require acknowledgment from the user. The second is a block message that usually goes to a printer or alarm history file to document an event at that block. The third is a operator message that makes a historical record of important operator actions in the alarm history file. The fourth is a system message that generates messages associated with errors in the software. The fifth is an application message that documents activity in another software module (e.g. recipe builder and historical collect). Both system and application messages are stored in the alarm history file so that records of the problems can be reviewed by your software vendor. All of these alarms or messages are to be used to troubleshoot problems with the actual process or problems with the control system components.
3.3.13.Remote dialer
3.3.14.Statistical control
The theory of statistical process control (SPC) is based on the assumption that a process will remain stable (i.e. within statistical limits) unless an unexpected event occurs. The role of the SPC software is to resolve an event from background process noise as soon as possible, correct the process back to its stable range and identify the cause for the instability (Dybeck, 1989). There are two types of events that cause a departure from the expected, random events and assignable events. A SPC module enables the user to use statistical analyses to trend the process (i.e. control chart), setting the upper and lower control limits (usually 93 SD) of the process based on any combination of input and output blocks. When the output falls within the control limits, the variability is probably due to random events. When the output falls outside of the control limits, the variability can probably be assigned to specific events. In an industrial setting it is at this point that a production line is shutdown, the problem is identified and the control logic is corrected. This is more difficult to do in a continuous process like a fish production tank since you can not simply shutdown the process. As such, additional limits may be set to trigger alarms so that the manager can begin monitoring the control chart before the process goes out-of-limits. These modules provide not only a variety of statistical analysis presentation graphics but can include control features (Wolske, 1989).
3.3.15.Simulation de6elopment
Process simulation can be used to replicate or model an existing or proposed process. It is most useful for evaluating the function of a control paradigm before implementation but can be used to fine tune or to train personnel in the operation of an existing process control system (Dowling and Sullivan, 1993). The simulation software should (1) operate on the same hardware and in the same operating system as the control system software, (2) allow development to be interactive, (3) have predefined algorithms as well as user-defined algorithms for process functions, and (4) allow implementation with minimal changes to process control system software. Interactive modeling in real-time is the key advantage of such systems (Lee, 1991); estimates of the time saved in implementing a new process control paradigm suggest that development time can be cut dramatically, using simulation software (Nisen-feld, 1989).
3.4.Basic set-up and operation
tag group editor, recipe builder, macro editor, historical collect and assign, DDE server and report generator) to customize the software to meet the manager’s requirements. Finally, the manager will define the security areas in the system and assign security levels to all employees who will be using the system.
4. Artificial intelligence (AI) software characteristics
The use of artificial intelligence (AI) has become more common in industrial and manufacturing process control systems in recent years (Bechtold, 1993, 1994; Gilles, 1995; Hirota, 1995; Takahashi, 1995). In the past, AI software was very expensive and had greatly varying functionality. The advantages of AI systems include: (1) the rapid transfer of expert knowledge throughout an industry, especially those young industries that do not have enough available experts; (2) a reduction in labor costs due to automation of all primary functions; (3) improved process stability and efficiency; and (4) improved understanding of the process through the development and testing of the rules. Their usefulness in aquaculture has been advocated due to all of these reasons (Palmer, 1989; Lee, 1993, 1995). Modern AI systems can be divided into three main classes, knowledge-based expert systems, fuzzy logic-based expert systems and neural networks (Rock and Guerin, 1992; Bechtold, 1993; Studt, 1994); each class has its best application.
4.1.Knowledge-based expert system
Knowledge-based expert systems are computer programs that mimic the actions of acknowledged process experts (Bechtold, 1993, 1994). They require defined rules
Table 1
Example rules from a knowledge-based expert system (A) and a fuzzy-logic based expert system (B)
(A) Example rules for a knowledge-based expert system used to monitor water flow in a recirculating system (Padala and Zilber, 1991)
Rule 1 IF NO FILTER PUMP FLOW IS PRESENT AND FILTER PUMP IS ACTIVATED AND FILTER PUMP PRESSURE IS PRESENT THEN FILTER PUMP FLOW SWITCH FAILURE
IF FILTER PUMP FLOW SWITCH FAILURE THEN ACTIVATE ALARM Rule 2
(B) Example rules for a fuzzy logic-based expert system used to control the residence time in an automated denitrifying bioreactora
Rule 1 IF (ORP IS Nom) and (DORP IS Z) THENDPumpRate IS Z IF (ORP IS NL) AND (DORP IS P) THENDPumpRate IS Z Rule 2
IF (ORP IS NL) AND (Residence Time IS H) AND (DORP IS NOT P) THEND
Rule 3
PumpRate IS P
IF (ORP IS H) AND (Residence Time IS L) AND (DORP IS NOT N) THEND
Rule 4
PumpRate IS N
aThe abbreviations Nom, H, L, Z, P, N and NL represent the fuzzy sets nominal, high, low, zero,
(IF and THEN statements) or graphical knowledge (flow charts or logic trees) to be formulated by process experts (Table 1). This necessitates the rather tedious task of recording a process expert’s knowledge into the form of rules and then validating the expert system against the expert’s decisions. Generally, experienced process experts find this process antagonistic, especially when they contradict the outcomes of their earlier rules. The process requires a patient expert and an even more patient computer programmer to refine or change rules. The most significant consequence of a knowledge-based expert system is that it gives a process expert the ability to quickly distribute their intelligence throughout an organization or entire industry. Knowledge-based expert systems do have the advantage of having an explanation facility where the user can find out why a decision was made by referencing the rules used. This makes them useful for training new managers or educating novices. It is the most tedious of the AI classes to use because of the repeated need to validate the rule-base. Table 1A provides an example of two rules that when combined signal a failure in a flow switch. Rule requires three conditions to be met (all or nothing conditions) and Rule 2 activates the alarm. One can easily see the logic and use these rules to understand the control decisions made by the rule base.
4.2.Fuzzy logic-based expert system
Fuzzy logic systems do not require defined rules or knowledge but use fuzzy rule-bases that emulate human intuition rather the absolute knowledge of experi-enced process experts (Czogala and Rawlik, 1989; Karr, 1993). They operate similar to a knowledge-based expert system because they do require written rules (IF and THEN) and hence an expert. However, these rules are fuzzy rules (Table 1B) and not simply yes or no rules; each rule has a membership function. Fuzzy logic-based control systems seem the most appropriate system for aquaculture because fuzzy systems process information involving uncertainty, ambiguity and contradiction better.
A fuzzy set differs from classical set theory in which set membership is discrete (either ‘member’=0 or ‘nonmember’=1) in that fuzzy set membership is identified in a continuum between 0 and 1. In other words, an object with a strong relationship will have a numerical value $1 while one with a weak relationship will have a value $0. The simplest example is human age. A 10-year-old is young but an 8-day-old baby is younger. In other words, the baby has a stronger membership (:1) in the class young than the 10-year-old (:0.9) whereas a 90-year-old person has a very, very low membership in young (:0.1 but not 0). As a result in a fuzzy logic system, the process inputs are ascribed memberships in appropriate rules (usually many rules) and these memberships are summed and then actions (process outputs) are taken (defuzzification). Based on the membership values, these actions can be equally fuzzy.
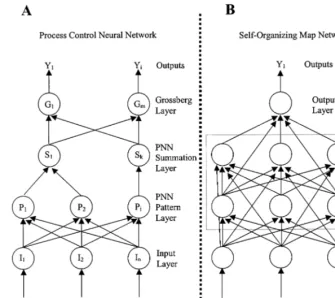
outper-Fig. 5. Several modern neural networks (A) a process control neural network (PCNN), and (B) a self organizing map (SOM) network. For more details, see the text.
form classical knowledge based systems because of their ability to deal with continuous changes and to generate small or large control actions relative to the degree of exhibited deviation from the desired state. Table 1B lists several fuzzy rules used to control residence time in a denitrifying bioreactor, using the pump rate of the main water pump. Rules 1 and 2 define conditions where the pump rate would not be changed whereas Rules 3 and 4 define conditions where the pump rate would be increased or decreased, respectively.
4.3.Neural network
new site or newly cultured species; the fact that most aquaculture projects are site specific also means that neural network systems will be trained with relatively incomplete data. However, neural nets do provide a means for the automation of poorly understood processes for which little knowledge exists — a condition that occurs all to often in aquaculture operations.
Several types of modern neural networks are shown in Fig. 5A and Fig. 5B. The Process Control Neural Network (PCNN) was designed specifically for use by the process control industry and represents a net based on probabilities similar to statistical process control techniques discussed above. Hence, you can train a neural net to identify the process conditions that may lead to each out-of-control situation (Plummer, 1993). The unique features of the PCNN are the PNN Pattern Layer and the Grossberg Layer (Fig. 5A). The PNN Pattern Layer contains a vector of values, corresponding to an input variable typical of the category it represents. The proximity of each input vector to each pattern is then calculated and the output is analyzed in the subsequent Summation Layer. As a result, some categories will drop out of the analysis and clusters will be formed. Finally, the Grossberg Layer functions as a look-up table since each node in this layer represents a potential cause for every known out-of-control situation (e.g. temperature instability and water quality) (Plummer, 1993). This layer must be trained using supervised learning, requiring each potential cause for instability to be accurately identified in the training database.
The second type of neural network shown in Fig. 5B is a self-organizing map (SOM). The SOM has a multi-dimensional network structure that can, from a random starting point, find the natural relationships among patterns with no external training (Hiotis, 1993). The SOM identifies trends and adapts according to the function of the network. It improves on typical ‘backpropagation’ techniques in that the SOM Layer is fully connected to both the input and output layers instead of containing multiple independent hidden layers as in backpropagation nets. The objective of the SOM is to compress information input from a multi-dimensional array into a two-dimensional space, forming reduced representations of the most relevant facts, without loss of knowledge about their relationships (Hiotis, 1993). The SOM also has the advantage that it offers a graphical representation of the results instead of the usual ‘blackbox’ results of neural networks (Hiotis, 1993).
4.4.Hybrid systems
programming object allows for rapid decision-making. This type of system improves on neural networks alone in that the DMUs are not simple ‘blackboxes’ as are the neurons in a neural network and the FIS allows the user to understand the internal state of the system. Finally, the rules that make up the FIS can be modified by a process expert, improving accuracy.
4.5.Aquaculture AI systems
Expert systems (Padala and Zilber, 1991), fuzzy logic controllers (Turk et al., 1997; Lea et al., 1998) and a hybrid neural fuzzy system (Whitsell et al., 1997) have been used to automate aquaculture environmental control, water filtration and computer vision systems, respectively. Padala and Zilber (1991) designed a recirculating intensive aquaculture expert (RIAX) to manage an intensive Tilapia (Tilapia mozambique) culture system. The RIAX was a rule-based expert system designed to optimize efficiency and production by monitoring and controlling feeding, temperature, water quality, flow, oxygen and water level (Table 1A). The system was composed of sensors, meters, and actuators (e.g. valves and pumps) connected to a PLC with video monitor and uninterruptible power supply. The expert system was composed of four knowledge bases, the startup knowledge base, the run time knowledge base the operator-assisted maintenance knowledge base and the equipment diagnostic knowl-edge base. This demonstrates the type of knowlknowl-edge bases that are useful to aquaculturists. The RIAX allowed the biomass in the system to be doubled (from 40 to 80 fish in a 387 l system) while maintaining acceptable water quality.
A fuzzy logic-based expert system was used to develop an automated denitrifying bioreactor for the removal of nitrate from aquaculture systems (Lee et al., 1995, 1999; Turk et al., 1997; Lea et al., 1998). The operation of the bioreactor (Fig. 2) required the careful control of flow rate (Table 1B) and carbon feed to avoid the production of toxic substances, nitrite and hydrogen sulfide. Manually operated denitrification systems have a history of crashing due to human operator error; the automated bioreactor has the advantage that its operation was monitored 24 h a day by the computer control system. The fuzzy logic-based expert system was validated by direct comparison with the decisions that human experts would have made under similar situations (Whitson et al., 1993; Lee et al., 1999). Fuzzy logic control systems have an advantage over routine set point process control systems because they generate changes in proportion to the degree to which the process deviates from the control range (Table 1B, Lee et al., 1999).
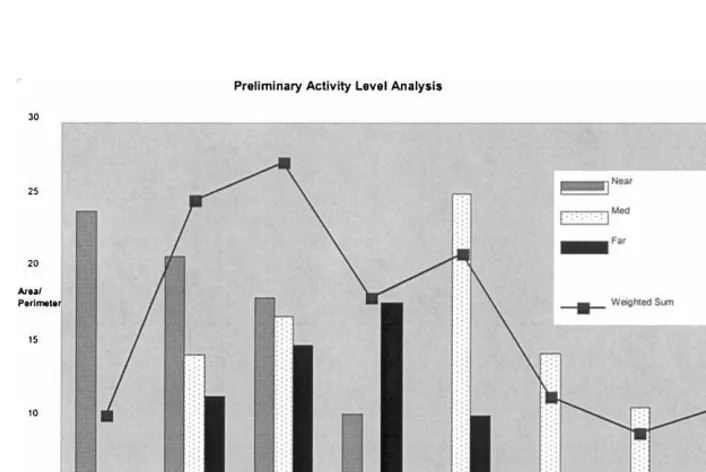
regression of activity versus time (Fig. 6); this figure is an example of a report generated using the NetDDE module in the process control software. The main innovation associated with this machine vision system was the use of a training data set based on expert knowledge. The authors found that the expert-modified ANFIS system gave the best performance when compared to earlier systems (Whitsell and Lee, 1994; Whitsell et al., 1997).
In summary, the use of fuzzy control logic appears to offer the best potential to aquaculture because its execution most closely mimics the routine management decisions made by an aquaculturist who is part scientist and artist.
5. Software purchase criteria
The selection of software, whether it is general process control or artificial intelligence software, almost always comes down to some combination of perceived price performance and trust in the developer.
5.1.Functionality/intuiti6eness
You should evaluate whether the potential software can accomplish the bottom line goals that you have set for your automated control system. These should be production or economic goals not engineering goals because the price performance of the software system should bolster your financial plan not blow a hole in it. In addition to meeting your goals, the software should not require an excessive time for the manager and staff to learn. It may require some higher level computer skills to install and set-up, but the day-to-day use should be intuitive in the sense that a user should be able to navigate through the screen displays and find the informa-tion that they need. The most effective way to evaluate the funcinforma-tionality of the product is to acquire a demonstration copy from the vendor and see if it can perform the required functions. You should verify all control functions, displays, alarms and messages, security procedures, DDE links and mathematical algorithms with valid and invalid data inputs before purchasing (Walters, 1994). Evidence of good documentation in manuals is another sign that the software will be functional and that any problems will be easy to solve. Other good methods to access functionality is to: (1) determine the extent to which the product is used in your industry; (2) discuss its functionality with current users; and (3) evaluate the vendor’s experience in solving the kinds of problems that will be critical for your control system. Finally, you should evaluate the disaster recovery procedures, including backups and recovery.
5.2.Modularity/flexibility
Modularity provides the benefit that system components can be added, moved or deleted as necessary without jeopardizing the integrity of the whole control system (Wolske, 1989; Walters, 1994). This is important for both the software and the hardware. The benefits for modularity in software are that you will not have to buy unnecessary features and that you can upgrade features later. With hardware, the selection of modular communication devices, transmitters, meters, sensors and actuators means that a system can be implemented quickly and modified without major time delays. Modular design also means that once one aquaculture tank monitoring and control system is designed and implemented in your facility, it is easily replicated for all other tank systems.
5.3.Compatibility
using software that contains most of today’s enhancements (e.g. direct dynamic exchange, DDE; object linking and embedding, OLE; shared libraries or dynamic link libraries, DLL; object-oriented programming, OOP; wizards and multimedia systems). If the software is a proprietary product designed for only one type of hardware, you will undoubtedly encounter a problem with interfacing a second party sensor or actuator. Selection of compatible software will ensure that if and when you implement new enhancements (e.g. statistical process control, remote nodes or artificial intelligence) you will be able to do so without buying a completely new system (Wolske, 1989).
5.4.Upgrade path/ser6ice
This is one of the most critical aspects for evaluating a software program, yet it is the hardest to predict because its effects will be felt at some point in the future. One of the salient characteristics of computer technology is that nothing will remain static for very long. In practical terms, this means that the process control software will continue to improve and it will be more and more demanding on system resources, requiring software and hardware upgrades (Labs, 1992). The best recent example of this has been the migration of PC users from Microsoft’s DOS™ to Windows™ to Windows for Workgroups™ to Windows 95 or 98™ to Windows NT™. Each step required new software (both applications as well as operating system) and improved hardware (more memory, larger disk drives, faster CD-ROMs and better graphics cards). Each user has to judge the price performance benefits of each potential upgrade step (Huber, 1994). This can best be evaluated by asking the vendor specific questions concerning the past upgrade history and pricing policy as well as questions concerning planned improvements to the software. There are three things that you should consider: (1) you do not have to upgrade, it’s your decision; (2) if you buy from stable vendors, your applications will work well with whichever operating system it is designed to use; and (3) your process control system will become so valuable to you that you will be seeking to improve its productivity constantly (Whitson et al., 1997). When you finally select the product, remember that the vendor is becoming a partner in your business so select a vendor that is committed to your success (Walters, 1994).
5.5.Hardware requirements
5.6.Price performance
Finally, all the above criteria must be balanced against the cost of purchase for the software. This decision should be made based on a ‘Top Down’ approach, meaning that the selected system must meet your economic goals not just make the process easier to manage (Christie, 1989; Lee, 1995). While the latter may be important to your employees, the real business reason for considering a process control system is to increase production, reduce labor and material costs and/or reduce waste.
Acknowledgements
This research was supported by grants from the Texas A&M University Sea Grant Program (R/M-58), National Sea Grant College Program (R/M-53), the Small Business Innovative Research Program of the Department of Commerce and The Texas Higher Education Coordinating Board’s Advanced Technology (004952-068) and Technology Development and Transfer (004952-079) programs and an educational partnership with Intellution, Inc., Norwood, MA as well as the Marine Medicine budget of the Marine Biomedical Institute, University of Texas Medical Branch.
References
Allison, J.M., White, J.M., Worley, L.W., Kay, F.W., 1991. Algorithms for microcomputer control of the environment of a production broiler house. Trans. Am. Soc. Agric. Eng. 34, 313 – 320. Bakker, L., Arendzen, A.J., Spaans, L., 1988. A distributed system for glasshouse climate control, data
acquisition and analysis. Comput. Electron. Agric. 3, 1 – 10.
Bechtold, W.R., 1993. A practical guide to expert systems: part a. Instrum. Control Syst. 66 (12), 41 – 43. Bechtold, W.R., 1994. A practical guide to expert systems: part b. Instrum. Control Syst. 67 (2), 75 – 78. Campbell, A.M., 1988. Understanding and selecting a computerized control system. Poultry Digest
April, 160 – 163.
Chandler, M., 1994. Choosing a high-performance operating system. Instrum. Control Syst. 67 (3), 49 – 52.
Chester, D., 1992. New trends in neural nets. Sci. Comput. Autom. 8 (6), 43 – 48.
Christie, D.A., 1989. The top-down approach to successful process control projects. Control 2 (9), 22 – 28.
Cleaveland, P., 1993. Operator interfaces reap benefits of advanced technology. Instrum. Control Syst. 66 (5), 29 – 38.
Czogala, E., Rawlik, T., 1989. Modeling of a fuzzy controller with application to the control of biological processes. Fuzzy Sets Systems 31, 13 – 22.
Dowling, R., Sullivan, M.O., 1993. The ‘Hows’ and ‘Whys’ of PC-based process simulation. Instrum. Control Syst. 66 (6), 59 – 63.
Dybeck, M., 1989. Keeping a process on target: practical methods and algorithms. Control 11 (9), 40 – 49.
Ebeling, J.M., 1993. Engineering experiences during the design and construction of an aquaculture research and demonstration center at Ohio State University. In: Wang, J.K. (Ed.), Techniques for Modern Aquaculture. American Society of Agricultural Engineers, St. Joseph, MI, pp. 204 – 210. Fridley, R.B., 1993. Constraints to marine aquaculture: what role can engineering and technology play? In: Wang, J.K. (Ed.), Techniques for Modern Aquaculture. American Society of Agricultural Engineers, St. Joseph, MI, pp. 1 – 7.
Gilles, G., 1995. Expert systems: finally ready for an industrial workout. Instrum. Control Syst. 68 (5), 57 – 60.
Grenier, D., 1994. DCSs up product consistency, quality output. Instrum. Control Syst. 67 (9), 51 – 58. Green, BM, Teichert-Coddington, D.R., 1991. Comparison of two samplers used in automated data
acquisition system in whole-pond metabolism studies. Progress. Fish Cult. 53, 236 – 242.
Hansen, E., 1987. Computer-aided control and monitoring of aquaculture plants. In: Balchen, L.G. (Ed.), Automation and Data Processing in Aquaculture. Pergamon Press, Oxford, pp. 187 – 192. Hayden, A., 1997. Current and potential regulation of open ocean aquaculture. In: Helsley, C.E. (Ed.),
Open Ocean Aquaculture ‘97, Charting the Future of Ocean Farming. Proceedings of the Interna-tional Conference,cCP-98-08. University of Hawaii Sea Grant College Program, Honolulu, HI, pp. 57 – 64.
Helsley, C., 1997. Open ocean aquaculture conference summary, commentary and thoughts for the future. In: Helsley, C.E. (Ed.), Open Ocean Aquaculture ‘97, Charting the Future of Ocean Farming. Proceedings of the International Conference, cCP-98-08. University of Hawaii Sea Grant College Program, Honolulu, HI, pp. 3 – 14.
Hiotis, A., 1993. Inside a self-organizing map. AI Expert 8 (4), 38 – 42.
Hirota, K., 1995. History of industrial applications of fuzzy logic in Japan. In: Yen, J., Langari, R., Zadeh, L. (Eds.), Industrial Applications of Fuzzy Logic and Intelligent Systems. IEEE Press, pp. 41 – 54.
Hooper, A.M., 1988. Computer control of the environment in greenhouses. Comput. Electron. Agric. 3, 11 – 28.
Hoy, L.B., 1985. A microcomputer-based system for feed control, temperature control and temperature recording in an experimental fish hatchery. Comput. Electron. Agric. 1, 105 – 110.
Huber, P., 1994. New versions of Windows allow flexible performance upgrades. Instrum. Control Syst. 67 (9), 71 – 78.
Intellution, 1994. System Setup. Intellution, Norwood, MA.
Jang, J.Sr., 1993. ANFIS-Adaptive network-based-fuzzy inference systems. MEE Trans. Syst. Man Cybern. 23 (3), 665 – 684.
Jang, J.S.R., Gulley, N., 1995. Fuzzy Logic Toolbox User’s Guide. The Math Works, Natick, MA. Jones, P., Jones, J.W., Hwang, Y., 1990. Simulation for determining greenhouse temperature setpoints.
Trans. Am. Soc. Agric. Eng. 33, 1722 – 1728.
Karr, C.L., 1993. Adaptive process control with fuzzy logic and genetic algorithms. Sci. Comput. Autom. 9 (10), 23 – 30.
Kuhfeld, R., 1994. Footnotes. Instrum. Control Syst. 67 (1l), 6.
Labs, W., 1992. Upgrades give software solutions longevity. Instrum. Control Syst. 65 (12), 53 – 57. Labs, W., 1993. PC software: getting on the GUI bandwagon. Instrum. Control Syst. 66 (4), 33 – 43. Labs, W., 1994. PC operating systems make the most of advanced hardware. Instrum. Control Syst. 67
(4), 45 – 48.
Lea, R., Dohman, E., Prebilsky, W., Lee, P., Turk, P., Ying, H., 1998. A fuzzy logic application to aquaculture environment control. In: Proceeding of the 17th North American Fuzzy Information Processing Society Conference, Pensacola, FL, August 20 – 21 pp. 29 – 33.
Lee, P.G., 1991. Automation of aquaculture systems: a review and practical guide to implementation. In: Proceedings of the Symposium on Engineering Aspects of Intensive Aquaculture. Northeast Re-gional Aquaculture Engineering Service, Ithaca, NY, pp. 284 – 300.
Lee, P.G., 1995. A review of automated control systems for aquaculture and design criteria for their implementation. Aquac. Eng. 14, 205 – 227.
Lee, P.G., Turk, P.E., Whitson, LL., 1995. Automated control of a closed, recirculating mariculture system with attached denitrification filter. In: Timmons, M. (Ed.), Aquacultural Engineering and Waste Management. Northeast Regional Aquaculture Engineering Service (NRAES) No. 100, Comell University, Ithaca, NY, pp. 23 – 39
Lee, P., Lea, R., Dohman, E., Prebilsky, W., Turk, P.E., Ying, H. Whitson, J.L., 2000. Denitrification in aquaculture systems: an example of a fuzzy logic control problem. Aquac. Eng. 23 (1 – 3), 37 – 59.
Leonard, J.J., McQuitty, L.B., 1982. A review of automation and automatic control applied to intensive animal production. Am. Soc. Agric. Eng. 82, 310.
Losordo, T.M., Piedrahita, R.H., Ebeling, L.M., 1988. An automated water quality data acquisition system for use in aquaculture ponds. Aquac. Eng. 7, 265 – 278.
Lyon, P.R., Arthurs, H.G., Hancock, D., Mullins, J., 1993. Data acquisition system for monitoring saturation levels of dissolved gases in fresh water aquaculture systems. In: Wang, L.K. II (Ed.), Techniques for Modern Aquaculture. American Society of Agricultural Engineers, St. Joseph, MI, pp. 81 – 88.
Madenjian, C.M., Rogers, G.L., Fast, A.W., 1988. Predicting night-time dissolved oxygen loss in aquaculture ponds. Can. J. Fish. Aquat. Sci. 45, 842 – 847.
Malone, R., DeLosReyes, Jr., A.A. 1997. Categories of recirculating aquaculture systems. In: Advances in Aquacultural Engineering. Northeast Regional Agricultural Engineering Service, Cornell, NY, NRAES-105, pp. 197 – 208.
McCoy, H.D., 1993. Open ocean fish farming: part one. Aquac. Mag. 19 (5), 66 – 74.
Mottram, T.T., Street, M.J., 1991. Design principles for automatic milking. Agric. Eng. 45, 39 – 42. Munasinghe, L., Gempesaw, C.M. II, Bacon, J.R., Lussier, W.W., Konwar, L., 1993. AMACS: a
user-friendly windows-based aquaculture monitoring and controlling software. In: Wang, L.K. (Ed.), Techniques for Modern Aquaculture. American Society of Agricultural Engineers, St. Joseph, MI, pp. 71 – 80.
Nisenfeld, A.E., 1989. Improving pilot plant effectiveness using a distributed control system. Control 11 (9), 69 – 77.
Padala, A., Zilber, S., 1991. Expert systems and their use in aquaculture. In: Rotifer and Microalgae Culture Systems. Proceedings of an US – Asia Workshop. Oceanic Institute, Honolulu, HI, pp. 221 – 227.
Palmer, J.D., 1989. The application of artificial intelligence and knowledge – based systems to fisheries and aquaculture. Virginia Sea Grant College Program, Pub. No. VSG-89-03, pp. 35.
Plummer, J., 1993. Tighter process control with neural networks. AI Expert 8 (10), 49 – 55.
Rao, N.H., Sanna, P.B.S., Chander, S., 1992. Real-time adaptive irrigation scheduling under a limited water supply. Agric. Water Manag. 20, 267 – 279.
Rock, D., Guerin, D., 1992. Applying AI to statistical process control. AI Expert 7, 30 – 35.
Ruohonen, K., 1987. Biological models related to automatic control in aquaculture. A case study: automatic feeding control. In: Balchen, L.G. (Ed.), Automation and Data Processing in Aquaculture. Pergamon Press, Oxford, pp. 75 – 80.
Rusch, K.A., Malone, R.F., 1991. Development of a micro-computer automated algal chemostat: overview from bench to production scale. In: Rotifer and Microalgae Culture Systems, Proceedings of a US – Asia Workshop. Oceanic Institute, Honolulu, HI, pp. 237 – 245.
Rusch, K.A., Malone, R.F., 1993. A micro-computer control and monitoring strategy applied to aquaculture. In: Wang, L.K. (Ed.), Techniques for Modern Aquaculture. American Society of Agricultural Engineers, St. Joseph, MI, pp. 53 – 60.
Spennato, N., Noblett, F., 1992. Integrating PLCs and DCSs via a computer and relational database. Instrum. Control Syst. 65 (6), 79 – 82.
Studt, T., 1994. Artificial intelligence software focuses on niche markets, R&D Magazine, December 13 – 15.
Turk, P.E., Lawrence, A.L., Lee, P.G., 1997. Design and operation of an environmentally isolated, marine shrimp broodstock culture system using closed, recirculating water filtration. In: Advances in Aquacultural Engineering. Northeast Regional Agricultural Engineering Service, Cornell, NY, NRAES-105, pp. 209 – 218.
Walters, R., 1994. Software reliability: your selection process will make the difference!. Instrum. Control Syst. 67 (12), 65 – 70.
Whitsell, A., Lee, P.G., 1994. A plug-and-play machine vision application for aquaculture. Sci. Comput. Autom. 10 (8), 29 – 32.
Whitsell, A., Whitson, L.L., Lee, P.G., 1997. A machine vision system for aquaculture: real-time identification of individual animals and estimation of animal activity. In: Advances in Aquacultural Engineering. Northeast Regional Agricultural Engineering Service, Comell, NY, NRAES-105,112 – 128.
Whitson, L., Turk, P., Lee, P.G., 1993. Biological denitrification in a closed recirculating marine culture system. In: Wang, J.K. (Ed.), Techniques for Modern Aquaculture. American Society of Agricultural Engineers, St. Joseph, MI, pp. 458 – 466.
Whitson, L.L., Turk, P.E., Lee, P.G., 1997. Emergent properties of computer automated environmental control and water filtration systems for aquaculture. In Advances in Aquacultural Engineering. Northeast Regional Agricultural Engineering Service, Comell, NY, NRAES-105:129 – 137. Widmyer, R., Widmyer, T., 1993. Capabilities and management of a continuous feeding system; spring
fed feeders. In: Wang, L.K. (Ed.), Techniques for Modern Aquaculture. American Society of Agricultural Engineers, St. Joseph, MI, pp. 431 – 438.
Wolske, B.K., 1989. Selecting the right software. Control 11 (9), 50 – 64.
Yingst, J.C., 1988. PC-based architecture guide process control. In Tech. 35 (9), 117 – 120.