Relationships between fibrinogen and insulin resistance
Eric Raynaud
a,b,*, Antonia Pe´rez-Martin
b, Jean-Fre´de´ric Brun
b,
Aomar Aı¨ssa-Benhaddad
b, Christine Fe´dou
b, Jacques Mercier
baDepartment of Metabolic and Clinical Biochemistry,Faculty of Pharmacy,34060Montpellier cedex2,France
bCERAMM(Centre d’Exploration et de Re´adaptation des Anomalies Me´taboliques et Musculaires),Lapeyronie Uni6ersity Hospital,
34295Montpellier cedex5,France
Received 15 April 1999; received in revised form 11 August 1999; accepted 8 September 1999
Abstract
A relationship between plasma fibrinogen levels and insulinemia, as well as the different parameters of the insulin resistance syndrome has been described. The aim of the present paper was to investigate whether plasma fibrinogen concentrations were linked to plasma insulin levels or to the degree of insulin resistance. For this purpose, 62 nondiabetic, nonhypertensive patients, 30 men and 32 women, with body mass indexes (BMIs) and ages ranging from 18.6 to 50.2 kg/m2 and from 19 to 60 years,
respectively, were studied. Insulin sensitivity was quantified by the minimal model procedure over a 180-min intravenous glucose tolerance test with iterative sampling. Plasma insulin was determined by radioimmunoassay without cross-reactivity to human proinsulin, and fibrinogen by the method of Clauss. Insulin sensitivity ranged from 0.009 to 23.2 min−1/(mU/ml)×10−4, covering
the whole range of insulin sensitivities. Fibrinogen ranged from 1.70 to 5.07 g/l. There was a significant negative correlation between fibrinogen and insulin sensitivity (r= −0.76,PB0.0001) and a positive correlation between fibrinogen and basal insulin (r=0.56,PB0.0001). After adjustment for BMI, body fat mass and waist-to-hip ratio, these two relationships remained significant. In addition, a multiple regression analysis was performed to assess the independent effect of the following related variables: fibrinogen, insulin sensitivity, insulinemia and BMI. Only insulin sensitivity appeared to account for the ability to predict fibrinogen values. Thus, we hypothesized it was likely that the state of insulin resistance rather than hyperinsulinemia per se was related to hyperfibrinogenemia. We proposed an interpretation of these data in connection with some factors like free fatty acids or tumor necrosis factor-a, which have been implicated in the pathogenesis of insulin resistance. Nevertheless, prospective
and intervention studies are needed to assess whether there is a simple association or a causal relationship between insulin resistance and hyperfibrinogenemia. © 2000 Elsevier Science Ireland Ltd. All rights reserved.
Keywords:Fibrinogen; Insulin sensitivity; Insulin; Minimal model; Metabolic syndrome
www.elsevier.com/locate/atherosclerosis
1. Introduction
In recent years, plasma fibrinogen level has emerged as an important risk factor for coronary heart disease. Strong evidence for this comes from several extensive cross-sectional and prospective epidemiological studies, which have demonstrated that high plasma fibrinogen levels represent an independent marker for cardiovascu-lar diseases in non-diabetic subjects [1]. Elevation of fibrinogen levels [2] and impaired fibrinolysis [3] are more common in diabetic patients than in non-diabetic subjects, although discordant results have been reported
[4]. Moreover, a number of studies have linked plasma fibrinogen with different components of the metabolic syndrome or syndrome X, namely type II diabetes, hypertension, hypertriglyceridemia and hyperinsuline-mia [5 – 7]. Nevertheless, there is no consensus about the impact of fibrinogen as a cardiovascular risk factor in the metabolic syndrome or in diabetes. Our knowledge about the relationship between hyperfibrinogenemia and hyperinsulinemia is still incomplete. Insulin resis-tance has been suggested as a potential pathogenetic link [5]. There are very few data on this topic. A study conducted on a relatively small sample of healthy young men showed a significant negative correlation between fibrinogen and the glucose disposal rate, which was used as an indicator of insulin sensitivity during an * Corresponding author. Tel.:+33-4-67-33-82-84; fax: +
33-4-67-33-89-63.
euglycemic hyperinsulinemic glucose clamp [8]. A simi-lar association was reported on a pooled sample of 22 normotensive and untreated mild hypertensive patients [9]. Apart from these two previous studies, there are no consistent data on the relationship between plasma fibrinogen and insulin resistance. Recently, we gave preliminary evidence for this association [10,11]. The aim of the present paper was to elucidate whether plasma fibrinogen concentrations were linked in fact to plasma insulin levels or to the degree of insulin resistance.
2. Subjects
The study population was a sample of 62 normo-glycemic patients (30 men and 32 women) who came to our Unit for a metabolic check-up. These subjects did not have diabetes according to the 1997 American Diabetes Association criteria [12]. No medication was taken on a regular basis. All subjects were non smokers. Anthropometric characteristics of the study sample are shown in Table 1. Blood pressure was measured on the right arm after 10 min in the supine position. Systolic blood pressure range was 100 – 140 mmHg (120.792.5) and diastolic blood pressure 65 – 90 mmHg (7192) in the whole group: there was no significant difference between men and women. Informed consent was ob-tained from all subjects and the protocol was approved by the local Ethics Committee.
3. Anthropometric measurements
Weight and height measurements were performed in underwear and BMI was then calculated. Waist and hip circumference measurements were taken using a non-extensive flexible tape at the narrowest part of the torso and at the point of maximum extension of the buttocks, respectively. The WHR was then calculated. Body com-position (body fat mass and percentage of body fat) was estimated by bioelectrical impedance analysis. All measurements were performed by a multi-frequency (1, 5, 10, 50, 100 kHz) device (Human IM-Scan from Dietosystem, Milano, Italy).
4. Study protocol and analytical methods
The frequently sampled intravenous glucose toler-ance test (FSIGTT) was performed as previously de-scribed [13]. After a 12-h overnight fast, an intravenous cannula was placed in the cephalic vein at the level of the cubital fossa for blood sampling, while glucose was injected in the contralateral cephalic vein. Glucose (0.5 g/kg solution at 30%) was slowly injected over 3 min. Insulin (0.02 units/kg body weight, i.e. 1 or 2 units) was injected intravenously immediately after 19 min. Blood samples were drawn twice before the glucose bolus and at 1, 3, 4, 8, 10, 15, 19, 20, 22, 30, 41, 70, 90 and 180 min following the onset of the glucose injection. The 1 and 3 min samples were used for the determination of insulin early secretory phase [14]. The other samples were necessary for minimal model calculations [15,16]. Giving insulin bolus at time 19 min improved the reliability of the measurements, since a marked increase of plasma insulin above baseline is needed for a correct calculation of insulin sensitivity [17].
Plasma glucose was measured in duplicate by the glucose oxidase method with a Beckman Glucose Ana-lyzer 2. Plasma insulin was determined by radioim-munoassay (kit Bi-Insulin IRMA from ERIA-Diagnostics Pasteur, France, without cross-reac-tivity to human proinsulin). All samples from a single patient were measured in the same assay. Blood sam-ples for fibrinogen were drawn at the beginning of the test, after the arm was cannulated. Fibrinogen levels were determined by the method of Clauss.
Minimal model analysis of FSIGTT was performed according to Bergman [17] with the software ‘TISPAG’ from our unit [13], which uses a non-linear least square estimation. This program gave the values of insulin sensitivity (SI) and glucose effectiveness (SG) as calcu-lated from the following equations:
dG(t)/dt= −[p1+X(t)]G(t)+p1Gb
G(0)=Go
dX(t)/dt= −p2X(t)+p3[I(t)−Ib]
X(0)=0
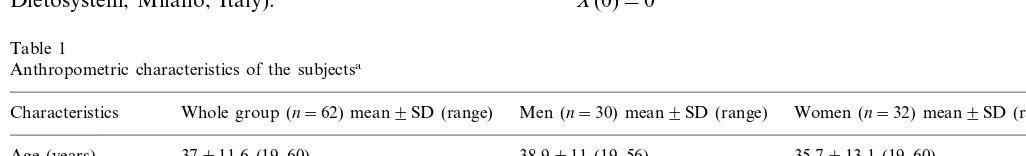
Table 1
Anthropometric characteristics of the subjectsa
Women (n=32) mean9SD (range) Characteristics Whole group (n=62) mean9SD (range) Men (n=30) mean9SD (range)
35.7913.1 (19–60) 38.9911 (19–56)
Age (years) 37911.6 (19–60) 30.497.4 (18.6–50.2)
BMI (kg/m2) 30.398.8 (18.6–50.2) 30.596.4 (20.5–45.2)
0.8390.07 (0.7–1.05)* 0.9190.11 (0.7–1.1)
0.8790.09 (0.7–1.1) WHR
31.7914 (9–57.7) 30.5916 (9–57.7) 33.8914.4 (12.9–53) Body fat mass (kg)
35.8910.4 (12.1–58.4)
Body fat mass (%) 31.5911.4 (12.1–58.4) 40.197.3 (22.7–48.5)*
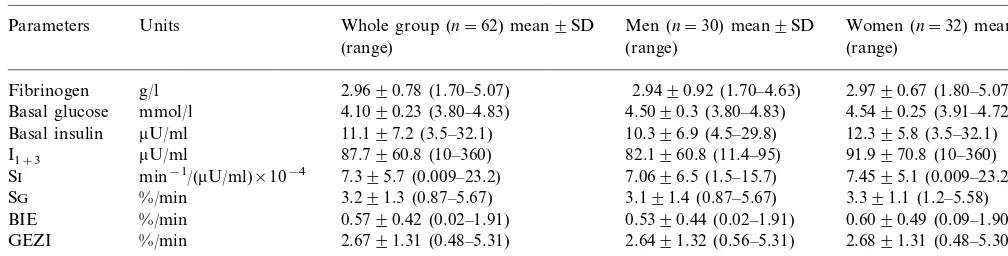
Table 2
Basal and minimal model-derived parametersa
Whole group (n=62) mean9SD
Parameters Units Men (n=30) mean9SD Women (n=32) mean9SD
(range) (range) (range)
Fibrinogen g/l 2.9690.78 (1.70–5.07) 2.9490.92 (1.70–4.63) 2.9790.67 (1.80–5.07) Basal glucose mmol/l 4.1090.23 (3.80–4.83) 4.5090.3 (3.80–4.83) 4.5490.25 (3.91–4.72)
11.197.2 (3.5–32.1) 10.396.9 (4.5–29.8)
0.5790.42 (0.02–1.91) 0.5390.44 (0.02–1.91)
%/min 0.6090.49 (0.09–1.90)
BIE
GEZI %/min 2.6791.31 (0.48–5.31) 2.6491.32 (0.56–5.31) 2.6891.31 (0.48–5.30) 2.4491.1 (0.47–4.44) 2.3091.2 (0.47–4.39)
%/min 2.5591.1 (0.77–4.44)
Kg4–19 aI
1+3, sum of insulin values at 1 and 3 min after the end of glucose infusion; SI, insulin sensitivity; SG, glucose effectiveness; BIE, basal insulin
effect; GEZI, glucose effectiveness at zero insulin; Kg4–19, slope of the exponential decrease of glucose between 4 and 19 min after glucose infusion.
where G(t) and I(t) are plasma glucose and insulin concentrations, X(t) is the insulin in a compartment remote from plasma (‘insulin action’), and p1–p3 are model parameters. Go is the glucose concentration that would be obtained immediately after injection if there was instantaneous mixing in the extracellular fluid com-partment. Gb and Ib are basal values of glucose and insulin. Parameter p1 represents SG, i.e. the fractional disappearance rate of glucose independent of any in-sulin response, p3 and p2 determine the kinetics of insulin transport, respectively into and out of the re-mote insulin compartment where insulin action is ex-pressed. SIis an index of the influence of plasma insulin to change the glucose effect per se on glucose concen-tration. Thus, SIis equal to−p3/p2.
SG was divided into its two components [18]: the contribution of hyperglycemia per se to tissue glucose utilization and the effect of basal insulin on glucose uptake. The basal insulin component of SG is termed the basal insulin effect (BIE) and can be calculated as the product of basal insulin Ib and SI (BIE=Ib×SI). Thus the contribution of non-insulin-dependent glucose uptake (glucose effectiveness at zero insulin, GEZI) to glucose uptake is the difference between total SG and the BIE (GEZI=SG−[Ib×SI]).
The validation of our procedure using a reduced number of sampling times has been published elsewhere [19]. For the accuracy of minimal model indices, the fractional standard deviations (FSD) were calculated in accordance with the criteria of Prigeon et al. [20].
In addition to the minimal model analysis, a separate approach using a classical monoexponential model of glucose disappearance was used. The least square slope of the log of absolute glucose concentration between 4 and 19 min after the glucose bolus, Kg4 – 19, was used as an index of glucose tolerance. The more classical Kg10 – 30, which measures the decrease in blood glucose be-tween 10 and 30 min [21], could not be used in this study since its results may be influenced by the insulin injection at the 19th min.
5. Statistical methods
Data are expressed as mean9SD. Statistical signifi-cance was set at PB0.05. The normal distribution of the variables was checked with the Kolmogorov – Smirnov test: if the variables were not normally dis-tributed, they were ln-transformed. Data from men and women were compared by using a t-test. Relationships between fibrinogen and parameters of glucose assimila-tion were analyzed by using Pearson and partial corre-lation coefficients. Additionally, a multiple regression analysis was performed to assess the independent effect of related variables. All calculations were performed with the SigmaStat package for Windows (Jandel Scien-tific, Erkrath, Germany).
6. Results
Table 2 summarizes the mean data of basal and minimal model-derived parameter values. The insulin sensitivity index SI, ranging from 0.009 to 23.2 min/
(mU/ml)×10−4, covered the whole range of insulin
sensitivities [17]. One patient presented a near-zero SI value and three patients had SI values under 1 min/
(mU/ml)×10−4. The mean fractional standard
devia-tions FSD, which represent the precision of minimal model fitting, were 7.691.2% for SI, and 13.991.1% for SG. In this study, there was no significant difference between men and women.
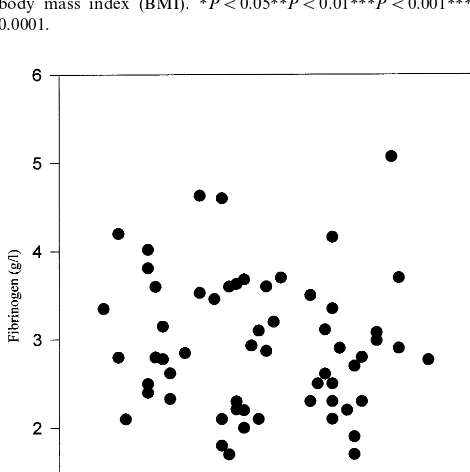
the influence of body composition, i.e. BMI, body fat mass and WHR, on these data. The negative relation-ships between fibrinogen and SI, between fibrinogen and BIE, just as the positive correlation between fibrinogen and basal insulinemia, remained significant after adjustment for these three confounding factors. In this study, fibrinogen was not found to be correlated to age (Fig. 2).
By a multiple regression analysis with fibrinogen as the dependent variable and BMI, SIand basal insuline-mia (ln-transformed) as independent variables, fibrino-gen could be predicted from a linear combination of the variables BMI (P=0.0055) and SI (PB0.0001), but not basal insulinemia (P=0.1102). The value of r2
for the entire model was 0.66. In fact, only SIappeared to account for the ability to predict fibrinogen.
7. Discussion
The purpose of this study was to assess whether hyperfibrinogenemia was linked to the condition of insulin resistance or to hyperinsulinemia, in a sample of patients covering the whole range of insulin sensitivi-ties. We used the minimal model analysis for determi-nation of insulin sensitivity through computer modeling of glucose and insulin dynamics from the FSIGTT. This procedure gives measurements that correlate strongly with and are equivalent to those obtained with the glucose clamp [22]. Recently, the question of the occurence of SI values indistinguishable from zero has arisen. We observed this phenomenon for only one subject of the study. Excluding this subject left the strength of the correlations unchanged. Although there is evidence for very low insulin sensitivity in type II diabetes, apparent near-zero values have emerged even in nondiabetic individuals [23]. Whether near-zero SI values represent a physiological state or a symptom of modeling deficiency, remains to be clarified.
We confirmed a highly significant negative correla-tion between fibrinogen and insulin sensitivity, and a positive correlation between fibrinogen and fasting in-sulin. These relationships remained significant after ad-justment for BMI, body fat mass and WHR. Plasma fibrinogen levels are known to increase gradually with age [24]: in the present study, there was no influence from this factor, since we found no significant correla-tion between fibrinogen and age. Smoking is associated with higher fibrinogen levels and may induce insulin resistance [25]. All subjects were non smokers, so that this important confounding factor had not to be taken into account.
Elevated levels of fibrinogen have been previously associated with decreased insulin-mediated glucose dis-posal during the glucose clamp procedure, in two small samples of healthy young men (n=21,r= −0.66,P=
Fig. 1. Correlation coefficients between plasma fibrinogen and basal insulinemia (Ib, ln-transformed), insulin sensitivity (SI), glucose
effec-tiveness (SG), basal insulin effect (BIE), glucose effeceffec-tiveness at zero insulin (GEZI) and slope of the exponential decrease of glucose between 4 and 19 min after glucose infusion (Kg4 – 19), before and
after adjustments for waist-to-hip ratio (WHR), body fat mass and body mass index (BMI). *PB0.05**PB0.01***PB0.001****PB
0.0001.
0.002) (8) and middle-aged men, half of whom were mildly hypertensive (n=22,r= −0.35,PB0.05) [9]. In the last-mentioned study, no correlation was found between fibrinogen and fasting insulin (r=0.06, NS) [9]. Our data corroborate the conclusions of a large cross-sectional study by Imperatore et al. [7], where hyperfibrinogenemia is proposed as a new component of the metabolic syndrome. This assumption is based on the association between age-adjusted fibrinogen lev-els and the classical symptoms of the metabolic syn-drome, i.e. high blood pressure, fasting plasma glucose and triglycerides, and low HDL cholesterol.
Our results should not be interpreted in terms of causality, since cross-sectional studies do not allow definition of causal relations. However, the conclusions of the multiple regression analysis lead us to argue that it is the state of insulin resistance rather than hyperin-sulinemia per se that is related to hyperfibrinogenemia. This hypothesis is consistent with that of Imperatore et al. [7,26], who considers the correlation between hyper-insulinemia and hyperfibrinogenemia as an epiphe-nomenon of the state of insulin resistance underlying hyperinsulinemia. Moreover, it should be noticed that insulin does not increase fibrinogen synthesis in cell cultures [27] and does not seem to acutely regulate fibrinolysis [28]. It has been proposed that the increased free fatty acids release, observed in the pathogenesis of insulin resistance and type II diabetes, could stimulate hepatic fibrinogen synthesis [29]. A defective fibrinoly-sis, with high plasminogen activator inhibitor-1 (PAI-1) levels, has been found in type II diabetic patients: PAI-1 levels are closely related to the amount of vis-ceral fat and thus seem to depend more on the insulin resistance syndrome that precedes type II diabetes than on diabetes itself [30]. Furthermore, plasma fibrinogen levels rise acutely in response to various stimuli, includ-ing release of cytokines such as tumor necrosis factor-a
(TNF-a) during the inflammation process. Recent
stud-ies have shown that TNF-a is implicated in the insulin
resistance of human obesity [31] and it is well known that TNF-a stimulates hepatic fibrinogen synthesis.
Therefore, it is clear that some pathogenetic conditions of the insulin resistance syndrome may lead to hyperfi-brinogenemia. Additionally, the use of troglitazone, a new thiazolidinedione derivative that improves insulin resistance, produced a better glycemic control and a significant decrease of the levels of PAI-1 and fibrino-gen in type II diabetic patients [32]. A similar result was obtained by a treatment with the angiotensin-convert-ing enzyme inhibitor perindopril in overweight hyper-tensive subjects [33]. Nevertheless, it is difficult to firmly establish whether the decrease of plasma fibrinogen levels is related to the improvement of insulin sensitivity or due to direct effects of the drugs on the regulatory mechanisms that control hepatic synthesis of fibrinogen.
In summary, there is a clear association between hyperfibrinogenemia and the metabolic syndrome, and this association is probably mediated by insulin resis-tance rather than hyperinsulinemia per se. Large prospective studies, including quantification of insulin sensitivity and measurements of various metabolic and hemostatic parameters, as well as intervention trials, are needed to clarify the link between hyperfibrinogenemia and insulin resistance. Fibrinogen lowering can be achieved by drugs, exercise or improved metabolic con-trol in diabetic patients. All of these drugs or lifestyle modifications influence other cardiovascular risk factors and it may be difficult to define precisely whether there is a simple association between fibrinogen and insulin resistance or a causal relationship.
References
[1] Ernst E, Resch KL. Fibrinogen as a cardiovascular risk factor: a meta-analysis and review of the literature. Ann Intern Med 1993;118:956 – 63.
[2] Neri S, Bruno CM, Raciti C, d’Angelo G, d’Amico R, Crisdtaldi R. Alteration of oxide reductive and haemostatic factors in type 2 diabetics. J Intern Med 1994;236:495 – 500.
[3] Juhan-Vague I, Roul C, Alessi MC, Ardissone JP, Heim M, Vague P. Increased plasminogen activator-inhibitor activity in non insulin dependent diabetic patients. Relationship with plasma insulin. Thromb Haemost 1989;61:370 – 3.
[4] El Khawand C, Jamart J, Donckier J, Chatelain B, Lavenne E, Moriau M, Buysschaert M. Hemostasis variables in type I diabetic patients without demonstrable vascular complications. Diabetes Care 1993;16:1137 – 45.
[5] The ECAT Angina Pectoris Study Group, Juhan-Vague I, Thompson SG, Jespersen J. Involvement of the hemostatic sys-tem in the insulin resistance syndrome: a study of 1500 patients with angina pectoris. Arterioscler Thromb 1993;13:1865 – 73. [6] Eliasson M, Evrin PE, Lunblad D. Fibrinogen and fibrinolytic
variables in relation to anthropometry, lipids and blood pres-sure: the Northern Sweden MONICA Study. J Clin Epidemiol 1994;47:513 – 24.
[7] Imperatore G, Riccardi G, Iovine C, Rivellese AA, Vaccaro O. Plasma fibrinogen: a new factor of the metabolic syndrome. Diabetes Care 1998;21:649 – 54.
[8] Moan A, Nordby G, Os I, Birkeland KI, Kjeldsen SE. Relation-ship between hemorrheologic factors and insulin sensitivity in healthy young men. Metabolism 1994;43:423 – 7.
[9] Landin K, Tengborn L, Smith U. Elevated fibrinogen and plasminogen activator inhibitor (PAI-1) in hypertension are re-lated to metabolic risk factors for cardiovascular disease. J Intern Med 1990;227:273 – 8.
[10] Raynaud E, Brun JF, Pe´rez-Martin A, Orsetti A, Sole`re M. Negative correlation between plasma fibrinogen and insulin sen-sitivity measured with the minimal model technique. Clin Hemorheol Microcirc 1998;18:323 – 30.
[11] Raynaud E, Brun JF, Pe´rez-Martin A, Mercier J. Association between fibrinogen levels and insulin resistance (Letter). Diabetes Care 1998;21:2040 – 1.
[12] American Diabetes Association. Report of the Expert Commit-tee on the diagnosis and classification of diabetes mellitus. Diabetes Care 1997;20:1183 – 97.
assimilation analyzed with the minimal model. Metabolism 1995;44:833 – 40.
[14] Bouix O, Brun JF, Orsetti A. The magnitude, the kinetics and the metabolic efficiency of first-phase insulin response to intra-venous glucose are related. Horm Metab Res 1993;25:312 – 6. [15] Steil GM, Bergman RN. Reduced sampling for the minimal
model estimate of insulin sensitivity from the modified and standard frequently sampled IVGTT. Diabetes 1991;Suppl. 1:38A.
[16] Ward GM, Weber KM, Walters IM, Aitken PM, Lee B, Best JD, et al. A modified minimal model analysis of insulin sensitiv-ity and glucose-mediated glucose disposal in insulin-dependent diabetes. Metabolism 1991;40:4 – 9.
[17] Bergman RN. Toward physiological understanding of glucose tolerance. Diabetes 1989;38:1512 – 27.
[18] Kahn SE, Bergman RN, Schwartz MW, Taborsky GJ Jr., Porte D Jr. Short-term hyperglycaemia and hyperinsulinaemia improve insulin action but do not alter glucose action in normal humans. Am J Physiol 1992;262:E518 – 23.
[19] Brun JF, Fe´dou C, Monnier JF, Jourdan N, Orsetti A. Relation-ships between insulin resistance measured with the minimal model and microalbuminuria in type 2 (non-insulin-dependent) diabetics. Endocrinol Metab 1995;2:203 – 13.
[20] Prigeon RL, Kahn SE, Porte D Jr. Reliability of error estimates from the minimal model: implications for measurements in phys-iological studies. Am J Physiol 1994;266:E279 – 86.
[21] Conard V, Franckson JRM, Bastenie PA, Kestens J, Kovacs L. Etude critique du triangle d’hyperglyce´mie intraveineux chez l’homme normal et de´termination d’un coefficient d’assimilation glucidique. Arch Int Pharmacodyn Ther 1953;93:277 – 92. [22] Bergman RN, Prager R, Volund A, Olefsky JM. Equivalence of
the insulin sensitivity index in man derived by the minimal model method and the euglycemic glucose clamp. J Clin Invest 1987;79:790 – 800.
[23] Saad MF, Anderson RL, Laws A, Watanabe RM, Kades WW, Chen YD, et al. A comparison between the minimal model and the glucose clamp in the assessment of insulin sensitivity across the spectrum of glucose tolerance: Insulin Resistance Atheroscle-rosis Study. Diabetes 1994;43:1114 – 21.
[24] Eliasson M, Asplund K, Evrin PE, Lundblad D. Relationship of cigarette smoking and snuff dipping to plasma fibrinogen, fibrinolytic variables and serum insulin. The Northern Sweden Monica study. Atherosclerosis 1995;113:41 – 53.
[25] Facchini FS, Hollenbeck CB, Jeppesen J, Chen YD, Reaven GM. Insulin resistance and cigarette smoking. Lancet 1992;339: 1128 – 30.
[26] Vaccaro O, Imperatore G, Riccardi G. Response to Raynaud et al. Diabetes Care 1998;21:2041.
[27] Alessi MC, Juhan-Vague I, Kooistra T, Declerck PJ, Collen D. Insulin stimulates the synthesis of plasminogen activator in-hibitor 1 by human hepatocellular cell line Hep G2. Thromb Haemost 1988;60:491 – 4.
[28] Fendri S, Roussel B, Lormeau B, Tribout B, Lalau JD. Insulin sensitivity, insulin action and fibrinolysis activity in nondiabetic and diabetic obese subjects. Metabolism 1998;47:1372 – 5. [29] Pickart LR, Thaler MM. Fatty acids, fibrinogen and blood flow:
a general mechanism for hyperfibrinogenemia and its pathologi-cal consequences. Med Hypotheses 1980;6:545 – 57.
[30] Vague P, Juhan-Vague I. Fibrinogen, fibrinolysis and diabetes mellitus: a comment. Diabetologia 1997;40:738 – 40.
[31] Saghizadeh M, Ong JM, Garvey WT, Henry RR, Kern PA. The expression of TNF-aby human muscle: relationship to insulin resistance. J Clin Invest 1996;97:1111 – 6.
[32] Kubo K. Effects of troglitazone on coagulation-fibrinolysis ab-normalities in patients with type II diabetes mellitus. Curr Ther Res 1998;59:537 – 44.
[33] Fogari R, Zoppi A, Lazzari P, Preti P, Mugellini A, Corradi L, Lusardi P. ACE inhibition but not angiotensin II antagonism reduces plasma fibrinogen and insulin resistance in overweight hypertensive patients. J Cardiovasc Pharmacol 1998;32:616 – 20.
.