LONG-TERM MARINE TRAFFIC MONITORING FOR ENVIRONMENTAL SAFETY IN
THE AEGEAN SEA
T. Giannakopoulosa∗, S. Gyftakisa, E. Charoua, S. Perantonisa, Z. Nivolianitoub, I. Koromilab, A. Makrygiorgosa a
Institute of Informatics and Telecommunications National Centre for Scientific Research “DEMOKRITOS” [email protected], [email protected], [email protected],
[email protected], [email protected]
b
Institute of Nuclear and Radiological Sciences and Technology, Energy and Safety, National Centre for Scientific Research “DEMOKRITOS”
[email protected], [email protected]
KEY WORDS:marine traffic monitoring, spatiotemporal analysis, statistics, policy recommendation
ABSTRACT:
The Aegean Sea is characterized by an extremely high marine safety risk, mainly due to the significant increase of the traffic of tankers from and to the Black Sea that pass through narrow straits formed by the 1600 Greek islands. Reducing the risk of a ship accident is therefore vital to all socio-economic and environmental sectors. This paper presents an online long-term marine traffic monitoring work-flow that focuses on extracting aggregated vessel risks using spatiotemporal analysis of multilayer information: vessel trajectories, vessel data, meteorological data, bathymetric / hydrographic data as well as information regarding environmentally important areas (e.g. protected high-risk areas, etc.). A web interface that enables user-friendly spatiotemporal queries is implemented at the front-end, while a series of data mining functionalities extracts aggregated statistics regarding: (a) marine risks and accident probabilities for particular areas (b) trajectories clustering information (c) general marine statistics (cargo types, etc.) and (d) correlation between spatial environmental importance and marine traffic risk. Towards this end, a set of data clustering and probabilistic graphical modelling techniques has been adopted.
1. INTRODUCTION
Conservation of the marine environment is fundamental for life on earth since the Seas cover the majority of the surface of the globe and play an essential role in weather and climate. In addi-tion, it is necessary to minimize the risks of pollution and harm done to it by human activities, and particularly by the cargo trans-ported by the liner shipping industry which represents about two-thirds of the value of total global trade, equating each year to more than four trillion dollars worth of goods. In this work, the target area is the Aegean Sea, which represents an example where there is high marine safety risk due to the shipping activities. Re-ducing the possibility of ship accidents in the Aegean Sea is im-portant to all social, economic, environmental, and cultural sec-tors of Greece, since it supports and enables a significant part of the Greek economy, especially tourism.
A possible maritime accident would result in reduced investor confidence in infrastructures and transportation, the closure of fisheries, the devastation of local communities and tourism, as well as it would result in a severe impact on public health. Oil spill cleanups can cost over a millions Euros (Grey, 1999), (Kon-tovas et al., 2010), (Liu and Wirtz, 2006), whereas accidents involving spill of water soluble hazardous cargo are impossible to clean up. Most importantly, a huge marine accident in the Aegean would also result in long term catastrophic and irrevoca-ble changes to the Aegean ecosystem. It is therefore obvious that it is vital to take measures towards the reduction of the disaster risk resulting in chronic pollution and permanent damage. De-spite the fact that the Greek Maritime Authorities monitor activ-ity in certain prioractiv-ity areas, there are no national level monitoring policies, mainly due to legal limitations when enforcing shipping
∗Corresponding author
routes in the Aegean Sea. Therefore, all involved “stakeholders” (ship companies and policy makers) would directly benefit from a monitoring system that:
• outputs optimal safe routes
• delivers real-time alerts for their ships whenever there is an increased possibility of accident
• provides policy recommendation support
These are the capabilities of the AMINESS platform1 (Giannakopou-los et al., 2014): it will integrate information from multiple sources as well as historical maritime data that have been preprocessed, in order to provide the three expected capabilities: real-time alert-ing, optimal routing and policy support. In this paper, we focus on proposing a framework for long-term monitoring of ship tra-jectories in the context of a policy recommendation tool.
2. LONG-TERM MONITORING TOOL
2.1 Architecture, methodology and implementation issues
The purpose of the proposed long-term monitoring tool is to ex-tract user-friendly data analytics to policy makers and general users regarding vessel traffic. It is mainly based on historical ma-rine traffic data as its purpose is to extract long-term statistics and trends. The tool makes use of all types of spatio-temporal marine
1www.aminess.eu
The International Archives of the Photogrammetry, Remote Sensing and Spatial Information Sciences, Volume XL-7/W3, 2015 36th International Symposium on Remote Sensing of Environment, 11–15 May 2015, Berlin, Germany
This contribution has been peer-reviewed.
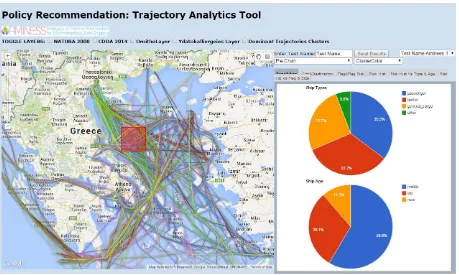
Figure 1: Screenshot of the long-term monitoring tool
data, however it will mostly focus on (a) long-term vessel tra-jectories (b) static vessel details and (c) dynamic spatiotemporal data (weather).
The basic submodules used in the context of the tool are the fol-lowing:
• Trajectory clustering. This is the task of grouping objects based on their spatial and temporal similarity (Kisilevich et al., 2010). The goal of this submodule is therefore to group similar vessel trajectories into homogeneous categories. The output of this functionality can be considered as a set of “channel trajectories”. Each channel is mapped to a single trajectory cluster and it can be considered as an aggregated average of similar trajectories. The usefulness of this func-tionality is twofold: (a) to provide better visualizations of large trajectory datasets and (b) to extract a more efficient and compressed representation of sets of trajectories.
• Static vessel risk estimate: this submodule aims to use Baye-sian Networks in order to empirically estimate a risk mea-sure related to each ship, given its attributes (Koromila et al., 2014). Aggregated results of this risk will be visualized in the policy recommendation tool in order to provide an im-age of the estimated ship risk distribution. We prefer BNs because compared to fuzzy logic approaches (e.g. (Balmat et al., 2011)) they provide a human interpretable and prob-abilistic modeling of the problem, allowing the straightfor-ward incorporation of expert knowledge. In addition, they can both be empirically structured or statistically trained from data.
• Dynamic risk estimate: the goal here is similar to the pre-vious submodule, however in that case time-dependent data is used as input to the risk model: weather data, ship traffic etc. Fuzzy logic has also been used for dynamic ship risk estimation.
In order to visualize the historical trajectories and their attributes (e.g. cluster labels, dynamic and static risks extracted by the aforementioned modules), a user-friendly web application has been developed that assists in the policy recommendations. More specifically the application accepts spatial input from the user, ex-ecutes a spatiotemporal query to the system database and displays the results with several diagrams. In particular, the input to the interface consists of a rectangular area that the user draws over the area under consideration. We have focused on extracting ag-gregated statistics for the given bounding box through respective diagrams. Each diagram displays the spatiotemporal (in general) variability of an attribute of the trajectories that are contained in the selected area. Towards this end, a spatiotemporal query is per-formed on the system database using this user defined bounding box. On the server side an intersection is performed on the tra-jectories of the database vessels and the tratra-jectories that are con-tained or intersected by that rectangular are selected and returned to the interface together with their attributes. The trajectory co-ordinates are stored as KML lines. This makes the trajectory re-trieving process via intersection queries rather simple and fast. As soon as the intersected trajectories are retrieved, the respec-tive attributes are aggregated and presented as statistics diagrams to the user.
The basic statistics are organized in six individual statistic types (sections), some of which contain two separate subsections. Each statistic type corresponds to a set of charts for a particular type of aggregated vessel and/or area characteristic. In each section the variability of one attribute (of the selected trajectories) is dis-played. The particular statistics presented by the data analytics software are the following:
• Vessel Type
• Vessel Age
• Vessel Size
The International Archives of the Photogrammetry, Remote Sensing and Spatial Information Sciences, Volume XL-7/W3, 2015 36th International Symposium on Remote Sensing of Environment, 11–15 May 2015, Berlin, Germany
This contribution has been peer-reviewed.
• Vessel Port (destination at the respective trajectories)
• Vessel Flag
• Vessel Flag Ship Risk (a risk estimate given the particular ship flag)
• Risk Histogram: a histogram of the (aggregated) estimated risks.
• Risk distributions vs particular ship attributes. This func-tionality can be used as explanatory analysis of the risk dis-tribution against particular ship variables and in particular:
– Risk Histogram vs. Type
– Risk Histogram vs. Age
– Risk Histogram vs. Flag
– Risk Histogram vs. Size
Figure 2: Example of Pie Charts (ShipType, ShipAge)
Figure 3: Example of Risk Histogram per ShipType and per ShipAge
2.2 Use-case
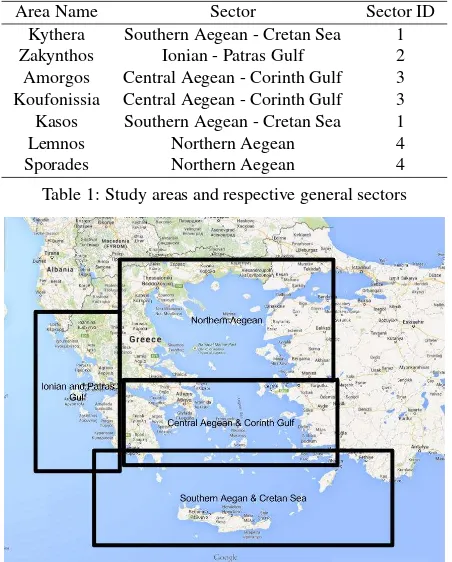
We have used the implemented long-term visualization interface in order to extract aggregated statistics from seven areas of ma-jor interest in the Greek marine territory. We have particularly selected 7 areas in the Greek marine territory based on their envi-ronmental importance. These areas either include protected areas (e.g. NATURA) or accommodate highly important species. Ta-ble 1 presents the names of these areas along with their respective sectors (see Figure 4).
Area Name Sector Sector ID
Kythera Southern Aegean - Cretan Sea 1
Zakynthos Ionian - Patras Gulf 2
Amorgos Central Aegean - Corinth Gulf 3 Koufonissia Central Aegean - Corinth Gulf 3 Kasos Southern Aegean - Cretan Sea 1
Lemnos Northern Aegean 4
Sporades Northern Aegean 4
Table 1: Study areas and respective general sectors
Figure 4: General sectors distribution
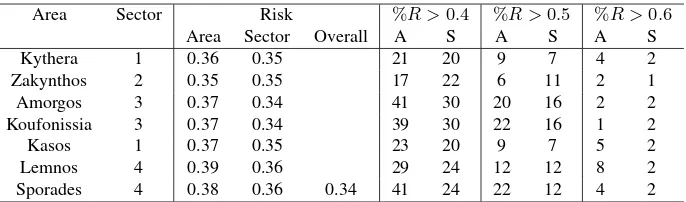
For each of areas and corresponding sectors we have retrieved the trajectories that intersect with them and then aggregated their statistics, focusing on the average vessel risk. This whole process of user-defined spatio-temporal vessel trajectory retrieval is sup-ported through the proposed policy recommendation interface. Results of aggregated risk statistics are shown in 2. This table presents:
• The average risk of the area of interest, compared to the re-spective sector’s average risk and the overall Greek marine average risk
• The percentage of vessel trajectories that are higher than three predefined thresholds (0.4,0.5and0.6), for both the areas of interest and the respective sectors.
The results of table 2 prove that:
• In all areas, the average risk is higher than the corresponding general sector’s risk.
• The percentage of trajectories belonging to the three high-risk-zones is almost always significantly higher than the re-spective percentages in the sector’s aggregates.
The International Archives of the Photogrammetry, Remote Sensing and Spatial Information Sciences, Volume XL-7/W3, 2015 36th International Symposium on Remote Sensing of Environment, 11–15 May 2015, Berlin, Germany
This contribution has been peer-reviewed.
Area Sector Risk %R >0.4 %R >0.5 %R >0.6
Area Sector Overall A S A S A S
Kythera 1 0.36 0.35 21 20 9 7 4 2
Zakynthos 2 0.35 0.35 17 22 6 11 2 1
Amorgos 3 0.37 0.34 41 30 20 16 2 2
Koufonissia 3 0.37 0.34
0.34
39 30 22 16 1 2
Kasos 1 0.37 0.35 23 20 9 7 5 2
Lemnos 4 0.39 0.36 29 24 12 12 8 2
Sporades 4 0.38 0.36 41 24 22 12 4 2
Table 2: Aggregated risk results. Table shows the average risk differences between each area of interest and corresponding general sectors.
3. CONCLUSIONS
In this paper we present a framework for long-term monitoring of ship trajectories in the context of a policy recommendation tool towards the reduction of ship accidents in the Aegean Sea. We describe the basic submodules and the web interface functional-ities. A case study is performed on 7 environmentally sensitive areas of the Aegean Sea. For each area the spatiotemporal query produces aggregated statistics of the included vessel risks. The analysis of the average risk of each area and the comparison to corresponding larger sectors prove the importance of using the developed web tool.
ACKNOWLEDGMENTS
This work was carried out in the framework of the project “AMI-NESS: Analysis of Marine Information for Environmentally Safe Shipping” which was co-financed by the European Fund for Re-gional Development and from Greek National funds through the operational programs “Competitiveness and Entrepreneurship” and “Regions in Transition” of the National Strategic Reference Frame-work - Action: “COOPERATION 2011 Partnerships of Produc-tion and Research InstituProduc-tions in Focused Research and Technol-ogy Sectors”.
REFERENCES
Balmat, J.-F., Lafont, F., Maifret, R. and Pessel, N., 2011. A decision-making system to maritime risk assessment. Ocean En-gineering 38(1), pp. 171–176.
Giannakopoulos, T., Vetsikas, I. A., Koromila, I., Karkaletsis, V. and Perantonis, S., 2014. Aminess: a platform for environmen-tally safe shipping. In: Proceedings of the 7th International Con-ference on PErvasive Technologies Related to Assistive Environ-ments, ACM, p. 45.
Grey, C. J., 1999. The cost of oil spills from tankers: an analysis of iopc fund incidents. In: International Oil Spill Conference, Vol. 1999number 1, American Petroleum Institute, pp. 41–47.
Kisilevich, S., Mansmann, F., Nanni, M. and Rinzivillo, S., 2010. Spatio-temporal clustering: a Survey. Springer.
Kontovas, C. A., Psaraftis, H. N. and Ventikos, N. P., 2010. An empirical analysis of iopcf oil spill cost data. Marine pollution bulletin 60(9), pp. 1455–1466.
Koromila, I., Nivolianitou, Z. and Giannakopoulos, T., 2014. Bayesian network to predict environmental risk of a possible ship accident. In: Proceedings of the 7th International Conference on PErvasive Technologies Related to Assistive Environments, ACM, p. 44.
Liu, X. and Wirtz, K. W., 2006. Total oil spill costs and compen-sations. Maritime Policy & Management 33(1), pp. 49–60.
The International Archives of the Photogrammetry, Remote Sensing and Spatial Information Sciences, Volume XL-7/W3, 2015 36th International Symposium on Remote Sensing of Environment, 11–15 May 2015, Berlin, Germany
This contribution has been peer-reviewed.