RICE CROP MONITORING AND YIELD ASSESSMENT WITH MODIS 250m GRIDDED
VEGETATION PRODUCT: A case study in Sa Kaeo Province, Thailand
J. S. J. Wijesinghaa,∗, N. L. Deshapriyab, L. Samarakoonb a
Department of Physical Geography and Ecosystem Science, Lund University, S¨olvegatan 12, S223 62 Lund, Sweden [email protected]
b
Geoinformatics Center (GIC), Asian Institute of Technology (AIT), PO Box 04, Klong Luang, Pathumthani, Thailand [email protected], [email protected]
KEY WORDS:Rice Phenology, MODIS, NDVI, EVI, Whittaker Smoother
ABSTRACT:
Billions of people in the world depend on rice as a staple food and as an income-generating crop. Asia is the leader in rice cultivation and it is necessary to maintain an up-to-date rice-related database to ensure food security as well as economic development. This study investigates general applicability of high temporal resolution Moderate Resolution Imaging Spectroradiometer (MODIS) 250m gridded vegetation product for monitoring rice crop growth, mapping rice crop acreage and analyzing crop yield, at the province-level. The MODIS 250m Normalized Difference Vegetation Index (NDVI) and Enhanced Vegetation Index (EVI) time series data, field data and crop calendar information were utilized in this research in Sa Kaeo Province, Thailand. The following methodology was used: (1) data pre-processing and rice plant growth analysis using Vegetation Indices (VI) (2) extraction of rice acreage and start-of-season dates from VI time series data (3) accuracy assessment, and (4) yield analysis with MODIS VI. The results show a direct relationship between rice plant height and MODIS VI. The crop calendar information and the smoothed NDVI time series with Whittaker Smoother gave high rice acreage estimation (with 86% area accuracy and 75% classification accuracy). Point level yield analysis showed that the MODIS EVI is highly correlated with rice yield and yield prediction using maximum EVI in the rice cycle predicted yield with an average prediction error 4.2%. This study shows the immense potential of MODIS gridded vegetation product for keeping an up-to-date Geographic Information System of rice cultivation.
1. INTRODUCTION
1.1 Background
Rice is the second most harvested staple food in the world and the leading staple food in Asia. Rice would be contributes heavily to the alleviation of hunger and poverty since millions of small farmers grow millions of hectares of rice in the Asian region. In addition, there are millions of landless workers who generate some income by working on these farms. Moreover, 60% of the global population and 90% of the world rice production is derived from the Asian continent (Claessens, 2013).
Rice monitoring and mapping are thus very important for opti-mizing food security, environmental sustainability, water secu-rity, greenhouse gas emission reduction and general economic prosperity. Most countries in the Asian region use limited survey methods to collect rice paddy data from community level to na-tional level. These data sources do not meet the needs of science and policy researchers, who need geo-spatial databases of rice agriculture with updated spatial and temporal resolution (Xiao et al., 2006).
Remote Sensing is becoming an essential tool for monitoring and mapping rice growing over large areas, at repeated time intervals (Son et al., 2012). According to a review article of Remote Sens-ing of rice crop areas, Remote SensSens-ing combined with Geograph-ical Information System(GIS) (Kuenzer and Knauer, 2013), can provide reliable information for the following purposes related to rice farming:
• Mapping and monitoring the extent of rice growing ecosys-tems
∗Corresponding author.
• Monitoring and assessment of rice growth and health status • Assessment of crop pattern and crop system efficiency • Estimation of crop growth related parameters • Precision agriculture
• Improvement, and extension of, crop growth and yield mod-els
High temporal and medium spatial resolution optical Remote Sens-ingVegetation Indices(VI) known asNormalized Vegetation In-dex(NDVI) andEnhanced Vegetation Index(EVI) andLand Sur-face Water Index(LSWI) are utilized to map and monitor rice agriculture on a small scale, and analyzed in a global, continen-tal, and subcontinental context (Sakamoto et al., 2005); (Xiao et al., 2006). Moderate Resolution Imaging Spectroradiometer
(MODIS) sensor data was the major data source for those studies. Various time series image analysis techniques, such as wavelet analysis, Artificial Neural Network (ANN), Time Series Regres-sion and Time Series Image Classification, were used to derive rice crop acreage and phenology. (Kuenzer and Knauer, 2013);(Jonai and Takeuchi, 2012);(Sakamoto et al., 2005);(Son et al., 2012);(Xiao et al., 2006).
1.2 MODIS Gridded Vegetation Product
and XX refers to one letter and one number. For example, if XX is Q1, then a sixteen-day composite image with 250m resolution is shown. If XX is A3, then a one-month composite with 1000m resolution is presented). Each year, one satellite sensor provides 23 images of sixteen-day composites. Production of Terra and Aqua products can be improved using the following temporal phase shifts: Terra 16-day period starting day 001, with Aqua 16-day period starting day 009) (Didan et al., 2010).
OneHierarchical Data Format(HDF) data-set in MXD13Q1 pro-vides twelve layers which are NDVI, EVI, Surface reflectance of visible blue, visible red, NIR,Mid-Infrared(MIR) (2105-2155nm), VIQuality Assessment(QA) layer, composite day-of-year layer and four other layers.
MODIS VI data composite algorithm was based on Advanced Very High Resolution Radiometer-NDVI composite algorithm.
Constrained View Angle-Maximum Value Composite(CV-MVC) andBidirectional Reflectance Distribution Function Composite
(BEDF-C) were developed by MODIS science team to design MODIS VI. Currently, CV-MVC is used as the primary composit-ing algorithm for MODIS VI Products (Shao et al., 2011).
NDVI defined by equation (1) is a normalized difference mea-sure, comparing the near infrared and visible red bands defend by equation 1 whereρN I R(841-876nm) andρRed(620-670nm)
are the bi-directional surface reflectance for their respective MODIS bands. The NDVI is closely correlated with paddy area Leaf Area Index (LAI) (Xiao et al., 2006).
N DV I= ρN I R−ρRed ρN I R+ρRed
(1)
EVI was developed as an alternative vegetation index to NDVI, and is defined in the following equation (2), whereρN I R,ρRed,
andρBlue(458-479nm) are atmospherically corrected (or
par-tially atmospherically corrected) surface reflectance, andC1,C2, andLare coefficients to correct for atmospheric condition (i.e., aerosol resistance). For the standard MODIS EVI product,L=1, C1=6, andC2=7.5 (Didan et al., 2010).
EV I=G ρN I R−ρRed
ρN I R+C1ρRed−C2ρBlue+L
(2)
The MODIS Land VI QA provides quality assurance data for each pixel of the product as a bit field value. Composite day-of-year layer offers information for each pixel, representing the Julian day during the sixteen-day compositing period when re-flectance was recorded (Pringle et al., 2012).
The noticeable difference between MODIS NDVI and EVI is the dynamic range. In high bio mass areas, MODIS NDVI appears to be saturated, whereas EVI shows more sensitivity (Shao et al., 2011).
1.3 Research Problem and Objectives
National and regional level rice crop monitoring and mapping is not enough to address food security, water management, and environmental stability problems in detail. Provincial or district level crop monitoring and mapping will be an effective way to address the above problems.
A number of studies have involved high level image processing techniques to rice crop monitoring, using satellite data. However,
these methodologies were not applied to develop an active up-to-date rice crop monitoring system at the provincial- or district-level, which can be easily used by government officials as well as administrators to manage and plan rice cultivation.
The specific objectives of this study were to investigate general applicability of high temporal resolution MODIS 250m gridded vegetation product for rice crop growth monitoring, rice crop acreage mapping, and yield analysis at the province level. This study addresses the following three primary research questions concerning rice crop monitoring and mapping:
I. How is the rice plant growth illustrated by the Remote Sens-ing VI?
II. How can you apply Threshold (Beurs and Henebry, 2010) method to determine rice crop information (area, phenol-ogy) using MODIS data?
III. How do MODIS NDVI and EVI time series data represent a rice crop and its yield?
To address these questions, a Remote Sensing image analysis was performed combination with statistical analysis using MODIS 250m gridded vegetation product data from May to December 2013 across the Sa Kaeo Province in Thailand.
2. MATERIALS AND METHODS
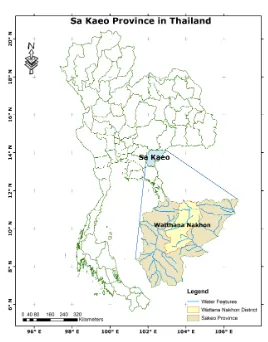
2.1 Study Area
Figure 1: Map of the Sa Kaeo Province and Watthana Nakhon District
2.2 Data
2.2.1 Remote Sensing / GIS Data: MODIS gridded VI prod-uct with 250m resolution (MXD13Q1) h27v07 tile was used as the main Remote Sensing data. The VI product data from both Aqua and Terra Satellites (31 images from each platform) was taken over an eight month period (from 2013-05-01 to 2013-12-27). Advance Land Observation Satellite (ALOS) global for-est/non forest data was used to identify the forest area in the study.
2.2.2 Field Statistics: Filed visit and field data collection was performed at four paddy plots in Watthana Nakhon District over the course of one complete rice cycle, during which time the MODIS satellites were observing the crops. A summary of the field sites is presented in Table 1. Plant height, water level in the field and canals and yield are collected during the field visit. Geo-tag photographs were taken in every visit to record the change of paddy growth. Province-level agriculture statistics were obtained from the Office of Agriculture Economics and district-level agri-culture statistics were provided by the Watthana Nakhon District Agriculture Office.
Site
No Village
Cultivation
started Rice variety 1 M6 - Ban Nongkum 10 July Leuang Awn
2 M3 - Ban Noongik 06 July Khao Dawk
Mali 105
3 M14 - Ban Wang Siaw 07 July Khao-Tah Haeng 17
4 M9 - Ban Tahg Luang 04 July Khao Dawk Mali 105
Table 1: Summary of the field data collection sites
2.3 Step Processing
The whole study can be divided into the following four parts: (1) data pre-processing, (2) rice plant growth analysis using VI, (3) extracting rice crop parameters (e.g. acreage, start-of-season mapping from VI time series and accuracy assessment), and (4) rice yield analysis with MODIS VI.
2.3.1 Data pre-processing: Vegetation index layers (NDVI and EVI), VI QA layer, spectral bands (red, NIR, and MIR), and composite day-of-year layer were extracted from each MODIS HDF product as Geotiff images and then projected to WGS84 ge-ographic projection. Eight days of NDVI and EVI images were stacked as a time series and detailed beyond Sa Kaeo province were masked out. The main element of pre-processing was the smoothing of the time series image stack. The VI time series was smoothed by using modified Whittaker Smoother with negatively biased noise of VI QA values and composite day-of-year values (Atzberger and Eilers, 2011);(Mattiuzzi and Lobo, 2013). Figure 2 shows selected time series before and after smoothing.
2.3.2 Rice plant growth monitoring with RS VI: Rice plant height data from field observation was plotted against extracted corresponding pixel values in VI (NDVI, EVI) data. Rice plant growth and VI pattern was observed.
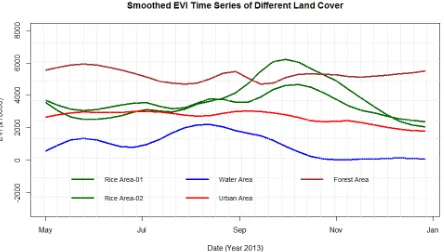
2.3.3 Extracting Rice Cultivation Parameters: There are sev-eral spatio-temporal methods for extracting rice acreage and phe-nology from VI time series (Kuenzer and Knauer, 2013). This research work utilizes the simple threshold method (Beurs and Henebry, 2010). First, VI time series graphs were plotted for each land cover type (forest, water, urban, and paddy) to identify patterns and determine threshold values. After analyzing each land cover time series graph, an unique pattern was observed in
Figure 2: VI time series before and after applying smoothing
the paddy land cover data. Figure 3 and 4 show the how each land cover was interpreted by NDVI and EVI time series. When the rice paddy transitions from vegetative phase to reproductive phase, VI values increase up to a maximum. During the transi-tion from reproductive phase to harvesting, VI values decrease. Paddy rice NDVI and EVI time series profiles therefore exhibit one major peak throughout the season. The date of this maxi-mum is referred to as the heading date. By plotting several paddy pixel time series graphs, the threshold values for extracting paddy area were determined to be 0.6 and 0.47, for NDVI and EVI re-spectively.
Figure 3: NDVI Time series graphs of different land cover
Figure 4: EVI Time series graphs of different land cover
the difference between the dates of the first and second peaks. If the time difference was more than 80 days, those pixels were considered as representing a double rice paddy. There are two reasons for this condition: (1) a typical rice cycle is about 120 days, and thus cannot be much less than that, and (2) cassava and maze are cultivated with rice as a double crop pattern in some areas of the Sa Kaeo province. ALOS forest cover data was used to mask out the forest area in the study area.
In general, Sa Kaeo province rice cultivation cycle varies from 120 days 140 days. Therefore the rice planting date was occurred 60-70 days before the heading date. The start-of-season for each rice cultivation pixel was calculated by subtracting 70 days from heading date, and start dates were grouped monthly.
Accuracy of rice acreage was measured by comparing province-level and district-province-level rice cultivation area statistics and calculat-ing the confusion matrix and kappa coefficient uscalculat-ing ground truth from the field data.
2.3.4 Rice yield analysis with Remote Sensing VI: Chloro-phyll content is related to the production of yield of the rice plant and it is reflected by Remote Sensing VI. The VI data was there-fore used to determine if there is a correlation between MODIS VI and rice yield, and how the correlation changes with NDVI and EVI. Yield assessment was done using field data gathered from Site 2 and Site 4. The correlation coefficient and liner re-gression analysis of yield was evaluated against maximum VI of the season, cumulative mean VI of the season, and VI of the flow-ering date (for both NDVI and EVI). Regression analysis results from each VI were compared to determine which VI was associ-ated with the highest rice yield. The yield of the Site 3 was pre-dicted from the most highly correlated VI model and compared to the actual yield.
3. RESULTS & DISCUSSION
Figure 5: Geo-tag photograph time series of rice paddy cultiva-tion
Rice plant growth observation from the field work is shown in Figure 5. The time series geo-tag photographs clearly show how the plant color changes from light-green to green, and then to yellow.
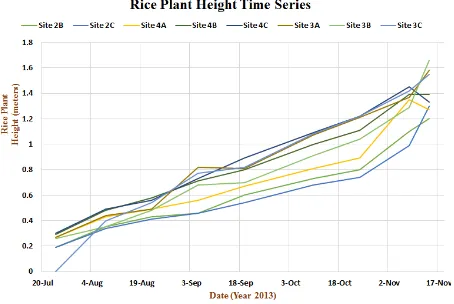
Figure 6 illustrates rice plant height time series in each field site. According to the time series graph, rice plants grew more than 1.2m height and plants grew with approximately uniform speed.
3.1 Plant height and vegetation indices
We can observe how VI changes with plant height from the graphs of Figure 7. When plant height reached between 0.7m and 1.0m,
Figure 6: Rice Plant Time Series
NDVI and EVI show their peak values during the plant cycle. However, both NDVI and EVI show a similar pattern in plant height. At the start-of-the season, VI increases with plant height and reaches to peak level, and then it decreases while plant height is increasing.
Figure 7: Graph of Rice plant height vs VI (NDVI and EVI)
3.2 Rice acreage and start-of-season Mapping
Figure 8 and Figure 9 exhibit NDVI and EVI maps of the rice crop distribution Sa Kaeo Province. Total rice cultivation area in Sa Kaeo province is calculated from both analyses. They are 138795.16ha (NDVI) and 152944.08ha (EVI).
The starting month for single crop areas are shown in Figure 10 and Figure 11. Both NDVI and EVI analyses show more than 80% of the paddy fields in single crop areas were started in June, July, or August in year 2013.
Figure 8: Rice Crop Intensity map from NDVI in Sa Kaeo Province, Thailand)
Figure 9: Rice Crop Intensity map from EVI in Sa Kaeo Province, Thailand)
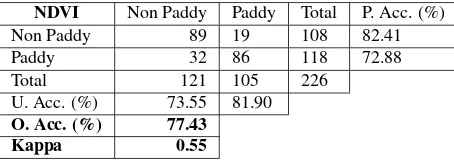
Overall accuracy of NDVI-based rice paddy area mapping is 77.43% and the Kappa coefficient is 0.55. The EVI-based rice acreage mapping overall accuracy is 76.47%, with a the Kappa coefficient of 0.52. The associated confusion matrices from both analyses are shown in Table 2 and Table 3.
NDVI Non Paddy Paddy Total P. Acc. (%)
Non Paddy 89 19 108 82.41
Paddy 32 86 118 72.88
Total 121 105 226
U. Acc. (%) 73.55 81.90 O. Acc. (%) 77.43
Kappa 0.55
Table 2: Accuracy assessment of NDVI-based rice acreage map-ping
Province-level rice acreage was calculated by comparing the VI-determined acreage with the statistics provided by the Office of Agriculture Economics. Total acreage determined by NDVI was
Figure 10: Single rice crop area start-of-season in Sa Kaeo Province, using NDVI
Figure 11: Single rice crop area start-of-season in Sa Kaeo Province, using EVI
EVI Non Paddy Paddy Total P. Acc. (%)
Non Paddy 100 34 134 74.63
Paddy 18 69 87 79.31
Total 118 103 221
U. Acc. (%) 84.75 66.99 O. Acc. (%) 76.47
Kappa 0.52
Table 3: Accuracy assessment of EVI-based rice acreage map-ping
esti-mated by NDVI and EVI with in 14% maximum deviation. Con-fusion matrix analysis shows that rice acreage estimation using NDVI and EVI has an accuracy of more than 75%. Table 4 sum-marizes the area-based accuracy.
Level Area (ha) Method Estimated (ha) RE (%)
Province 135265.60 NDVI 138795.16 -2.61
EVI 152944.08 -13.07
District 33174.08 NDVI 29490.81 +11.10
EVI 31916.44 +3.79
Table 4: Summary of the area based accuracy assessment
3.3 Yeild Analysis
Rice yield and NDVI/EVI correlation analysis was done in three different ways. First, a correlation and linear regression analy-sis was performed using maximum VI of the time series and the yield. For the yield with maximum NDVI and maximum EVI, the correlation coefficient were 0.45 and 0.98, respectively. Analy-sis shows that the maximum EVI has the highest correlation with yield. The R-square values from linear regression analysis are 0.2 (NDVI) and 0.95 (EVI).
Second, the correlation between yield and flowering date VI was investigated. The average flowering date was founded by a sur-vey done on farmers and it was on the 14th October, 2013. The R2values for linear regression are 0.72 (NDVI) and 0.92 (EVI). Table 5 summarizes regression analysis results of the above two methods.
Method VI R2Value
Maximum VI NDVI 0.20
EVI 0.95
Flowering Date VI NDVI 0.72
EVI 0.93
Table 5: Regression for yield with maximum VI and flowering date VI
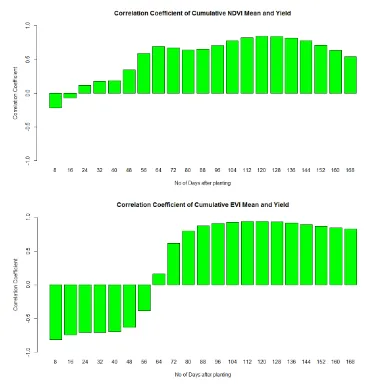
A third yield analysis compared yield and cumulative mean of VI. Cumulative VI mean was calculated for the eight days after the start-of-season. The correlation coefficient of each cumulative VI mean and yield was also calculated. The cumulative VI with highest correlation coefficient was used in a regression analysis of the yield. Figure 12 illustrates how the correlation coefficient changes with cumulative NDVI/EVI and yield. Both NDVI and EVI exhibits a similar pattern of correlation coefficient; both VI are negatively correlated with yield at the start of the season, and then become positively correlated, with high correlation coeffi-cient values.
Regression analysis results of the highest correlation between cu-mulative mean VI and yield are described in Table 6. R2values from linear regression analysis are 0.71 (NDVI) and 0.87 (EVI).
VI Highest CC R2Value
NDVI 0.84 0.71
EVI 0.94 0.88
Table 6: Regression analysis results of highest correlated cumu-lative mean VI with yield
The results of all three yield analyses show that yield has a higher correlation with EVI than NDVI. The R2 values of regression
analysis with yield are 0.95 (for maximum EVI), 0.93 (for flow-ering dates EVI), and 0.88 (for cumulative mean EVI).
The highest correlated EVI was utilized to predict yield for Site 3, which was then compared with actual yield. The most precise
Figure 12: Correlation coefficient changing graph of the Cumu-lative VI mean and yield)
prediction is given by the maximum EVI of the time series, with an average error of 4.21%. The flowering data EVI also give better results (5.62% error) than cumulative mean EVI (10.87%). Figure 13 compares the actual yield with EVI-predicted yield.
Figure 13: Actual yield and predicted yield from EVI by different method in Site 3)
4. CONCLUSION
This study illustrates the significant potential of using MODIS data for rice crop monitoring. MODIS 250m gridded vegetation NDVI and EVI data from both sensors (Aqua and Terra) increase the frequency of observation and improve rice monitoring. The use of the Whittaker smoothing technique, which includes a com-bination of quality assessment data and R program library, is rec-ommended (Atzberger and Eilers, 2011).
The results obtained by this research confirm that there is an observable relationship with rice plant growth and VI changes in rice paddy land cover. MODIS NDVI and EVI rice paddy acreage mapping (using the Threshold method and crop calendar data) gives a minimum of 86% area accuracy and 75% classifica-tion accuracy. Rice crop cultivaclassifica-tion starting month extracted via MODIS NDVI data matched the field data. MODIS NDVI data is better than EVI for rice acreage mapping and start-of-season mapping.
throughout the crop season which indicates the highest correla-tion with yield. Yield was predicted for site 03 with 4.2% error using maximum EVI of the season.
It was proved that time series MODIS 250m vegetation index product data has immense potential for monitoring rice crops. This study shows the usefulness of MODIS gridded vegetation product for the following techniques: (1) mapping rice cultivation area at the province-level, (2) generating an up-to-date database of rice acreage and start-of-season dates, and (3) predicting yield of rice crop before harvesting. Applying this novel methodology for implementing up-to-date GIS rice database is recommended for other areas where rice cultivation is prominent.
ACKNOWLEDGEMENTS
The authors thank Ms. Udompna Promnart of the Prachinburi Rice Research Center, Thailand, whose enormous support made this field work possible. The authors are also grateful for as-sistance from Watthana Nakhon District Agriculture Office staff, and from the village leaders and farmers.
REFERENCES
Atzberger, C. and Eilers, P., 2011. A time series for monitoring vegetation activity and phenology at 10-daily time steps covering large parts of South America. International Journal of Digital Earth4(5/5), pp. 365–386.
Beurs, K. D. and Henebry, G., 2010. Spatio-Temporal Statistical Methods for Modelling Land Surface Phenology. In: Hudson I.L. and M. R. Keatley (eds), Phenological Research, Springer, Netherlands.
Claessens, G., 2013. IRRI’s Rice Production Course. Online.
Didan, K., Solano, R., Jacobson, A. and Huete, A., 2010. MODIS Vegetation Index User’s Guide - Version 2.00.
Jonai, H. and Takeuchi, W., 2012. Development of new water index with modis and amsr-e for global rice paddy field map-ping. In: Proceedings of 34th Asian conference on remote sens-ing (ACRS), AARS.
Kuenzer, C. and Knauer, K., 2013. Remote Sensing of rice crop areas. International Journal of Remote Sensing34(6/12), pp. 2012–2139.
Mattiuzzi, M. and Lobo, A., 2013. Filter vegetation index time series imagery with the modified whittaker approach.
Pringle, M., Denham, R. and Devadas, R., 2012. Identification of cropping activity in central and southern Queensland, Aus-tralia, with the aid of MODIS MOD13Q1 imagery.International Journal of Applied Earth Observation and Geoinformation19, pp. 276–285.
Sakamoto, T., Yokozawa, M., Toritani, H., Shibayama, M., Ishit-suka, N. and Ohno, H., 2005. Remote Sensing of Environment
(3/4), pp. 366–374.
Shao, Y., Taff, G. and Lunetta, R., 2011. A Review of Se-lected MODIS Algorithms, Data Products, and Applications. In: Q. Weng (ed.),Advances in Remote Sensing, CRC Press LLC, Boca Raton, Florida.
Son, N., Chen, C. and Cru, C., 2012. Mapping major cropping patterns in Southeast Asia from MODIS data using wavelet trans-form and artificial neural networks. International Archives Pho-togramm. Remote SensingXXXIX-B3, pp. 421–425.
Xiao, X., Boles, S., Frolking, S., Li, C., Babu, J., Salas, W. and Moore, B., 2006. A crop phenology detection method using time-series modis data.Remote Sensing of Environment96(1), pp. 95– 113.