FIRE MONITORING – THE USE OF MEDIUM RESOLUTION SATELLITES (AVHRR,
MODIS, TET) FOR LONG TIME SERIES PROCESSING AND THE IMPLEMENTATION
IN USER DRIVEN APPLICATIONS AND SERVICES
E.-M. Fuchs a, *, E. Stein a, G. Strunz a, C.Strobl a, C. Frey b a
German Aerospace Center(DLR), Earth Observation Center, German Remote Sensing Data Center, Department Geo-Risks and Civil Security, Oberpfaffenhofen, 82234 Weßling, Germany ([email protected], [email protected],
[email protected], [email protected]) b
German Aerospace Center(DLR), Earth Observation Center, German Remote Sensing Data Center, Department Land Surface, Oberpfaffenhofen, 82234 Weßling, Germany ([email protected])
Commission VI, WG VI/4
KEY WORDS: Fires, Hot Spot Detection, Burnt Area Mapping, Prediction/Early Warning, Time Series, Decision Support Service
ABSTRACT:
This paper introduces fire monitoring works of two different projects, namely TIMELINE (TIMe Series Processing of Medium Resolution Earth Observation Data assessing Long –Term Dynamics In our Natural Environment) and PHAROS (Project on a Multi-Hazard Open Platform for Satellite Based Downstream Services). It describes the evolution from algorithm development from in applied research to the implementation in user driven applications and systems. Concerning TIMELINE, the focus of the work lies on hot spot detection. A detailed description of the choice of a suitable algorithm (round robin approach) will be given. Moreover, strengths and weaknesses of the AVHRR sensor for hot spot detection, a literature review, the study areas and the selected approach will be highlighted. The evaluation showed that the contextual algorithm performed best, and will therefore be used for final implementation. Concerning the PHAROS project, the key aspect is on the use of satellite-based information to provide valuable support to all phases of disaster management. The project focuses on developing a pre-operational sustainable service platform that integrates space-based EO (Earth Observation), terrestrial sensors and communication and navigation assets to enhance the availability of services and products following a multi-hazard approach.
* Corresponding author
1. INTRODUCTION
Vegetation fires are a prominent global phenomena that has a significant impact on a variety of environment, ecosystem and climate functions and structures. Especially the large amounts of smoke emitted from fires impact air quality and affect global warming (Chuvieco, 2009). Therefore, a primary task in climate and environmental modelling is the quantification of fire emissions at regional to global scales. This requires an accurate, reliable, objective, consistent and operational measurement of active fires across space and time. Moreover, historical fire events are of utmost importance to understand terrestrial-atmospheric interactions (Eva and Lambin, 1998). Considering these facts and the remoteness and vast extent of forests at the European continent, earth observation provides an appropriate solution to document fire activities at such scales. Thus, sensor systems like AVHRR (Advanced Very High Resolution Radiometer), MODIS (Moderate Resolution Imaging Spectroradiometer) and MSG-Seviri (Meteosat Second Generation), with a long-term data acquisition period, a spatial resolution suitable for regional-scale studies and spectral capabilities convenient for forest fire detection are necessary to fulfil this goal. AVHRR on board the National Oceanic and Atmospheric Administration`s (NOAA) polar orbiting satellites represents a unique data source, as satellite images are available since 1980. The past developments and the scientific applications are suitable for the implementation of a fire monitoring system for near-real-time applications related to prevention, mitigation and fighting of fires.
This paper emphasizes the use of earth observation data for fire monitoring in two different projects, namely TIMELINE and PHAROS. In the following, both projects and first project results will be described in more detail.
2. THE PROJECT TIMELINE
(i.e. multi-threshold method, contextual method and statistical methods) and tested. In the following strengths and weaknesses, the physics and already applied algorithms of AVHRR for hot spot detection will be explained in more detail.
2.1 Limits of hot spot detection with AVHRR
AVHRR was not actually designed to detect wildfires, but mainly for weather surveillance and sea surface temperature management. Thus, the sensor is not abundantly usable for fire detection, and contains some weaknesses: The contrast between fires and normal earth temperatures is so sharp that, during daytime, not only fires, but also highly reflective soils or sunglint easily saturate channel 3 (Langaas and Muirhead, 1988). The quite low spatial resolution of 1.1 km at nadir means low contextual information. Moreover, the wide scan angle (+/- 55°) causes degradation in spatial resolution up to 2.5 km x 7 km in the scene margins. In addition, no AVHRR specific, but earth observation specific problems concerning active fire detection include obscuration by clouds, contamination of temperatures by clouds (Robinson, 1991), and absorption and reflection of radiant energy from fires by overstorey canopy. Moreover, fires typically manifest a strong diurnal rhythm, varying over time and space. Thus, fire measurements from a sensor platform with a fixed hour of observation may have strong biases that are difficult to eliminate.
Nevertheless, NOAA-AVHRR offers suitable possibilities for wildfire detection. It encompasses several wavelengths important for fire detection (Li et al., 1997), provides the longest time-series available, and exhibits an appropriate relation between coverage and spatial resolution.
2.2 Physics of hot spot detection
Emissions of active fires vary from 500 K for smoldering fires to about 1200 K for flaming fires (Kennedy et al., 1994). According to Wien`s displacement law, the radiation peak from objects emitting at these temperatures is around 2-6 µm. Therefore, AVHRR channel 3 is suitable to detect fires. Moreover, in the middle-infrared, fires radiate intensely (to about 1500 times) against a low-energy background. Thus, fires occupying just a small part of a pixel can be detected. AVHRR channel 4 is much less sensitive to such temperatures (to about 45 times) than channel 3, and is not affected by solar reflection. For this reason differences in brightness temperature between channel 3 and 4 can be used to avoid false alarms due to highly reflective soils, naturally warm surfaces and sun glint (Kaufman et al., 1990).
2.3 Developed algorithms for hot spot detection with AVHRR
Due to the limited extent of this paper, just a selection of literature can be given. Considering the long time availability of AVHRR, forest fires in various biomes and landscapes have been investigated, e.g. tropical forests (Eva and Flasse, 1996, Justice et al., 1996, Kaufman et al., 1990, Malingreau et al., 1985, Pereira and Setzer, 1993), boreal areas (Cahoon et al., 1994, Chung and Lee, 1984, Boles and Verbyla, 2000, French, 1995, Kasischke and French, 1995, Li et al., 2000, Rauste et al., 1997, Soja et al., 2004), straw burning (Cracknell and Saradjian, 1996, Muirhead and Cracknell, 1985, Saull, 1986), savannahs (Kennedy et al., 1994, Langaas and Muirhead, 1988, Pereira and Setzer, 1996) and the Mediterranean (Chuvieco and Martin, 1994, Fernández et al., 1997, Illera et al., 1995). Various different methods for hot spot detection have been
developed. First, methods relied on the detection capabilities of channel 3 (Chuvieco and Martin, 1994, Dozier, 1981, Pereira and Setzer, 1993). Afterwards multi-threshold algorithms have been developed, which are based on the definition of empirical thresholds for decision tests (Arino and Melinotte, 1998, Dowty, 1996, Kaufman et al., 1990, Kennedy et al., 1994, Li et al., 2000, Pereira and Setzer, 1993, Pozo et al., 1997, Rauste et al., 1997). Moreover, contextual algorithms which exploit the strong temperature contrast among hot fire pixels and its cold background by calculating spatial statistics (e.g. average values and standard deviation) within variable sized windows around candidate fire pixels have been developed (Boles and Verbyla, 2000, Eva and Flasse, 1996, Fernandez et al., 1995, Flasse and Ceccato, 1996, Giglio et al., 1999, Harris, 1996, Justice et al., 1996, Ressl et al., 2009, Soja et al., 2004, Stroppiana et al., 2000). In addition, various other methods relying on statistical approaches applied to historical satellite records have been developed (Cuomo et al., 2001, Kalpoma and Kudoh, 2006, Kudoh and Noguchi, 1991, Pergola et al., 2004).
In order to find the most suited method, a round robin approach has been applied. Thus, a basic form of two different methods without any enhancements (e.g. sun glint rejection, viewing geometry, etc.), namely the multi-threshold and the contextual algorithm, have been implemented and tested. The examination of statistical approaches which require the processing of large amounts of pre-scenes of the actually studied scene was not feasible given the actual processing environment of the TIMELINE system.
2.4 Study areas and data set
Europe offers a high diversity of ecosystems with tundra, alpine tundra, taiga, montane forest, temperature broadleaf forest, Mediterranean forest and temperate steppe. The main natural vegetation cover is mixed forest. With the exception of the Far East coast, precipitation decreases to the north and east. Thus, whilst western Europe has an oceanic climate, eastern Europe has a drier, continental climate. Parts of the central European plains have a hybrid oceanic/continental climate. The Mediterranean Basin is influenced by a warm maritime climate, with wet and mild winters and dry and hot summers. In order to perform the round robin approach, different regions all over European i.e. Spain, Portugal, Baltic, North Africa, central Europe, Italy and Scandinavia, and different seasons have been selected. Finally, twenty subsets of AVHRR images have been analyzed.
Hot Spots derived by MODIS (MOD-14A2) Aqua and Terra have been chosen as evaluation layers for the AVHRR derived products. The MODIS active fire product is internationally acknowledged and successfully validated for various biomes (Csiszar et al., 2006, Morisette et al., 2005).
2.5 Round Robin approach
2.5.1 Multi-Threshold: A fully automated multi-threshold algorithm has been implemented in the Interactive Data Language (IDL). First, water and cloud pixels have been masked out using preliminary water and cloud products available within the TIMELINE project. Afterwards, different thresholds for the mid-infrared channel (ch3), and the difference of ch3 and channel 4 (ch4) (thermal-infrared) have been investigated. Brightness temperature (Tb) values in an interval of two degrees from 310 K to 320 K have been used, which resulted in following codomain:
Tb (ch3) > x (1)
IW:=[310;320] = x ∈ {310, 312, 314, 316, 318, 320}
These threshold values have been chosen according to information from literature (Arino and Melionotte 1998, Boles and Verbyla 2000, Chuvieco and Martin 1994, Giglio et al. 1999, Li et al. 2000) and the saturation capabilities of ch3, which varies from 320,5 (AVHRR-2 onboard NOAA-07) to 322,0 (AVHRR-2 onboard NOAA-09) (Csiszar and Sullivan 2002). To eliminate false alarms due to highly reflective soils, difference values of ch3 and ch4 have been added. By literature review (Arino and Melinotte 1998, Boles and Verbyla 2000, Kennedy et al. 1994, Li et al. 2000), values ranging from 10 K to 16 K have been chosen. Again, an interval of two degrees has been used, which resulted in following codomain:
Tb (ch3) > Tb (ch4) + y (2)
IW:=[10;16] = y ∈ {10, 12, 14, 16}
2.5.2 Contextual: A fully automated contextual algorithm has been implemented in the Interactive Data Language (IDL). First, water and cloud pixels have been masked out. Afterwards, different thresholds for ch3 have been investigated. In order to detect smaller and cooler fires, the brightness temperature (Tb) thresholds are lower than the values for the multi-threshold algorithm, and lie between 310 K and 311 K (Eva and Flasse 1996, Flasse and Ceccato 1996, Giglio et al. 1999, Nakayma et al. 1999, Ressl et al. 2009, Stroppiana et al. 2000). Both values have been tested:
Tb (ch3 ) > x (3)
IW:=[310,311] = x ∈ {310, 311}
Similar to the multi-threshold algorithm, false alarms are avoided by using a fixed threshold in the difference of ch3 and ch4. The codomain was evaluated by literature review (Eva and Flasse 1996, Flasse and Ceccato 1996, Giglio et al. 1999, Ressl et al. 2009, Stroppiana et al. 2000) and resulted in following values:
Δ[Tb(ch3) – Tb(ch4)] > y (4)
IW:=[6,12] = y ∈ {6, 8, 10, 12}
If a pixel fulfils both requirements, it is declared as a potential fire pixel. Fire pixels are hotter than their neighbouring pixels. Thus, a moving window was implemented which calculates the mean values and the mean standard deviation values of the neighbourings of a potential fire pixel. The window is called moving window, because it grows from a 3x3 pixel window to a
15x15 pixel window until it contains 25 % or at least 3 valid pixels. A valid pixel is a pixel which is not classified as a potential fire, as water or as cloud. A potential fire gets classified as fire, if it fulfills following requirements:
Tb(ch3) > Tbg(ch3) + 2 Tbg σ (ch3) + 3K (5)
[Tb(ch3) - Tb(ch4)] > Tbg(ch3-ch4) + 2 Tbg σ (ch3-ch4) (6)
Where:
Tbg(ch3) = mean value of Tb(ch3) in the moving window
Tbg σ (ch3) = mean value of the standard deviation of Tb(ch3) in the moving window
Tbg(ch3-ch4) = mean value of Tb(ch3) - Tb(ch4) in the moving window
Tbg σ (ch3-ch4) = mean value of the standard deviation of Tb(ch3) - Tb(ch4) in the moving window
In literature, the threshold value between a potential fire pixel and its background pixels (term (5)) is constantly set to 3 K (Eva and Flasse 1996, Flasse and Ceccato 1996, Nakayma et al. 1999, Ressl et al. 2009, Stroppiana et al. 2000). Thus, no other values have been tested. If not enough valid background pixels could be found (valid pixels < 25 %), the potential fire pixel is classified as no fire.
2.6 Evaluation of Round Robin
Hot Spots derived by MODIS have been chosen as evaluation layers for the AVHRR derived products. For validation, the closest possible MODIS scene has been selected. Sensor inherent errors (e.g. geometrical displacement) have been considered by putting a conservative buffer around each MODIS fire pixel. A buffer of five kilometers has been chosen, because this represents the rounded multiple of the square root of an AVHRR pixel. It has to be considered that the MODIS product itself contains limitations and weaknesses, is available twice a day, and with different acquisition times in comparison to AVHRR. The results of the multi-threshold and contextual algorithm have been evaluated three-fold:
a) Number of misclassified AVHRR-pixel within the study area,
b) Number of correct classified AVHRR-pixel within the 5 kilometer buffer around a MODIS reference pixel,
c) Ratio between (a) and (b)
pixels for the most suited threshold was 792:1 for the multi-threshold algorithm, and 33:1 for the contextual algorithm. This clearly demonstrates the dominance of the contextual algorithm, which is finally chosen for further implementation. Nevertheless, a ratio between misclassified and correct fire pixels of 33:1 is not satisfying. Thus, various enhancements (e.g. sun glint rejection, using land use/ land cover information, taking viewing geometry into account, using enhanced cloud and water products, etc.) will be added to the final algorithm.
3. THE PROJECT PHAROS
The foundations for Copernicus services have been established in the recent years together with significant developments in the deployment of Earth Observation (EO) infrastructure. As a result, a number of initiatives provide service concepts focusing on rapid mapping based on Copernicus data and enhanced situational awareness by combining the processed Copernicus data with modelling to elaborate forecasts and retrospective assessments for decision making support. Other systems integrate Decision Support Services for specific types of disasters and geographical locations. However, potential synergies between satellite-based Earth observation, communication and navigation are not yet fully exploited in the area of disaster management. In this context, the FP7 funded project PHAROS is aimed at designing and implementing an innovative, flexible and scalable multi-hazard open service platform which integrates space-based observation, satellite communications and navigation (Galileo/GNSS) assets to provide sustainable services for a wide variety of users in multi-application domains, such as risk preparedness and mitigation, prediction and early detection of emergencies, population alerting and environmental monitoring, targeting several users, such as authorities and crisis managers (primary users) and non-institutional users, such as insurance companies and research groups (secondary users). The project started in December 2013 and has duration of 30 months. (Parraga Niebla et al. 2014). Orchestrated by a software mediation platform, PHAROS will integrate data from EO satellites and in-situ sensors, process it and provide the results to a series of key services for disaster management in its different phases, such as risk and threat simulation tools, decision support services and public alert systems. In this context, PHAROS will provide an innovative pre-operational service platform that is capable to integrate different satellite assets. The implementation of the service platform will be focused on the forest fire case and includes the following core components:
Decision Support Services (DSS): this includes information fusion, situation assessment, Common Operational Picture (COP) and decision support.
Simulation and Modelling Services (SMS): based on the forest fire simulation capabilities of Tecnosylva’s Wildfire Analyst calculation of the forest fire spread, the behaviour, the evacuation time, and the impact analysis during an incident and risk/threat simulations (Ramirez et al. 2011).
Alert Gateway: alert message dispatcher to warn the population through communications systems when required (Parraga Niebla et al. 2013).
Processors and services: to detect fire hotspots and risk or affected area out of EO and in-situ sensor data
and to produce rapid-mapping information for the user.
According to the different components of the PHAROS system this paper presents in detail the outcome of the fire monitoring and the hotspot detection, which serve as the input for the simulation and modelling services. These domains are early detection of risks and emergencies, environmental monitoring, risk and crisis management and population alerting. As the pilot application the implantation was chosen for the Spanish Province of Catalonia. In this region all the products, services and tools developed during the project will be illustrated by a pilot demonstration at the end of project (March 2016). This will be performed during a forest fire as this kind of incident is large enough to be visible by different sources,
The implementation of the EO-Services base on the different phases of the disaster management cycle:
1) Fire hotspots (thermal anomalies) are used during the detection and immediate response phase as input for the PHAROS Simulation Service. These hot spots are derived automatically and in near real time (NRT) from MODIS and MSG data. The MODIS data are available in a high (1d) temporal and in a medium (250m – 1000m) spatial resolution. The MSG data are available in a very high (1h) temporal and in a low (<1000m) spatial resolution. These EO data services are running outside of the Pharos system as external services and are available via OGC service interfaces.
2) EO (high spatial resolution) images, thematic products (burnt scars) and maps are used for the recovery, mitigation and preparedness phase. The data are available in a high (< 30m) to very high spatial resolution (< 2.5m) and in a medium to low temporal resolution (> 1d). Products and maps based on these data must be generally manually created and require high expert knowledge. For the implemented short term approach of the project, a limited implementation will be provided for demonstration purposes. On the long term run these products will be created on demand (in the case of a fire emergency activation or for pre- and post-operational purposes, e.g. forest inventory regarding fuel capacity, change detection, seasonal variations).
3.1 Hot Spot detection
3.1.1 MODIS: For the detection of high temperature events (HTE) the MOD14 algorithm is used. The algorithm is based on the shift of radiances to shorter wavelengths (middle infrared) with an increasing surface temperature. MOD14 is well documented and tested in operational services and guarantees comparability and reproducibility as well as a standardized international acknowledged product (Giglio 2010, Morissette et al. 2005). The thermal information is collected at 1000 m spatial resolution twice daily by each sensor (Terra and Aqua) providing up to four thermal observations daily. The MODIS images used for fire detection are acquired from two direct broadcast receiving stations from DLR located in Oberpfaffenhofen and Neustrelitz.
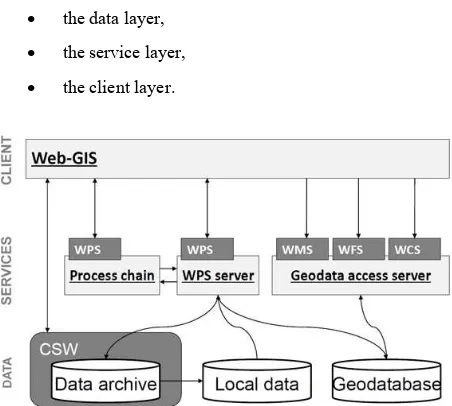
the data layer, the service layer, the client layer.
Figure 1. Technical schema of the implemented system
The data layer describes the different data sources: the external remote sensing data archive, the local data for processing and the geodatabase of products created for publishing. A catalogue service interface (CSW) establishes a connection to the metadata catalogue of the archive. Processing and data access services are communicating with the data layer. The central component is a web processing service (WPS), which communicates with the data archive and the local WPS data directory to process this data and publishes the finally derived products in the geodatabase. In the “Local data” directories, the files created by the executed process are stored. A service for executing processing chains communicates with the WPS and the geodata access service communicates with the geodatabase. These services provide interfaces like OGC WMS (Web Map Service), WFS (Web Feature Service), WCS (Web Coverage Service) and WPS, so that a client can work with these data using OGC compliant services. The services can be implemented in the PHAROS system through any OGC compatible Web GIS or any GIS Desktop software like e.g. uDig, ESRI ArcMap, Quantum GIS. For the web-based processing, OGC specifies the Web Processing Service (Open Geospatial Consortium 2007). This specification describes an interface for publishing processes on the web. WPS provides three methods: “GetCapabilities”, “DescribeProcess” and “Execute”. For the implementation of the OGC WPS standards the Python-based software PyWPS in an Apache Webserver is used (Cepicky 2011). The output of the WPS is the provision of a WFS with the location of the hot spots in near-real time for Europe and surrounding countries, including information about:
Latitude and longitude, Administrative boundaries,
Vegetation and land cover (Corine land cover, 100 m resolution and Global Land Cover, 1000 m product),
Brightness temperature, Confidence level,
FRP (Fire Radiative Power).
Next to the integration of the WFS in the PHAROS service platform the established service is available at
http://www.zki.dlr.de/services/fire/modis/map. This visualisation based on a WMS which is provided through an API based on the GeoServer. This API gives the possibility to add new layers on GeoServer by using the HTTP REST interface. The interface allows the client to transfer the generated output data (vector or raster data) to GeoServer and display it on the fly in a map. Therefore, spatial output data can be displayed directly after processing in the web-based processing client (Eberle et al. 2011, Eberle and Strobl 2012).
3.1.1 MSG-Seviri: In order to PHAROS requirements the MODIS hot spot detection service will be enhanced with the integration of other satellite missions. The most advantages can be achieved by using a geostationary satellite. On the one hand, the service will provide hot spots in a high temporal resolution (up to 15 minutes) and on the other hand, fires during the night will be detected as well.
The Seviri Sensor (Spinning Enhanced Visible and Infrared Imager) is installed on MSG-1 and 2 (Meteosat Second Generation satellite) platforms and covers Europe and northern Africa. The Seviri Sensor provides data in 12 different wavelengths within the visible to infra-red spectrum and with a pixel size of 1 km for the high resolution visible channels, and up to 3 km for the infrared channels. Accordingly to MODIS, the active fire detection uses the shift of the peak emission and the increased sensitivity to temperature changes to detect high temperature events within a pixel. For a surface at a brightness temperature around 300 K the spectral radiance peaks is at a wavelength around 10 µm. The peak wavelength decreases as the brightness temperature increases. The algorithm detects hot spots by a combination of threshold tests using band 9 (3.8 micron) and band 14 (10.5 micron) (Amraoui et al. 2010). In comparison to MODIS the DLR does not directly receive the MSG-Seviri data in near real time. In order to use the EUMETSAT (European Organisation for the Exploitation of Meteorological Satellites) near real time processing service, this service will fetch up the derived hot spots (5 minutes after the data acquisition) and will provide the information through the presented processing chain (cf. section 3.1.1) to the PHAROS service platform (Eumetsat 2010).
3.2 EO data, thematic products and maps
The provided EO Data Processor (Figure 2) gives the possibility to use EO data (satellite and airborne based) and its derived products in the service platform and in the following services/systems (SMS and DSS).
Figure 2. The EO Data Processor within the PHAROS Architecture
The EO data and derived data products will be provided with INSPIRE/OGC compliant services (WMS/WFS/WCS/CSW) through the EOC Geoservice of the Earth Observation Center (EOC) of DLR (Dengler et al 2013).
DLR science service data access (TerraSAR-X Mission and FireBird Mission). The data records primarily encompass high resolution (HR) and very high resolution (VHR) satellite images. A set of the following satellite images will be provided for the pilot area:
Landsat 7, 8 RapidEye
FireBird (TET/BIROS) Spot 5/6/7
Worldview-2, -3 TerraSAR-X
The services described in this chapter will not be provided automatically. Instead, they must be triggered and pre-processed and analysed. In the case of the PHAROS project, this service will be performed once during and in preparation of the project pilot demonstration through the services of the DLR-ZKI (Center for Satellite-Based Crisis Information) and will be further realised for the Target System.
In the course of the monitoring process in preparation of the pilot demonstration, a satellite data archive will be compiled for the pilot area.
3.2.1 Thematic products: Based on the EO images, the following thematic layers will be produced:
Burnt scars, Fire locations, Affected population.
The listed thematic products will be derived using semi-automatic algorithms, which are explained in the following. Burnt scars
The burnt scars describe the area affected by the fire. Optical satellite data are preferably used for burned area detection, due to their ability to detect forest fires in the near and middle infrared, their high interpretability and information content. At DLR-ZKI the software tool RaMaFire (Rapid Mapping Fire Tool) was developed. This is used operationally for the automatic or semi-automatic detection of burnt scars using optical as well as SAR data. The optical part of the algorithm uses a fuzzy classification approach based on different index calculation such as BAI (Burnt area index) in single-temporal approaches or temporal differences in multi-temporal images. If clouds, cloud shadows or smoke plumes of active fires preclude the burnt area detection in optical images, SAR image can be considered. The SAR burnt area detection uses different change detection techniques and a fuzzy classification approach. The simultaneous use of both measurements potentially allows all-weather burnt area detection (Bernhard et al. 2011).
Fire locations
The assignment of the fire location is similar to the automatic hot spot detection (cf. section 3.1). For EO images with bands in the middle infrared - MIR (about 3.9 microns) an automatic detection will be used (like Landsat and TET/BIROS). In the absence of the MIR a manual derivation through visual interpretation is necessary.
Affected population
Population living in physically affected extent of burnt scars. The calculation of the affected population depends on the available population data sets (Global Urban Extent or Landscan). In general, this thematic product is an intersection
of population layers and the burnt scars and gives references about the distribution of the affected population.
3.2.2 Maps:
Through the combination of EO images and the thematic layers, thematic maps of the post disaster situations can be produced. The process is similar to the production of thematic layers and requires manual input; therefore it is considered primarily for the pilot demonstration and the long term approach. Thereby the following maps will be provided:
Geographic Reference Map Fire Extent Map
Damage Assessment Map Fire Monitoring Map
3.3 Outlook of the project PHAROS
Due to the presented work in the PHAROS project the following points can be concluded: The scientific applications and the development of EO images to support disaster management, particular the emergency response through the hot spot detection, show the advantages of the use of remote sensing. The section 3 described the design and the implementation of the MODIS hot spot detection service. The design of the system architecture was developed in 3 modules to integrate further services. Based on the PyWPS and the Apache Webserver technology the WPS was implemented to handle the large raster data. The generation of the output is done by the HTTP-REST (API of GeoServer) to provide an OGC compatible WMS. Besides the automatic services high resolution images, thematic products and maps are provided for the pilot demonstration. The maps provide valuable information for the disaster preparedness and mitigation as well as the emergency response and post-disaster monitoring with information about the fire locations, the burnt scars and the affected population. The presented EO services can be expanded or supplemented throughout the duration of the project by other European services. In order to generate the Hot Spots data we can draw on the European Forest Fire Information Service (EFFIS). Regarding the manual production of secondary products (thematic layers) and map production, the ZKI-Service as well as the Copernicus EMS Services is suitable. Moreover, the integration of Sentinel -1 and -2 data in the EO services is considered. Especially for the pilot demonstration the Sentinel data will increase data availability and diversity and therefore support crisis evaluation and management. Next to the implementations of the shown services a scientific evaluation of the MODIS and MSG-Seviri hot spots with reference data (like in-situ data and other satellite based information) is in process. After the final enhancements and the validation of the AVHRR-hot spot detection algorithm the improvement of the PHAROS platform with the AVHRR hot spots is designated.
4. ACKNOWLEDGEMENTS
REFERENCES
Amraoui, M., DaCamara, C. C., Pereira, J.M.C., 2010. Detection and monitoring of African vegetation fires using MSG-SEVIRI imagery, Remote Sensing of Environment., 114, pp. 1038-1052.
Arino, O., Melinotte, J. 1998. Cover The 1993 Africa Fire Map, International Journal of Remote Sensing, 19(11),pp. 2019-2023.
Bernhard, E.M, Twele, A., Gähler, M., 2011. Rapid Mapping of Forest Fires in the European Mediterranean Region – a Change Detection Approach Using X-Band SAR-Data, Photogrammetrie, Fernerkundung, Geoinformation (PFG), 4, p. 261-270.
Boles, H., Verbyla, D., 2000. Comparison of Three AVHRR-Based Fire Detection Algorithms for Interior Alaska, Remote Sensing of Environment, 72, pp. 1-16.
Cahoon, D., Stocks, B., Levine, J., Cofre, W., Pierson, J., 1994. Satellite analysis of the severe 1987 forest fires in Northern China and Southeastern Siberia, Journal of Geophysical Research, 99, pp. 18627- 18638.
Cepicky, J. 2011. Welcome to pyWPS”, available at: http://pywps.wald.intevation.org/ (15. Feb. 2015).
Chung, Y., Le, H., 1984: Detection of fire smoke plumes by satellite imagery, Atmospheric Environment, 18, pp. 2143-2151.
Chuvieco, E., Martin, P., 1994. Global fire mapping and fire danger estimation using AVHRR images, Photogrammetric Engineering and Remote Sensing, 60, pp. 563-570.
Chuvieco, E., 2009. Global impacts of fire, Springer, pp. 1-11.
Cracknell, A., Saradjian, M., 1996. Monitoring of straw burning in the U. K. using AVHRR data - summer 1995, International Journal of Remote Sensing, 17(12), pp. 2463-2466.
Csiszar, I., Morisette, J., Giglio, L., 2006. Validation of active fire detection from moderate resolution satellite sensors: The MODIS example in Northern Eurasia, IEEE Transactions on Geoscience and Remote Sensing, 44(7), pp. 1757-1764.
Csiszar, I., Sullivan, J., 2002. Recalculated pre-launch saturation temperatures of the AVHRR 3.7 sensors on board the TIROS-N to NOAA-14 satellites, International Journal of Remote Sensing, 23(24), pp. 5271-5276.
Cuomo, V., Lasaponara, R., Tramutoli, V., 2001. Evaluation of a new satellite-based method for forest fire detection, International Journal of Remote Sensing, 22(9), pp. 1799-1826.
K. Dengler, K.,. Heinen, T., Huber, A., Molch, K., Mikusch, E., 2013. The EOC Geoservice: Standardized Access to Earth Observation Data Sets and Value Added Products, PV November. 2013, Frascati, Italy.
Dowty, P., 1996. The simulation of AVHRR data for the evaluation of fire-detection techniques, In: Biomass Burning and Global Change, Levine, J., (Ed.), (MIT Press: Cambridge, Massachusetts), pp. 25-39.
Dozier, J. 1981. A method for the satellite identification of surface temperature fields of subpixel resolution, Remote Sensing of Environment, 11, pp. 221-22.
Eberle. J., Strobl, C., 2012. WEB-Based Geoprocessing and Workflow Creation for Generating and Providing Remote Sensing Products, Geomatica, Volume 66, pp. 13-26.
Eberle, J., Strobl, C., Schmullius, C., 2011. Processing chains with OGC Web Processing Services to process satellite data interactively in a geoportal. In: Proceedings of the Free and Open Source Software for Geospatial (FOSS4G), Denver, CO, USA, 2011.
EUMETSAT, 2010. Active Fire Monitoring – Factsheet, Doc.No. EUM/OPS/DOC/09/5159, v1, 2010.
Eva, H., Lambin, E. 1998. Burnt area mapping in Central Africa using ATSR data, International Journal of Remote Sensing, 19(3), pp. 473-497.
Fernández, A. Iller, P. Delgado, J., Calle, A., 1995. A system for operational fire monitoring using AVHRR images, the 1995 Meteorological Satellite Data Users`Conference, EUMETSAT, Darmstadt, Germany, EUM P17, pp. 123-130.
Flasse, S., Ceccato, P., 1996. A contextual algorithm for AVHRR fire detection, International Journal of Remote Sensing, 17(2), pp. 419-424.
Giglio, L., Kendall, J., Justice, C., 1999. Evaluation of global fire detection algorithms using simulated AVHRR infrared data, International Journal of Remote Sensing, 20(10), pp. 1947-1985.
Giglio, L. “MODIS Collection 5 Active Fire product User’s Guide, Version 2.4”. Science Systems and Applications, Inc., University of Maryland, Department of Geography, 2010.
Harris, A., Rothery, D., Carlton, R., Langaas, S., Mannstein, H., 1995. Non-zero saturation of AVHRR thermal channels over high temperature targets: Evidence from volcano data and a possible explanation, International Journal of Remote Sensing, 16, pp. 189-196.
Illera, P., Fernandez, A., Delgado, J., 1995. Fire monitoring in Spain using NOAA thermal data and NDVI, Sensors and Environmental Applications for Remote Sensing, (Asken, Ed), Balkema, Rotterdam, pp. 377-383
Justice, C., Kendall, J., Dowty, P., Scholes, R., 1996. Satellite remote sensing of fires during the SAFARI campaign using NOAA advanced very high resolution radiometer data, Journal of Geophysical research, 101(23), pp. 823-851(863)
Kasischke, E., French, N., 1995. Locating and estimating the area extent of wildfires in Alaskan Boreal forests using multiple-season AVHRR NDVI composite data, Remote Sensing of Environment, 51, pp. 263-275.
Kaufman, Y., Tucker, C., Fung, I., 1990. Remote Sensing of biomass burning in the tropics, Journal of Geophysical Research, 95(D7), pp. 9927-9939.
Kennedy, P., Belward, A., Gregoire, J., 1994. An improved approach to fire monitoring in West Africa using AVHRR data, International Journal of Remote Sensing, 15(11), pp. 2235-2255.
Kudoh, J. Noguchi, S. 1991. A study of three-dimensional histogram using the NOAA AVHRR images, IEEE TGRS, 29, pp. 736-741.
Langaas, S., Muirhead, K., 1988. Monitoring bush fires in west Africa by weather satellite, In: Proceedings of 22nd International Symposium on Remote Sensing of Environment, Abidjan, Cote d`Ivoire, 20-26. October 1988, (Ann Abor, MI: ERIM), 2, pp. 253-268.
Lee, T., Tag, P., 1990. Improved detection of hotspots using the AVHRR 3.7 µm channel, Bulletin of the American Meteorological Society, 71, pp. 1722-1730.
Li, Z,. Nadon, S., Cihlar, J., 2000: Satellite-based detection of Canadian boreal forest fires: development and application of the algorithm, International Journal of Remote Sensing, Vol, 21, No. 16, pp.3057-3069
Malingreau, J., Stephens, G., Fellows, L., 1985. Remote sensing of forest fires: Kalimantan and North Borneo in 1982-1983, Ambio, 4(6), pp. 314-321.
Matson, M., Dozier, J., 1981. Identification of subresolution high temperature sources using a thermal IR sensor, Photogrammetric Engineering and Remote Sensing, 47, pp. 1311-1318.
Morisette, J., Giglio, L., Csiszar, I., Justice, C., 2005. Validation of the MODIS active fire product over Southern Africa with ASTER data, International Journal of Remote Sensing, 26, pp. 4239-4264.
Muirhead, K., and Cracknell, A., 1985. Straw burning over Great Britain detected by AVHRR, International Journal of Remote Sensing, 6, pp. 827-833.
Open Geospatial Consortium (OGC), 2007. OpenGIS Web
Processing Service, available at: http://portal.opengeospatial.org/files/?artifact_id=24151 (31 . Jan. 2015).
Parraga Niebla, C., Mulero Chaves, J., Raape, U., Mendes, M. A. I., Campo, R., Muna, J., Gardikis, G., Van Setten, W., Vilalta, O., Podolski, H., 2014. Integrating Satellite Communication, Navigation and Earth Observation to Achieve a Multi-Hazard Platform for Disaster Management: the PHAROS Platform. In: Ka and Broadband Communications, Navigation and Earth Observation Conference. October. 2014, Vietri sul Mare / Salerno, Italy.
Parraga Niebla, C., Muna, J., Grazzini, S., Pfeffer, R., 2013. A complete communication framework for public alert: the Alert4All approach. In: TIEMS International Conference on Public Alert and Social Media during Crisis and Disasters. TIEMS International Conference on Public Alert and Social Media during Crisis and Disasters, October. 2013, Berlin, Germany.
Pereira, M., Setzer, A., 1993. Spectral characteristics of deforestation fires in NOAA/AVHRR images, International Journal of Remote Sensing, 14(3), pp. 583-597.
Pereira, A., Setzer, A., 1996. Comparison of fire detection in savannas using AVHRR`s channel 3 and TM images, International Journal of Remote Sensing, 17(10), pp. 1925-1937.
Pergola, N., Marchese, F., Tramutoli, V., 2004. Automated detection of thermal features of active volcanoes by means of infrared AVHRR records, Remote Sensing of Environment, 93, pp. 311-3276.
Pozo, D., Olmo, F., Alados-Arboledas, L., 1997. Fire detection and growth monitoring using a multitemporal technique on AVHRR mid-infrared and thermal channels, Remote Sensing of Environment, 60, pp. 111-120.
Ramírez, J., Santiago Monedero, S., Buckley, D., 2011. Wildfire Analyst: practical approach to operational wildfire simulation. In: 5th Wildfire Conference, Sun City, South Africa, 2011.
Rauste, Y., Herland, E., Frelander, H., Soni, K., Kuoremaki, T., Roukari, 1997. Satellite-based forest fire detection for fire control in boreal forests, International Journal of Remote Sensing, 18, pp. 2641-2656.
Ressl, R., Lopez, G., Cruz, I., Colditz, R, Schmidt, M., Ressl, S., Jiménez, R., 2009. Operational active fire mapping and burnt area identification applicable to Mexican Nature Protection Areas using MODIS and NOAA-AVHRR direct readout data, Remote Sensing of Environment, 113, pp. 1113-1126.
Robinson, J., 1991. Fire from space: Global fire evaluation using infrared remote sensing, International Journal of Remote Sensing, 1991, Vol.12, No.1, pp. 3-24.
Saull, R., 1986. Straw burning over Great Britain detected by AVHRR: A comment, International Journal of Remote Sensing, 7, pp. 169.
Soja, A., Sukhinin, A., Cahoon, D., Shugart, H., Stackhouse, P., 2004. AVHHR-derived fire frequency, distribution and area burned in Siberia, International Journal of Remote Sensing, Vol. 25, No. 10, pp. 1939-1960.