UPDATING NATIONAL TOPOGRAPHIC DATA BASE
a Survey of Israel, {eran, felus, tal}@mapi.gov.il
b Mapping Solutions Ltd., {zilberstein.ofer, yorame}@gmail.com ;
WG VII/5
Key Words: NTDB (National topographic data base), Segmentation, Classification, DSM, DTM
ABSTRACT:
The traditional method for updating a topographic database on a national scale is a complex process that requires human resources, time and the development of specialized procedures.In many National Mapping and Cadaster Agencies (NMCA), the updating cycle takes a few years. Today, the reality is dynamic and the changes occur every day, therefore, the users expect that the existing database will portray the current reality. Global mapping projects which are based on community volunteers, such as OSM, update their database every day based on crowdsourcing.In order to fulfil user's requirements for rapid updating, a new methodology that maps major interest areas while preserving associated decoding information, should be developed.
Until recently, automated processes did not yield satisfactory results, and a typically process included comparing images from different periods. The success rates in identifying the objects were low, and most were accompanied by a high percentage of false alarms. As a result, the automatic process required significant editorial work that made it uneconomical. In the recent years, the development of technologies in mapping, advancement in image processing algorithms and computer vision, together with the development of digital aerial cameras with NIR band and Very High Resolution satellites, allow the implementation of a cost effective automated process. The automatic process is based on high-resolution Digital Surface Model analysis, Multi Spectral (MS) classification, MS segmentation, object analysis and shape forming algorithms. This article reviews the results of a novel change detection methodology as a first step for updating NTDB in the Survey of Israel.
1. INTRODUCTION 1.1. Motivation
In recent years, an innovative approach was developed and implemented for change detection. This approach is based on advanced R&D activities were carried out to automatically update the NTDB (National Topographic Data Base) in Israel. These activities indicate a feasible and economical process with large scalability capable of detecting changes for updating the NTDB.
1.2. General
The literature presents many methods to detect changes automatically for updating a topographic database. Some of the methods reviewed were based on the comparison of satellite and aerial imagery, and in some cases the methods are based on the comparison of elevation models from different periods (Im et al, 2008).However, these methods provided low success rate for several reasons:(1) the difficulty of combining basic historical data which was collected using traditional methods (photogrammetry and ground measuring); (2) the difficulty of not reflecting any change between images from different periods in the database; (3) the difficult of filtering the vast number of changes that do not require an update, that arise due to differences lighting conditions, or different seasons, or temporary entities (such as - vehicles), the state of vegetation etc.
An alternative approach is to directly compare imagery to the topographic database. The simplest way to implement this is through the classified image and using a direct comparison between the classification results and topographic map to identify changes. Several authors reported promising results by using these methods (e.g. Matikainen et al 2010, Le Bris & Chehata, 2011). The object based approach resulted in better performance the previous approach which was based on a
comparison between the images based on the smallest entity - pixel (pixel based approach). Using object-based approach and object-based image analysis tools the process employs object's texture, shade, shape, orientation, and other criteria that provide significantly more accurate classification than the pixel-based approaches (Baltsavias 2004).
Several commercial software programs utilize advanced algorithms in the fields of imagery classification, segmentation, change detection etc. (such as eCognition®, Erdas®). However, integration of these tools in national mapping agencies does not fulfill all the requirements. Therefore, national mapping agencies usually develop supplementary implementations to commercial software. In 2008, the ARMURS (Automatic Recognition for Map Update by Remote Sensing) project was launched by the European research program framework, to create automatic updating process of topographic database using remote sensing tools. A major product of this project is open source library OTB (Orfeo toolbox). This library provides tools for image analysis and processing. The presented project implemented the OTB library software code in the Survey of Israel processes.
1.3. Case Studies
The input data for the proposed process consists of the following:
Area Ortho GSD [cm] Elevation Data GSD [cm]
A 25 50
B 50 50
Table (1) – case studies data
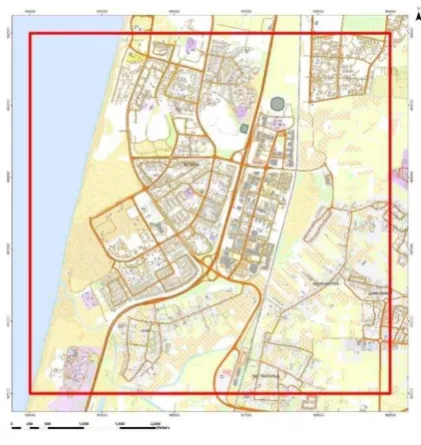
Figures (1a), (1b) and (1c) describe the case studies:
Figure (1a) – case studies areas
Area (A) is mostly urban and rural areas, which includes also farmland and bare soil.
Figure (1b) –area A from Table (1)
Area (B) is mostly rural areas with farmland and bare soil. At both areas, we used ortho rectified imagery, which was taken with Z/I DMC II (140 megapixel) digital mapping camera.
Figure (1c) –area B from table (1)
2. METHODOLOGY
Figure (2) display the process layout:
Figure (2) – the change detection proposed metodolgy
2.1. Remote Sensing Procedures
being filtered. The indexes are calculated according to formulas 1 and 2 respectively:
� = − �+ �
� = �� − �+ �
In order to differentiate between on-ground and lifted regions nDSM (normalized Digital Surface Model) was used. The nDSM is calculated by formula (3):
= −
Figure (3) depicts the nDSM of area B:
Figure (3) – nDSM of case study A
2.2. Segmentation
The intent of the segmentation phase is to let the computer algorithm convert individual pixels into meaningful objects. This is typically done by grouping adjacent pixels that appear to be similar in some way. This step creates relatively homogeneous image objects throughout the image. In practice the aim is to create objects that have meaning within the context of the task .
Segmentation and Scale
Some features are easy to identify at a coarse scale such as roads or rivers. Other objects such as buildings in an urban area are more easily differentiated at a finer scale. Efficient image segmentation solutions allow the integration of segmentation results from different scales.
Features in an image can vary from fine to coarse scale. Hence, we need to find a balance (compromise) between too many and too few segments. A multi-scale approach identifies features at appropriate scales. The following segmentation algorithms were tested:
o Region growing - Find similar pixels from a seed and
neighboring pixels.
o Watershed detection – used mostly for gray-scale images and treats image like a topographic surfaces.
o Mean shift - Used for segmentation and filtering and also employs feature space and spatial domain.
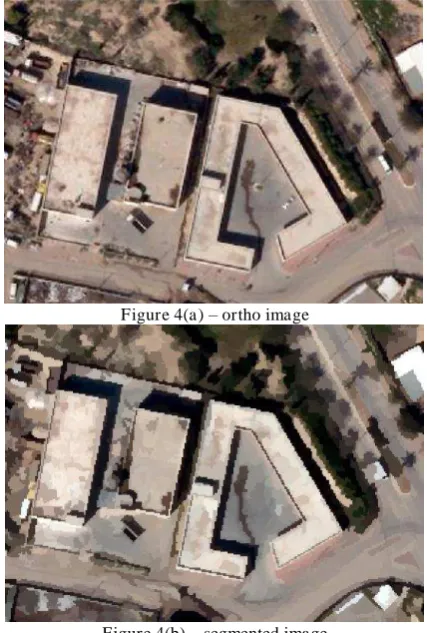
Finally, the Mean shift approach was selected. The next figure depicts the segmented image. Figure (4) depicts a segmented image where the segments have a small spatial size. We found out that segments with a small spatial size are a good start point for extracting structures.
Figure 4(a) – ortho image
Figure 4(b) – segmented image
Information Derived from Segments
Once an image segment has been defined it is possible to derive a number of attributes for each segment. This section lists the more common attributes which will be derived. The spectral attributes are calculated by processing the individual pixels that fall within the boundary of the segment and the spatial attributes that are calculated using the segment boundaries.
Spectral propertiessuch as: mean, variance, range, ratios
Spatial properties such as: area, shape, location, height After the execution of the segmentation procedure, the regions may be characterized according to their spectral characteristics, but also to their shape, size, texture, pattern, context, and association. Therefore, when considering the high number of parameters in the classification process, a step of variables selection is necessary to avoid over fitting.
2.3. Classification
The classification chain performs a training process, based on the intensities of each pixel as features, with following steps: Step 1 - estimating the input images statistics (to make these features comparable between each training images)
Step 2 - building a training set with positive examples of different objects of interest.
Step 3 – use the following learning scheme:
For each input image:
(1)Read the region of interest (ROI) inside the shapefile, (2)Generate validation and training data within the ROI. (3)Add vectors respectively to the training samples set and
the validation samples set.
(4)Increase the size of the training samples set and balance it by generating new noisy samples from the previous ones.
(5)Perform the learning with this training set.
(6)Estimate performances of the classifier on the validation samples set (confusion matrix, precision, recall and F-Score).
Algorithm (1) – machine learning scheme
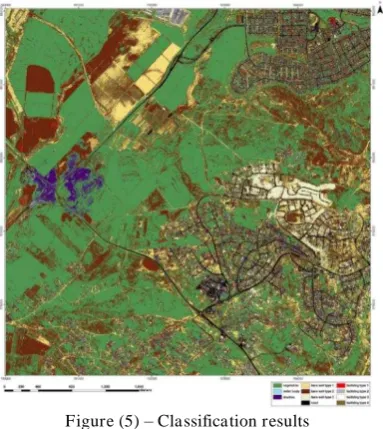
Once the classifier has been trained, we apply the model to classify pixel inside defined classes. Figure (5) depicts the classification results:
Figure (5) – Classification results
The performance of the model generated by the application is directly estimated, which displays the precision, recall and F-score of each class. After having processed several classifications of the same input image but from different models or methods (such as SVM, Bayes etc.), we fused these classification maps with the application which uses voting or the Demspter-Shafer algorithm to handle this fusion. Table (2) in appendix display the precision and the recall of the classification. The results show precision of above 99% for buildings type 1, but precision of 47% for building type 2.
2.4. Correct Classification Using Height Information
Since the classification is based on the radiometric characteristics we correct the classification results using the nDSM. These steps are performed to differentiate between ground and lifted surfaces such as gray parking lot and gray roof. In this stage the process is still pixel based. The classification correction used the assumption that building are
usually represent by 2m above the terrain at the nDSM. Figure (6) display the classification correction results:
Figure (6) – Correct Classification results using nDSM
Table (3) in appendix display the precision and the recall of the classification after the correction using the nDSM information. The results show precision of above 99.6% for buildings type 1, and precision of 97.7% for building type 2.
2.5. Morphological Operations
At this stage, the candidate areas to be defined as suspected buildings have been extracted. These areas were selected by classification results and criteria that define height differences of above 2 meters as a suspected building.
Through these criterions we calculate binary mask in order to describe suspected areas as potential buildings. This step done by the most basic morphological operations: dilate and erode. The number of pixels added or removed from the objects depends on the GSD, object size, object shape.
Figure (6) – Morphological operations results
2.6. Fused Classification to Segmentation
based approach. Each segment is labeled by histogram of the classified pixels within its borders and selecting by majority vote the selected label.
After classifying the segments, we identify segments which are candidate to be part of buildings.
Radiometric and geometric rules are applied to the dataset including: segments that belong to one of the building classes (e.g. red roof, gray roof, white roof, etc.) & most of the pixels within the segment are lifted. We then merge segments that belong to the same class and share some edges, or split segments if they are crossed by height edges. The ground part is removed from the building class. Figure (7b) display the results of this stage applied on the image in Figure (7a):
Figure (7a) – ortho image
Figure (7b) – candidate buildings
2.7. Delineate Vector Objects
At this stage we have rough building shapes. We then extract skeleton lines using the variational iteration method (VIM) which extract boundaries lines that has close to right angles corner as support vectors. Figure (8) display the results of the extract boundaries lines:
Figure(8) – VIM skeleton lines
Using the building candidates and the VIM skeleton lines we construct building shapes by applying geometry rules much like human digitization process. Figure (9) display the Automatic Buildings Extraction (ABE) by the VIM method:
Figure (9) – ABE by VIM method results
2.8. Compare Objects
The "compare objects" step is a key step in change detection procedures. The NTDB holds the buildings layer based on photogrammetric technologies conduct by human operators. The ABE results are based on ML (Machine learning) algorithms and image processing.
This is the main issue in comparing two different interpretation of the buildings geometry. In the best case scenario there will be a full match between NTDB and the ABE. In most cases, there will be some percentage of overlap. In the worst case scenario we will have many to many matches due to the complexity of the building footprint as shown at figure (10):
Figure (10) – left: ortho image,
Right: compare objects NTDB (blue) & ABE (red)
the geometrical relations in the group will result the Add or Delete or Identical (ADI) buildings.
A group is a collection of products from NTDB and ABE intersecting with each other, figure (11) describe it:
Figure (11) – NTDB(blue) and ABE(red) object relations is often 1 to many or many to many
Indices that will be calculated on the group:
Union– a union of the ABE product with the NTDB. This index will determine the size of the group .all the products intersecting with the union will be the group members:
� =
The union(black) of the all the memebers geometries
Area ratio - a division of ABE member's area by the NTDB member's area. As the ratio approaches 1.00 the ADI will equal I
� � � = ������
Intersect is the overlap of NTDB members of the group with the ABE members of the group
� = � �
The intersect(orange) between NTDB and ABE
IntersectOverNTDB - the area of intersect divided by the NTDB member's area. This index can be achieved by:
� � = �� � ������
IntersectOverABE - the area of intersect divided by the ABE member's area. This index can be achieved by:
� � = �� � ����
Analyzing the values of the indexes is supposed to detect three major phenomena: Added building, Deleted building and Identical buildings (which are about the same size and shape). The proposed criteria to detect phenomena described below, The algorithm implement describe below:
Input: NTDB (Shapefile), ABE (ShapeFile) Output: ADI
1) calculating indices for a group of intersecting geometries
2) n = 0
3) for NTDB_geometry in NTDB
4) if length(group(n)) == 0 then
5) create group(n)
6) add NTDB_geometry to group(n)
7) sigma_NTDB_area + = NTDB_geometry.area
8) elif NTDB_geometry Intersects group(n) then
9) add geometry to group(n)
Algorithm (2) – ADI identification
The detection of the ADI map implemented as follow: 1. Add : AreaRatio > 0.75 and IntersectOverABE <
0.75 and IntersectOverNTDB > 0.25
2. Delete : AreaRatio < 0.75 and IntersectOverABE > 0.75 and IntersectOverNTDB < 0.25
3. In case where a group have only ABE members then the ADI is Add
4. In case where a group have only NTDB members than the ADI is Delete
5. In case where a group have only ABE or NTDB members then the ADI
6. Identical (which mean no change): AreaRatio ≈ 1.0 and IntersectOverABE ≈ 1.0 and
IntersectOverNTDB ≈ 1.0.
3. RESULTS
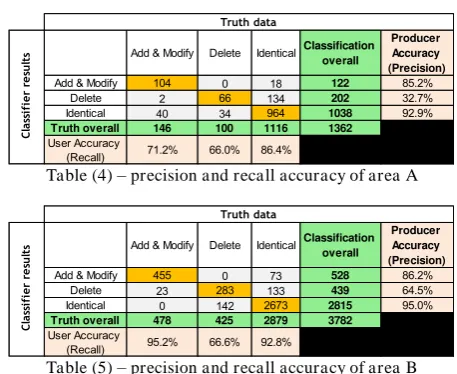
The precision and recall accuracy of the proposed methodology of area A and B are summarized in table (4) and (5) below:
Table (4) – precision and recall accuracy of area A
Table (5) – precision and recall accuracy of area B
The overall accuracy of area A and B are 83.3% and 90.2% receptively. As can be shown the algorithm has good results at
Add & Modify Delete Identical Classification
overall
Producer Accuracy (Precision)
Add & Modify 104 0 18 122 85.2%
Delete 2 66 134 202 32.7%
Identical 40 34 964 1038 92.9%
Truth overall 146 100 1116 1362
User Accuracy
Add & Modify Delete Identical Classification
overall
Producer Accuracy (Precision)
Add & Modify 455 0 73 528 86.2%
Delete 23 283 133 439 64.5%
Identical 0 142 2673 2815 95.0%
Truth overall 478 425 2879 3782
the change and non-change detection level. The precision and recall of the deleted objects are lower than the others due to the errors of the nDSM and the precision and recall accuracy of the classification.
4. SUMMERY
The paper describes a novel methodology for change detection by focusing on the buildings layer. The building layer is one of the major layers in any NTDB. The proposed methodology depicts promising results with an overall accuracy higher than 83%.
We assume that accurate and dense elevation models (DSM, DTM) will increase the overall accuracy of the process. A combination of several methodologies can improve the results and the overall accuracy.
ACKNOWLEDGEMENTS
The authors would like to thank Mr. Moshe Yaniv and Mrs. Natali Trachtenberg for their suggestions and useful implementations.
The authors would like to thank CNES® for developing and maintain the Orfeo toolbox framework.
The authors would like to thank Hetz ha zaphon Ltd. for providing the aerial dataset and for assistance during the research.
REFERENCES
Keinan, E., Felus, Y. A., Zilberstien, O., Trachtenberg, N., 2015, Advanced mapping process for automatic updating National Topographic Data Base based on change detection. Israeli Land Surveyors Annual conference, March 2015.
Baltsavias, E.P., 2004, Object extraction and revision by image analysis using existing geodata and knowledge: state-of-the-art and steps towards operational systems. ISPRS Journal of Photogrammetry & Remote Sensing 58, pp. 129 – 151
Le Bris, A., Chehata, N. 2011. Change detection in a topographic building database using sub metric satellite images. International archives of photogrammetry, remote sensing and spatial information sciences 38 p.25-30
Im. J., Jensen. J.R., Tullis. J.A., 2008. Object-based change detection using correlation image analysis and image segmentation. International Journal of Remote Sensing 29, p.399-423
Gladstone C. S., Gardiner A., Holland D. 2012. A SEMI-AUTOMATIC METHOD FOR DETECTING CHANGES TO ORDNANCE SURVEY® TOPOGRAPHIC DATA IN RURAL ENVIRONMENTS. Proceedings of the 4th GEOBIA, May 7-9, 2012 - Rio de Janeiro - Brazil. p.396
Airbus®. Pléiades Imagery User Guide. October 2012.
Holland D. 2010. Change Detection Questionnaire Results. EuroSDR Workshop - Automated change detection for updating national databases, March 4-5, 2010 - Southampton, UK.
Tang Y., Huang X., Zhang L. 2013. Fault-Tolerant Building Change Detection from Urban High-Resolution Remote Sensing Imagery. IEEE GEOSCIENCE AND REMOTE SENSING LETTERS, VOL. 10, NO. 5, SEPTEMBER 2013.
Emilio D., Clément M.2014. Change Detection in High-Resolution Land Use/Land Cover Geodatabases (at Object Level). EuroSDR Official Publication No 64, April 2014.
Yomdin, Y., Elichai, Y., Birman, S.,Spiegel, E.
SYNTHESIZED TEXTURES IN MPEG-4 at
APPENDIX
Table (2) – confusion matrix of the classification
Table (3) – confusion matrix of the classification correction building
91.7% 93.0% 99.5% 28.7% 99.3% 76.0% 92.2% 79.4% 100.0% 95.9%
building