AUTOMATIC TRAINING SITE SELECTION FOR AGRICULTURAL CROP
CLASSIFICATION: A CASE STUDY ON KARACABEY PLAIN, TURKEY
A. Ozdarici Ok a *, Z. Akyurek a
a METU, Dept. of Geodetic and Geographic Information Technologies, 06531 Cankaya Ankara, Turkey – (ozdarici,zakyurek)@metu.edu.tr
Commission VII, WG VII/4
KEY WORDS: Crop Classification, Agriculture, Segmentation, Mean-Shift, Kompsat-2
ABSTRACT:
This study implements a traditional supervised classification method to an optical image composed of agricultural crops by means of a unique way, selecting the training samples automatically. Panchromatic (1m) and multispectral (4m) Kompsat-2 images (July 2008) of Karacabey Plain (~100km2), located in Marmara region, are used to evaluate the proposed approach. Due to the characteristic of rich, loamy soils combined with reasonable weather conditions, the Karacabey Plain is one of the most valuable agricultural regions of Turkey. Analyses start with applying an image fusion algorithm on the panchromatic and multispectral image. As a result of this process, 1m spatial resolution colour image is produced. In the next step, the four-band fused (1m) image and multispectral (4m) image are orthorectified. Next, the fused image (1m) is segmented using a popular segmentation method, Mean-Shift. The Mean-Shift is originally a method based on kernel density estimation and it shifts each pixel to the mode of clusters. In the segmentation procedure, three parameters must be defined: (i) spatial domain (hs), (ii) range domain (hr), and (iii) minimum region
(MR). In this study, in total, 176 parameter combinations (hs, hr, and MR) are tested on a small part of the area (~10km2) to find an
optimum segmentation result, and a final parameter combination (hs= 18, hr= 20, and MR= 1000) is determined after evaluating
multiple goodness measures. The final segmentation output is then utilized to the classification framework. The classification operation is applied on the four-band multispectral image (4m) to minimize the mixed pixel effect. Before the image classification, each segment is overlaid with the bands of the image fused, and several descriptive statistics of each segment are computed for each band. To select the potential homogeneous regions that are eligible for the selection of training samples, a user-defined threshold is applied. After finding those potential regions, the training pixels are automatically selected and labelled. Thereafter, those training pixels are utilized in a traditional Maximum Likelihood Classification to classify five crop types namely; corn, tomato/pepper, rice, sugar beet, and whea t. The accuracy of the classification is evaluated in pixel-based manner with the help of a reference map including crop information of the area. Promising results are achieved for pixel-based approach. Based on the error matrices used in the evaluation, overall accuracy of the pixel-based analysis is computed as 89.31%. Similar to the overall accuracies, high individual class accuracies are obtained as well. The results point out that automatically collecting the training samples by extracting representative homogenous areas significantly increases the speed of the classification and minimizes the human interaction. The results also confirm that the proposed approach is highly appropriate for the extraction of representative homogenous training areas.
* Corresponding author. Middle East Technical University (METU),
Dept. of Geodetic and Geographic Information Technologies, K4-119, 06531,Ankara,Turkey (Asli Ozdarici Ok)
1. INTRODUCTION
Image classification is regarded as an important process to classify land use/land cover information from satellite images. In traditional remote sensing, there are two major categories of image classification procedures: (i) unsupervised and (ii) supervised. Unsupervised classification is based on the natural groupings of the pixels in an image. There is no priori information during the classification in this approach. On the other hand, supervised classification requires sufficient prior information to produce representative parameters for each class. Although significant number of different studies is available in the literature, most of them perform the classification of the images utilizing the supervised approach to provide higher accuracies. However, providing prior information or training samples for supervised classification are a very critical, expensive, and time consuming process. It must be emphasized that the quality of the training samples directly affects the performance of the classification as well. Hence, there is a strict
need to develop an automated method for collecting the required training samples to minimize those problems. A number of strategies to automatic selection of training samples from images have been reported in the literature in order to solve the problems (Goncalvez et al., 2007, Foody, 1999, Boser et al., 1992 etc.). Despite several studies are available in the literature, they do not still meet the needs about selecting training areas automatically. There is a need to develop an approach or method to respond the needs in terms of selecting the samples in an automated manner by utilizing minimum number of parameters and minimum computational complexity etc.
This study proposes an approach to extract training samples automatically by applying a segmentation method on a high spatial resolution image, Kompsat-2. First, an image fusion operation is applied on panchromatic and multispectral Kompsat-2 data. Next, the new image is segmented with the Mean-Shift segmentation approach. Multiple parameter International Archives of the Photogrammetry, Remote Sensing and Spatial Information Sciences, Volume XXXVIII-4/W19, 2011
combinations (in total, 176) are tested for the Mean-Shift method to decide optimum parameters used for the training site selection. All the segmentation results are evaluated based on multiple goodness measures and in this way, the parameter combination representing the optimum segmentation result is determined. To find more homogenous regions of the segmentation output, each band of the fused Kompsat-2 image is overlaid with the segments and some simple statistical computations (standard deviation and mean) are performed for each band. After taking the average of the statistics computed for each band, a threshold is determined to find more homogeneous segments. These segments are then used as training samples before the classification. The classification operation is performed for five crop types based on the traditional Maximum Likelihood Classifier (MLC). Effective results (Overall Accuracy: 89.3%) were achieved for the pixel-based evaluation of the produced thematic map.
2. STUDY AREA AND DATA
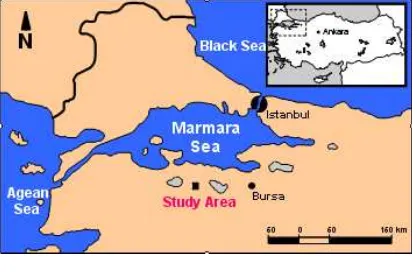
Study area was selected from Karacabey Plain (Bursa) which is located in Marmara region in northwest of Turkey (Figure 1). The geographic boundaries of the area are E28010’18’’ - E28018’06’’ and N40013’43’’ - N40008’37’’. It covers an agricultural land approximately 100 km2. Karacabey Plain is a representative region of agricultural structure and characterized by rich, loamy soils having good weather conditions. Due to these characteristics, it is one of the most productive and valuable agricultural regions of Turkey. Multiple crop types are cultivated in the plain such as corn, tomato, pepper, wheat, rice and sugar beet. The phenological characteristics of the main crops cultivated in the area are given in Table 1 (Turker and Ozdarici, 201X).
Figure 1 Study area
Panchromatic (1m) and multispectral (4m) Kompsat-2 images used for the classification were acquired on 11 July, 2008 in a clear sky condition. Technical characteristics of the Kompsat-2 images can be seen in Table 2 (Web 1). Kompsat-2 satellite has ability to provide two products; panchromatic (1m) and multispectral (4m). The multispectral (MS) Kompsat-2 data comprises of conventional four bands: blue, green, red and near-infrared. Spectral resolutions of these bands lie between 0.45-0.52, 0.52-0.60, 0.63-0.69 and 0.76-0.90 µm, respectively. Interval of spectral resolution for the panchromatic (PAN) image is between 0.50 and 0.90 µm. Pre-processing level of the Kompsat-2 image is level 2A, in which the radiometric correction is applied on the images to minimize the differences in viewing conditions. The geometric corrections have also been applied on the images in a standard cartographic projection
Table 1 Phenological characteristic of the main crop types
In addition to the Kompsat-2 images, a vector data containing boundaries of agricultural fields were used in the accuracy assessment processes. The vector data was produced by utilizing 1:5000 scaled cadastral maps (Turker and Arikan, 2005). It includes crop information such as; crop type, crop moisture, bare soil conditions and weeds, etc. that was recorded during the image acquisition.
Table 2 Technical characteristics of Kompsat-2 images
3. ANALYSES
3.1 Pre-processing
To provide the data integrity between different datasets and prepare the data, a number of pre-processing steps that are (i) image fusion and (ii) orthorectification were performed on the images.
In the study, a Least Square Fusion (LSF) method was used to generate 1m color image. After the image fusion process, orthorectification of the fused and MS Kompsat-2 images were performed with 15 Ground Control Points (GCPs) collected with a Differential Global Positioning System (DGPS). Root Mean Square Errors were (RMSE) computed as 0.50 and 0.85 pixels for the fused and MS images, respectively.
3.2 Image Segmentation
One of the most very widely used information extraction method in the remote sensing community is image segmentation. It is utilized to determine homogenous regions in an image by defining a homogeneity criterion (Cheng et al., 2001). In this study, an old pattern recognition procedure, Mean-Shift segmentation method, is used to partition an image into the homogenous objects. Mean-Shift-based clustering is based on kernel density estimation. The basic formula of the Mean-Shift procedure is given in Eq 1. More detailed International Archives of the Photogrammetry, Remote Sensing and Spatial Information Sciences, Volume XXXVIII-4/W19, 2011
explanation of the Mean-Shift can be found in Comaniciu and
K(x) is the kernel defined for the Mean-Shift process
x
denotes the center of the kernel used,h is the size of the kernel,
n is number of the points (Comaniciu and Meer, 2002).
The Mean-Shift segmentation was applied on a small part of the fused Kompsat-2 (1m) image (~10km2) due to the computational efficiency. An open source segmentation software called EDISON (Edge Detection and Image SegmentatiON) was used for that process (Web 2).In total, 176 parameter combinations were tested for spatial (hs), range (hr)
domains and minimum region (MR) in {5,6,7,………,20} x {20,21,22,……….30} x {1000}, respectively. The MR parameter was defined based on the total number of pixels that belongs to the smallest parcel in the area.
3.3 Evaluation of Segmentation Results
In the evaluation of segmentation results and searching for the optimum parameters, multiple goodness measures that computes both area and location similarities were utilized in the study (Clinton et al. 2010). First, a subset of representative 10% of all the polygons, human delineated agricultural fields, was selected from the ground truth data (Figure 4). Then, each segmentation result computed for different parameter combinations were compared to those training polygons based on the goodness measures. Selection of the optimum segmentation results were performed by ranking the results in terms of one or more of the goodness measures followed by making an optimization process of them. As a result of the evaluation, the optimum spatial, range and MR parameters were determined as hs= 18, hr = 20,
and MR = 1000 respectively. Those parameters were then utilized to segment the whole data (~100km2) (Figure 2).
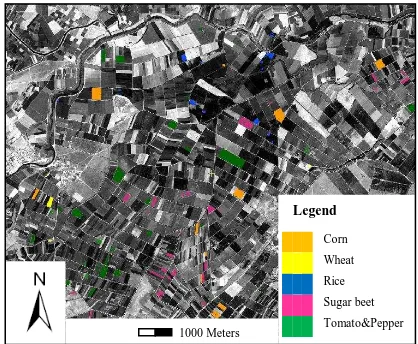
Figure 2 Segmentation results of the area with optimum parameters determined, and the segments having standard deviation between -2σ and+2σ were extracted as training samples and labelled automatically with the help of a reference information. Distribution of the selected segments and the corresponding crop types can be seen in Figure 3.
Figure 3 Distribution of training segments of the corresponding crop types on blue band of Kompsat-2 image
3.5 Image Classification
The labelled training segments were utilized as prior information to a state-of-art Maximum Likelihood Classification. The MS Kompsat-2 (4m) image was utilized in the classification process. Five different crop types namely; corn, tomato/pepper, rice, sugar beet, and wheat were categorized in the classification. Tomato and pepper classes were included as one class in the classification due to the spectral similarity of them. The classified output can be seen in Figure 4.
Figure 4 Thematic map of the MS Kompsat-2 image Corn
3.6 Evaluation of Thematic Map
Accuracy of the thematic map was computed with the help of an error matrix based on pixel-based manner. The evaluation was performed by comparing the classified image with ground truth data. During that process, training areas were excluded from the reference data to prevent possible bias on the assessment. In the evaluation of pixel-based approach, the accuracies of the classified images were tested using simple random sampling method. The random points were scattered to the reference fields based on the class percentages.A set of 580 samples were determined based on the equation below to perform the accuracy assessment process (Eq.2) (Jensen, 2005).
(2) where
N refers to the sample size
i is the proportion of a population in the ith class out of k
classes that has the proportion closest to 50%, bi is the desired precession for this class (e.g. 5%),
B explains the upper ( / ) x100th percentile of the chi square k (X2) distribution with 1 degree of freedom,
k is the number of classes.
4. RESULTS AND DISCUSSION
Accuracies of the thematic map computed based on pixel-based approach is given in Table 3. Promising results were achieved for five crop types as a result of the analysis. Overall accuracy and overall Kappa statistics were computed as 89.31% and 86.60%, respectively, to the pixel-based approach (Table 3). The highest user’s accuracy of 95.76% was obtained for the class wheat in parallel to the producer’s accuracy (99.12%) of the same class. The class tomato provided high user’s accuracy above 90%. The user’s accuracies of the other classes were calculated above 80%. The producer’s accuracies of them also exhibited acceptable results.
Table 3 Error matrix of pixel-based approach
C method is to perform the classification process through automatic selection of training samples by means of image segmentation. The classification operation was performed on the MS Kompsat-2 image with the selected training samples for five crop types. The produced thematic map was evaluated based on pixel-based approach. Effective results (~90%) were achieved as a result of the analyses. This approach significantly decreases time when collecting training samples and it helps to minimize the bias on the classification performance. Therefore, these kinds of approaches or algorithms may be useful to the researches dealing with information extraction from satellite images.
References
Boser E. B., Guyon, I. M., snd Vapnik, V. N., 1992. A training algorithm for optimal margin classifiers, COLT, USA, pp. 144-152.
Cheng, H. D., Jiang, X. H., Sun, Y., Wang, J., 2001, “Color image segmentation: advances and prospects”, The Journal of the Pattern Recognition, 34, pp. 2259-2281.
Clinton N., Holt A., Scarborough J., Yan Li., and Gong P., 2010. Accuracy assessment measures for object-based image segmentation goodness, Photogrammetric Engineering & Remote Sensing, 76(3), pp. 289-299.
Comaniciu D., Meer P., 1997. Robust analysis of feature spaces: Color image segmentation. IEEE Conference on Computer Vision and Pattern Recognition, San Juan, Puerto Rico, pp. 750-755.
Comaniciu D. and Meer P., 2002. Mean shift: a robust approach toward feature space analysis, IEEE Transactions on Pattern Analysis and Machine Intelligence, 24(5), pp. 603-619.
Foody, G.M., 1999. The significance of border training patterns in classification by a feedforward neural network using back propagation learning, International Journal of Remote Sensing, 20, pp. 3549–3562.
Goncalvez M. L., Netto, M.L.A., Costa, J. A. F., Zullo Junior, J., 2008. An unsupervised method of classifying remotely sensed images using Kohonen self-organizing maps and agglomerative hierarchical clustering methods, International Journal of Remote Sensing, 29(11), pp. 3171-3207.
Jensen, John R., 2005. Introductory Digital Image Processing, pp. 175, 198-202.
Turker M. and Arikan M., 2005. Sequential masking classification of multi-temporal landsat7 ETM+ images for field-based crop mapping in Karacabey, Turkey, International Journal of Remote Sensing, 26 (17), pp. 3813-3830.
Turker M. and Ozdarici, A., 201X. Field-based crop classification using SPOT4, SPOT5, IKONOS, and QuickBird imagery for agricultural areas: A comparison study, International Journal of Remote Sensing, In Press.
[Web 1]
http://www.spotimage.com/web/en/1155-kompsat-2images.php International Archives of the Photogrammetry, Remote Sensing and Spatial Information Sciences, Volume XXXVIII-4/W19, 2011
[Web 2]
http://www.caip.rutgers.edu/riul/research/code.html