BIOMASS ESTIMATION OF INDIVIDUAL TREES USING STEM AND CROWN
DIAMETER TLS MEASUREMENTS
M. Holopainen a *,M. Vastaranta a, V. Kankarea, M. Rätya, M. Vaajac, X. Liangb,X. Yub, J. Hyyppä b, H. Hyyppä c, R. Viitalad & S. Kaasalainen b
a
University of Helsinki, Department of Forest Sciences, Finland –[email protected] b
Finnish Geodetic Institute –[email protected] c
Aalto University, Research Institute of Modelling and Measuring for the Built Environment, Finland –[email protected] d
HAMK University of Applied Sciences, Finland –[email protected]
KEY WORDS: Terrestrial laser scanning, biomass, tree measurements
ABSTRACT:
The objective of this study was to make preliminary investigations between accurately measured field biomasses and terrestrial laser scanning (TLS) measurements including tree crown and stem diameters. Stem and crown biomass were determined based on detailed field measurements of the individual tree stem, bark, branch and needles. At the tree level, field measurements were intensive and thus material consisted of only 20 trees located at 11 stands. Stem and crown diameters were extracted manually from TLS point clouds and used as predictors for total biomass. Correlations from 0.96 to 0.99 between predicted and field measured biomass estimates were obtained. Examination of stem form predictions showed that various diameters measured by TLS could enhance the tree level stem curve predictions. Results are rather promising, but more field data is needed for developing practical modelling means. Our further studies will concentrate on automation of TLS data processing and use the of TLS features in the biomass estimation.
* Corresponding author.
1. INTRODUCTION
One of the biggest challenges in the programs that aims to reduce global emissions from deforestation and forest degradation (e.g. REDD) is how to measure and monitor forest biomass and its changes effectively and accurately. Remote sensing, such as optical and microwave satellite imaging, digital aerial photography, and laser scanning, is at its best in various forest monitoring tasks. The recent knowledge on forest biomass and its changes is based on more or less subjective ground measurements and coarse or medium resolution satellite images. Therefore accuracy of biomass estimations, especially in local level (e.g. forest stand), is poor. Airborne and terrestrial laser scanning (ALS & TLS) are promising techniques for efficient and accurate biomass detection because of their capability of direct measurement of vegetation structure or tree and stand characteristics (e.g. Koch 2010; Holopainen et al. 2010b).
Fixed-position (mounted on a tripod) terrestrial laser scanners offer a high potential for 3D mapping of smaller areas with high detail. The principle of TLS is simple – a highly collimated laser beam scans over a predefined solid angle in a regular scan pattern and measures the time of flight of the laser signal. The scanning range of the middle-range terrestrial system allows distance measurements between 2 and 800 meters. The potential of TLS is supported combining digital imagery. TLS measurements can be utilized e.g. in reconstruction of building models, for digital factory, virtual reality, architecture, civil engineering, archeology and cultural heritage, plant design, automation systems (robotics) and detailed planning and documentation. In forestry, TLS has been
used for detailed modelling of individual trees and canopies.
Hyyppä et al. (2009) and Kaasalainen et al. (2010) have shown that standing tree biomass and its changes can be measured, especially with a terrestrial laser scanner (TLS). Hyyppä et al. (2009) studied the capability of TLS to derive changes on the standing tree biomass and defoliation degree by destructive, consecutive defoliation operations. Biomass changes of Scots pine and Norway spruce trees were shown to be highly correlated with the number of hits in the TLS point cloud. The relative change in the number of reflected points when geometry differences of the measurements were normalized correlates in laboratory conditions with the real changes of the biomass with extremely high coefficient of determination (R2=0.95-0.98, number of sample 50).
Decisions concerning forest management procedures (silviculture treatments, thinnings and final cuttings) are often made either directly or indirectly from the tree dbh measurements gathered. Actually, the interesting characteristic is the stem form, but this cannot be measured cost-efficiently with traditional methods. A single tree's stem form is predicted International Archives of the Photogrammetry, Remote Sensing and Spatial Information Sciences, Volume XXXVIII-5/W12, 2011
by tree species, dbh and total stem length (Laasasenaho 1982). Errors in stem form prediction lead to inaccuracy in simulation of bucking (Holopainen et al. 2010a).
Determination of stem and crown biomass requires accurate measurements of the individual tree stem, bark, branch and needles (Repola 2009). These measurements are time consuming especially for mature trees. As far as we know, this kind field data has not yet been used in TLS based biomass estimation. The objective of this study was to make preliminary investigations between accurately measured field biomasses and TLS measurements including tree crown and stem characteristics. We also test could various stem diameters measured by TLS used to enhance the accuracy of the stem curve prediction.
2. METHOD
2.1 Study area and field measurements
The study area is located in the vicinity of Evo, Finland (61.19°N, 25.11°E). Field measurements were collected during the summer 2010 consisting of 9 Scots pines (Pinus sylvestris L.) and 11 Norway spruces (Picea abies L.).
2.2 Biomass field measurements
The trees were felled in the field. The total height of the tree (h), heights of the living and dead crown were recorded (hc, hdc The living crown was divided into four equal length sections height, the second at the middle between the stump and breast heights, the third at breast height (1.3 m), and then starting estimation methods. The measured moisture content of the sample discs for both the bark and stem wood separately were applied to the stem mass together with the estimated proportion of bark. Since we had sample discs from different heights of each sample tree, we applied the proportions and rations measured for the logs that were next to the disc.
The sample branches were used to estimate the branch dry weight from the fresh mass. Ratio estimates for living branch biomass were calculated first by crown sections. The total living branch biomass was the sum of the crown sections. Constant moisture content, based on the mean moisture content of dead sample branches on the plots, was used for dead similar field measurements as used here. Model predictors are tree species, dbh and height that are easily measurable with traditional means. Biomass for trees were predicted using these models and field measured dbh and height
2.5 Terrestrial laser scanning measurements
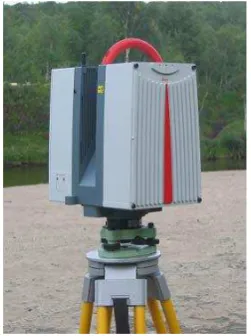
The TLS measurements were carried out in the spring of 2010 using the Leica HDS6100 TLS system (Leica Geosystem AG, Heerbrugg, Switzerland) (Figure 1).
Figure 2: The Leica HDS6000 TLS system.
HDS6000 is a 685 nm phase-based continuous wave laser International Archives of the Photogrammetry, Remote Sensing and Spatial Information Sciences, Volume XXXVIII-5/W12, 2011
acquisition rate is 500,000 points per second. The distance measurement accuracy is 4–5 mm, and the angular resolution is selectable from 0.009° to 0.288°. The circular beam diameter at the exit and the beam divergence are 3 mm and 0.22 mrad, respectively. The point spacing is 6.3 mm at 10 meters. In each plot, the scanner was positioned at the centre of the plot.
Figure 2: TLS point clouds from Scots pines (left) and Norway spruces (right).
2.5.1 Biomass estimation using TLS measurements
Tree detection and measurement of various stem and crown diameters were performed manually using TerraScan software. Stem diameters were measured at 0.2 m, 0.5 m,1.0 m, 1.3 m, 1.5 m, 2.0 m, ...6.0 m. From crown, maximum width and widths at four relative heights of the crown (0 %, 25%, 50% and 75%) were measured. Height of the lowest living and dead branch were also determined. Linear model was fitted to predict biomass and above mentioned TLS measurements were used as predictors.
2.5.2 Stem curve prediction
The stem form of the tree is traditionally predicted using Laasasenaho's (1982) stem curves in Finland. Stem curve prediction is then based on tree species, dbh and total stem length. TLS enables measurements of various diameters from the stem. Thus, stem form can be predicted by fitting a cubic smoothing spline function to the measured diameters, which we tested. R statistical package (R Development Core Team, 2007) was used in these analyses.
3. RESULTS
To check the consistency of the biomass measurements tree stem volumes were plotted against total biomasses (Fig. 3). Correlation was 0.99 for pines and 0.98 for spruces.
Figure 3: Tree volume (dm3) vs. total biomass (kg) for pines (grey) and spruces (black).
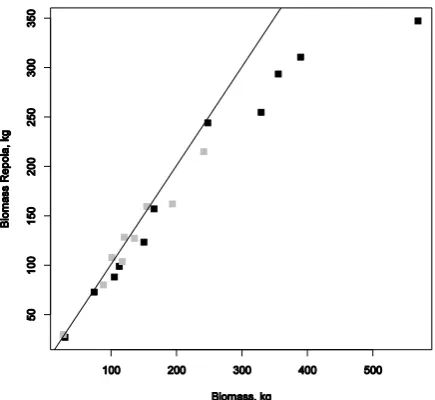
Then biomasses were predicted with existing models developed by Repola (2009). Existing models were based on tree species, dbh and tree height. Results are plotted in figure 4. for pines (grey) and spruces (black). Correlation was 0.98 for pines and 0.96 for spruces.
Figure 4. Tree biomasses predicted (Repola 2009) vs. field measured.
Figure 5. Field measured vs. predicted biomasses for pines. Predicted by models (Repola 2009, black) and TLS (grey)
Then we tested linear regression models were we used TLS measured dbh, height and crown dimensions as predictors. In the fig.5 are plotted Repola (black) and TLS (grey) estimated biomasses for Scots pines. Correlation between the field measured and TLS predicted biomasses was 0.99 for Scots pines. In fig 6. respective plot for spruces is presented. Correlation between the field measured and TLS predicted biomasses was 0.98 for spruces.
Figure 6. Field measured vs. predicted biomasses for spruces. Predicted by models (Repola 2009, black) and TLS (grey).
Figure 7. TLS measured stem diameters (circles), spline stem curve predicted from TLS (black line) and Laasasenaho’s stem curve predicted from dbh (dashed grey) for a Scots pine with dbh of 164 mm and height of 15.1 m.
We tested cubic spline smoothening to derive stem curve based on TLS measurements. Traditionally stem curves are predicted using stem curve models developed by Laasasenaho (1982). In figure 7, grey dashed line is Laasasenaho’s stem curve predicted based on dbh and height. TLS measured stem diameters (circles) and cubic spline stem curve predicted from TLS (black line) show the tree level variation in stem form.
4. CONCLUSIONS AND DISCUSSION
Based on our results, we propose the further development of the TLS methods for forest biomass assessment. With the developed methods we may be able to detect natural variation of the biomass in standing trees which would help globally in the reporting of environmental change-related counter activities. According to our preliminary results, we assume that laser measures of tree height, crown area, and biomass of needles and branch’s, are of high quality. However, more empirical tests are needed to verify these results.
The effect of stem form prediction in simulation of bucking is caused by deviations in the true and predicted stem form. This leads to errors in assessment of economic stock value (Holopainen et al. 2010a). Potential of TLS in enhancing the stem form predictions is not fully exploited. TLS could provide information from the tree quality and timber assortment outturns prior the cuttings.
Forests are one of the major carbon sinks in the global ecosystem. Because the canopy height, biomass, and carbon pools are functionally related, canopy height, which can be measured accurately by means of ALS, is a critical parameter in terrestrial carbon cycle (Kellndorfer et al. 2010). The leaf area index (LAI) has also been used as a measure of biomass (Koch 2010), and it has been successfully mapped with ALS, International Archives of the Photogrammetry, Remote Sensing and Spatial Information Sciences, Volume XXXVIII-5/W12, 2011
TLS measurements could be used for acquiring tree and plot level reference data for larger-area ALS biomass estimations.
This study provided some first tests of the biomass and stem form prediction using TLS data. Results are rather promising, but more field data is needed for developing practical modelling means. We already have 30 trees more scanned and measured from the same study area, but raw data processing is needed before those could be added to the analyses. Our further studies will concentrate on automatization of TLS data processing and use the of TLS features in the biomass estimation.
ACKNOWLEDGEMENTS
This study was made possible by financial aid from the Finnish Academy projects “Improving the Forest Supply Chain by means of Advanced Laser Measurements (L-impact)” and “Science and Technology Towards Precision Forestry” (PreciseFor).
.
REFERENCES
Holopainen, M., Vastaranta, M. Rasinmäki, J., Kalliovirta, J., Mäkinen, A., Haapanen, R. Melkas, T., Yu, X., Hyyppä, J. 2010a. Uncertainty in timber assortment estimates predicted from forest inventory data. European Journal of Forest Research, 129:1131-1142, Doi 10.1007/s10342-010-0401-4.
Holopainen, M., Hyyppä, J., Vaario, L-M. & Yrjälä, K. 2010b. Implications of Technological Development to Forestry. Invited book chapter. In Mery, G., Katila P, Galloway, G., Alfaro, R.I., Kanninen, M., Lobovikov, M., Varjo, J. (eds.) Forest and Society - Responding to Global Drivers of Change. IUFRO-World Series Volume 25:157-182 (Convening lead authors of the chapter: Hetemäki, L. & Mery, G.).
Hyyppä, J., Jaakkola, A., Hyyppä, H., Kaartinen, H., Kukko, A., Holopainen, M., Zhu, L., Matikainen, L., Chen, R., Chen, Y., Kaasalainen, S. Krooks, A. Litkey, P., Rönnholm, P., Vastaranta, M. & Lyytikäinen-Saarenmaa, P. 2009. Map Updating and Change Detection Using Vehicle-Based Laser Scanning, in proceedings of JURSE 2009, 20-22 May 2009.
Kaasalainen, S., Hyyppä, J., Krooks, A. Karjalainen, M., Lyytikäinen-Saarenmaa, P., Holopainen, M. , and A. Jaakkola. 2010. Comparison of terrestrial laser scanner and Synthetic aperture radar data in the study of forest defoliation. ISPRS Commission VII Symposium, July 5-7, 2010, Vienna, Austria.
Kellndorfer, J. M., Walker, W. S., LaPoint, E., Kirsch, K., Bishop, J. & Fiske, G. 2010. Statistical fusion of lidar, InSAR, and optical remote sensing data for forest stand height characterization: A regional-scale method based on LVIS, SRTM, Landsat ETM+, and ancillary data sets. Journal of Geophysical Research, Vol. 115, G00E08. Doi:10.1029/2009JG000997.
Koch, B. 2010. Status and future of laser scanning, synthetic aperture radar and hyperspectral remote sensing data for forest
biomass assessment. ISPRS Journal of Photogrammetry and Remote Sensing, 65:581-590.
Laasasenaho, J. 1982. Taper curve and volume function for pine, spruce and birch. Communicationes Instituti Forestalis Fenniae 108: 1–74.
Liang, X, Litkey, P., Hyyppä, J., Kaartinen, H., Vastaranta, M. & Holopainen, M. 2011. Automatic stem-location mapping using single-scan terrestrial laser scanning data in plot-wise forest inventory.IEEE Transactions on Geoscience and Remote Sensing, in press.
R Development Core Team, 2007. R: A language and environment for statistical computing. R Foundation for Statistical Computing, Vienna, Austria. URL: www.R-project.org (accessed 22.06.11).
Repola, J. 2009. Biomass equations for Scots pine and Norway spruce in Finland. Silva Fennica 43(4): 625-647.
Solberg, S. 2008. Mapping gap fraction, LAI and defoliation using various ALS penetration variables. International Journal of Remote Sensing 31(5):1227-1244.
Solberg, S., Næsset, E., Hanssen, K.H., & Christiansen, E. 2006. Mapping defoliation during a severe insect attack on Scots pine using airborne laser scanning. Remote Sensing of Environment 102:364–376.