WORKING PAPER
Factors Influencing Progress in Establishing
Community-Based Marine Protected Areas
in Likupang Sub-District of North Sulawesi, Indonesia
By
Brian R. Crawford
Associate Coastal Resources Manager Coastal Resources Center University of Rhode Island
([email protected]) and
Meidiarti Kasmidi Extension Officer
North Sulawesi
Indonesia Coastal Resources Management Project (Proyek Pesisir)
Factors Influencing Progress in Establishing
Community-Based Marine Protected Areas
in Likupang Sub-district of North Sulawesi, Indonesia
By:
Brian Crawford and Meidiarti Kasmidi
Abstract
Introduction
The use of marine protected areas (MPAs) has become a popular strategy to protect marine biodiversity as well as enhance and sustain fisheries production (White and Savina 1987, Alcala 1988, White 1989, Russ and Alcala 1994, 1996, Wantiez et al. 1997, McClanahan and Mangi 2000, NRC 2001, McClanahan and Mangi 2001, Roberts et al. 2001, Ward et al. 2001, Halpern and Warner, 2002, White et al. 2002, Gell and Roberts 2003, Halpern 2003). However, there is increasing concern that many MPAs are not effectively implemented (Alder 1996, McClanahan 1999, Jameson et al. 2002). Community-based MPAs that incorporate community participation and empowerment are often touted as an effective alternative to top down centralized approaches to the establishment and management of MPAs. This approach is widely used in South East Asia and the Western Pacific region, often as a component of coastal resources management programs (Ferrer et al. 1996, White et. al. 1996, Alcala 1998, Johannes 1998, King and Faasili 1998, Veitayaki 1998, Pajaro et al. 1999, World Bank 1999). Many of these are small-scale no-take marine reserves. While size is often considered an important criteria in reserve design (Lubchenco et al. 2002, Palumbi 2002,) there is ample evidence that small scale reserves also have positive ecological and economic benefits (Russ and Alcala 1996, Horrill et al. 2001, White et al. 2000, 2002, Halpern and Warner 2002, Halpern 2003). However, there is also concern that community-based marine protected areas (CB-MPAs), are experiencing high failure rates
(Crawford et al. 2000, Pomeroy and Carlos 1997, Alcala 2001).
There is a growing body of theory (Ostrom 1997, Carr et al. 2003, Rudd et al. 2003), numerous case studies (White 1987, 1989, Polotan-de la Cruz 1994, Pomeroy 1994, Ferrer et al. 1996, Johannes 1998, King and Faasili 1998, Veitayaki 1998,Horrill 2001) and an increasing number of comparative analysis (White et al. 1994, Pomeroy and Carlos 1997, World Bank 1999, Pollnac et al. 2001, Francis et al. 2002, Pomeroy et al. 2002) that identify factors influencing success of community-based approaches for the establishment of small scale no-take marine reserves. For instance, an empirical analysis of 45 sites the Central Visayas region of the Philippines (Pollnac et al. 2001) identified several project intervention factors and community context factors that influence success of CB-MPAs. However, it is unclear how these factors may be applicable in other locations of the world. In addition, many experts of CB-CRM suggest that attributes of field workers can influence success (Crawford et al. 2000). Diffusion research (Rogers 1995) points to the concepts of homophily and heterophily. Homophily is the degree to which individuals communicating are alike or not alike (heterophilous) with respect to social status, education, etc. Communication tends to be better in cases where individuals are homophilous. Diffusion of innovations within an interpersonal network tend to spread rapidly when members of the network are homophilous. However, the introduction of a new innovation often occurs through hetrophilous relationships between members of different interpersonal networks. In the case of a CB-MPA, the homophilous and heterophilous characteristics of extension workers and community organizers can therefore be important factors influencing diffusion of this innovation.
workers relative to the community (degree of homophily or heterophily), other than full or part time status, was impossible to obtain since they were no longer assigned to the villages.
Community-based coastal resources management approaches are being used with increasing frequency in Indonesia. Projects such as the USAID-supported Indonesian Coastal Resources Management Project (CRMP) (Crawford et al. 1998, Tulungen et al. 2000) and the multi-donor supported COREMAP use community-based management strategies as major program
components (World Bank 2001). They have pioneered the establishment in Indonesia of effective models of community-based coastal management (CB-CRM) as well as the establishment of small-scale community-based marine protected areas (CB-MPAs). The decentralization of marine jurisdiction to local government in 1999 (Patlis et al. 2001, Patlis 2003) (National Law No. 22 of 1999) has contributed substantially to this trend (Dahuri and Dutton 2000).
The Indonesian Ministry of Marine Affairs and Fisheries (Taryoto 2002) and local governments (Tulungan et al. 1999, Patlis et al. 2003) (e.g. Minahasa Law No. 2 of 2002) are now formulating strategies to apply CB-MPA approaches more broadly in a large number of sites. Therefore, the rapid diffusion of the CB-MPA innovation throughout the country is likely to occur over the next decade. This is similar to the rapid expansion of that occurred in the Philippines (Pajaro et al. 1999, Crawford et al. 2000, White et al. 2002) during the 1980s and 1990s.
Since substantial donor and Indonesian government investments are being made in CB-MPA approaches, increasing the probability of their cost effective and successful adoption is essential. Hence it is useful to examine to what extent factors influencing the success of CB-MPAs
elsewhere in the world are applicable in Indonesia. In addition, projects such as the CRMP have experimented with CB-MPA initiatives that use modified intervention strategies for community level organization and planning that place more emphasis on the roles of village-level
community organizer volunteers and minimize the roles of external field extension agents as a potential cost savings measure. Therefore an examination of the relative importance of extension agent and community organizer backgrounds and skills and the roles of homophily and
heterophily in the diffusion process needs to be understood.
Lastly, many studies have examined the success of community-based MPAs at the time of project completion or years after the project has ended. However, project managers are often interested in ways and means to monitor intermediate indicators of success (e.g. process measures such as institutions formed, laws passed, etc.) so that project strategies and interventions can be adjusted during project implementation. By monitoring intermediate measures of program success, it is assumed that these milestones will ultimately lead to longer-term outcomes such as improved environmental quality, fisheries production and quality of life for coastal communities. Outcome monitoring therefore needs to be phased on a temporal scale (Olsen et al. 1998) as part of an adaptive management process.
Project and Site Background
North Sulawesi Province (Hanson et al. 2003). Activities started in 2002 with meetings and trainings of sub-district and district officials as well as village leaders. Villages were given the option to voluntarily participate or not in the program and were required to submit a letter of interest in order to be included in the initiative. Twenty-four of the twenty-five villages ultimately participated in the program. Project activities at the village level started in March 2002 and were completed in September 2003.
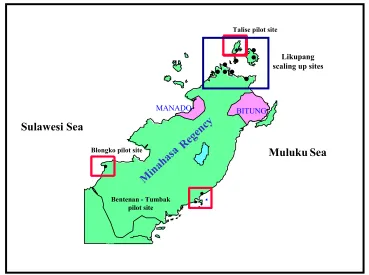
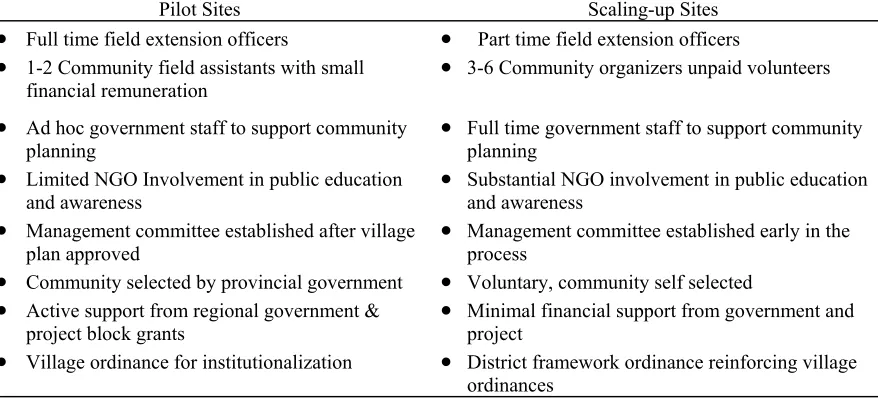
Figure 1. Location of initial pilot sites and “scaling-up” sites in Likupang districts Pilot project sites were initiated in 1997 in four villages in the Minahasa District (Crawford et al. 1998). Interventions used for the Likupang sites were modified from the approach used in initial pilot sites (see Table 1). The intent at the Likupang “scaling-up” sites was to use a simpler and less costly approach that would have more likelihood of adoption by local government in the absence of substantial foreign assistance. In addition, activities were concentrated in two adjacent sub-districts in order to obtain economies of scale (e.g. conducting training on-site for several communities at once). Officials at the sub-district level and staff of the Fisheries Office were more involved in the effort as well. The community-based planning and development process was similar to the pilot sites. However, more emphasis was placed on early training of community members in a number of areas including CRM, facilitation, conflict resolution, among others. In addition, communities were trained by the Village Community Development Board in how to prepare annual village development plans that include coastal management elements. The sub-district and district government through the standard bottom up and top down village development planning process can therefore more easily fund implementation of these annual CRM and MPA plans.
MANADO BITUNG
Bentenan - Tumbak pilot site
-Talise pilot site
Blongko pilot site
Sulawesi Sea
MulukuSea
Min ahas
a R egen
cy
Table 1. Comparison of pilot site and scaling up site strategies
Pilot Sites Scaling-up Sites
• Full time field extension officers • Part time field extension officers
• 1-2 Community field assistants with small financial remuneration
• 3-6 Community organizers unpaid volunteers
• Ad hoc government staff to support community planning
• Full time government staff to support community planning
• Limited NGO Involvement in public education and awareness
• Substantial NGO involvement in public education and awareness
• Management committee established after village plan approved
• Management committee established early in the process
• Community selected by provincial government • Voluntary, community self selected
• Active support from regional government & project block grants
• Minimal financial support from government and project
• Village ordinance for institutionalization • District framework ordinance reinforcing village ordinances
Another important difference in the Likupang scaling-up sites was the use of field extension officers and community organizers. In the pilot sites, one full time field extension officer was assigned to the site for a period of one to two years. A part-time field assistant from the community assisted them. In the scaling up sites, the project hired a team of field extension agents (FEOs) that were supervised by an experienced team of senior extension agents involved in the initial pilot sites. The FEOs were all relatively young, recent graduates from the local university. They did not live in the villages but worked out of a provincial office in Manado. Each FEO was responsible for community organizing and planning efforts in several villages. The FEOs were assisted by a group of community organizers (COs) that were all un-paid volunteers who were village residents and nominated by their village government.
Methodology
This paper empirically examines factors that contribute to successful CB-MPAs in Indonesia. The study analyzes information from 24 village sites in two Likupang Sub-Districts of North Sulawesi Indonesia involved in a community based planning effort started in March 2002 by the USAID-funded CRMP. There are over 130 coastal villages in the Minahasa District and as of September 2003, twenty-nine villages have on-going CRM initiatives and established CB-MPAs. The methodology used in this study is similar to Pollnac et el. (2001), with a number of important differences. This study did not directly collect data in the sample sites using a rapid assessment approach. Instead, available secondary data, information from project reports and data provided by project staff working in the villages was used. Particular attention was paid to the influence of FEO and CO characteristics. A different measure of success was also used and is described below. All data were collected between October 2002 and January 2003.
The dependent variable
been used by the project management team to track progress within the 24 villages in Likupang. There are eight milestone indicators of progress including:
1. Development of a coastal profile;
2. Selection of a marine sanctuary site and/or; 3. Selection of mangrove sanctuary site; 4. Formation of a management group; 5. Development of a village ordinance; 6. Development of a management plan;
7. Submission of a grant proposal for installation of maker buoys and signboards, and; 8. Installation of sanctuary boundary marker buoys and signboards.
Each site was given a score for each indicator. A score of 0 was assigned if the milestone had not been achieved, 0.5 if the milestone had be partially achieved and 1 if the milestone was fully achieved. Scores were summed for a total possible Milestone/Progress score ranging from zero to eight. The senior project extension agent responsible for supervision of activities in Likupang scored each site for each milestone indicator.
Independent variables
Independent variables that are hypothesized to influence success of CB-MPAs were compiled. These variables were summarized from the existing literature on community-based management and from expert focus group meetings in the Philippines by Pollnac et al. (2001) and Crawford et al. (2000). A subset of these variables considered appropriate to the local Indonesia context were reviewed with the CRMP senior extension team in North Sulawesi. Several new variables were added, particularly attributes of FEOs and COs that researchers and extension staff felt
influenced success. These independent variables were organized into several categories for the analysis – community context, project activity, extension officer and community organizer variables. Each of these independent variables represents a hypothesis that it is related to making progress towards establishing CB-MPAs but no explicit assumptions were made a-priori as to the direction of that relationship.
Context variables are the intrinsic characteristics of the community including a number of measures concerning village size, sociocultural complexity and various dimensions concerning level of development. Secondary data from the provincial Bureau of Statistics was the main source of information for the context variables. This was supplemented with information provided by senior extension officers and field extension workers assigned to each site.
Information was cross checked with information contained in village profiles and CRMP reports.
compiled by the research team were reviewed with the senior project extension team and FEOs in a focus group meeting. The variables were then modified based on their assessment of which variables they considered most important. Data on each variable for each FEO were then obtained by interviewing the FEOs (e.g. age, marital status) as well as by asking supervising senior extension staff to provide rank scores for FEO skill attributes (e.g. communications and interpersonal skills). An identical procedure was used for determining CO variables. However, FEOs then compiled information on the community organizers and also scored each individual CO for skill attributes. Detailed information on the attributes of the FEOs and COs was an area that the Pollnac et al. (2001) study was not able to fully address and is emphasized in this
analysis. Summing several independent variable scores created a number of composite variables in the categories of community context, project activities as well as FEO and CO attributes, including measures representing degree of homophily with the village community. The variables, data source, as well as the measure or scoring procedure are provided in Table 2.
Data Analysis
Zero order correlations were calculated between the progress measure and each independent variable. Results are reported only for independent variables demonstrating statistical
significance (p<0.10). Principle component analysis (PCA) was conducted on those independent variables that exhibited statistically significant (p<0.10) zero order correlations with the progress measure. A total of 15 variables were included in the initial PCA using varimax rotation.
Table 2. Variables, measures and data sources.
Variable Measure/Scoring Procedure Data Source
DEPENDENT VARIBALE
Progress/Milestone score Sum total of scores for each milestone: completed = 1, in process = 0.5, not started = 0, total possible score = 8
CRMP
INDEPENDENT VARIABLES
Context Variables
Population In 2000 Total individuals BPS2000
Population In 1992 Total individuals BPS1992
Pop. Growth Rate (1992-2000) (pop 2000 – pop 1992)/pop1992)/8 BPS2000
Household Size Total number of household occupants BPS2000
Total Land Area Total land area BPS2000
Population Density (2000) Land area/total population in 2000 BPS2000
Small Island Yes – 1 No - 0 BPS2000
Village Administrative Diversity Total dusuns in the village BPS2000
Village Ethnicity Total number of major ethnic groups estimated by FEOs CRMP Total Number of Religions Total number present – sum of BPS categories BPS2000 Village Diversity/Complexity Index Total dusuns + ethnicity + religions
Village Religion Percent of population Muslim - estimate provided by FEOs CRMP Democratic Tradition Demo. decision making scored by FEOs (scale 1-5, 1-low, 5-high) CRMP Leadership Support Support for CRM scored by FEOs (scale 1-5, 1-low, 5-high) CRMP
Tourist Facilities Tourism facilities present - Yes=1, No=2 CRMP
Tourist Activities Tourism activities present Yes=1, No=2 CRMP
Tourism Development Index Sum of tourism facilities and activities scores
SWA Development Classification Swasambada – 3, Swakarya – 2, Swadaya – 1 (3-high to 1-low) BPS2000 IDT Development Classification Developed = 1, less developed = 0) BPS1996 Composite Development Index Sum of SWA + IDTscores
Health Workers Number of health workers -sum of all BPS categories BPS2000 Health Facilities Number of health facilities - sum of all BPS categories BPS2000 Educational Infrastructure Total number of schools - sum of all BPS categories BPS2000 Religious Infrastructure Total number of religious buildings – sum of BPS categories BPS2000 Social Development Index Total schools + health facilities + religious buildings
Commercial Development Total number of industries - sum of all BPS categories BPS2000 Communications Facilities Total number of communications facilities - sum of BPS categories BPS2000 Motorized Transportation Total number of non-motorized vehicles - sum of all BPS categories BPS2000 Non-Motorized Transportation Total number of motorized vehicles - sum of all BPS categories BPS2000 Small Business Development Total number of shops - sum of all BPS categories BPS2000 Business Development Index Total shops + comm + motor + industries
Coffee Agricultural Development Total number of coffee trees - sum of all BPS categories BPS2000 Clove Agricultural Development Total number of clove trees - sum of all BPS categories BPS2000 Coconut Agricultural Development Total number of coconut trees - sum of all BPS categories BPS2000 Agricultural Development Index Total clove, coffee and coconut trees
Number of Farmers Total number of farmers BPS 2000
Number of Fishers Total number of fishers estimated by FEOs CRMP
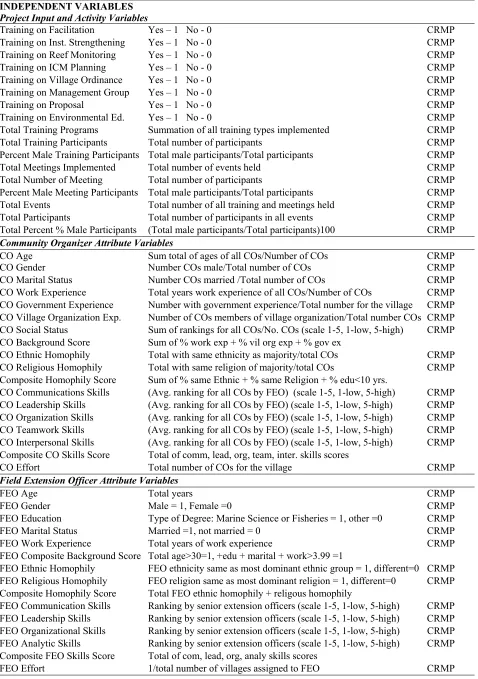
Table 2. Variables, measures and data sources (continued).
Total Training Programs Summation of all training types implemented CRMP
Total Training Participants Total number of participants CRMP
Percent Male Training Participants Total male participants/Total participants CRMP
Total Meetings Implemented Total number of events held CRMP
Total Number of Meeting Total number of participants CRMP
Percent Male Meeting Participants Total male participants/Total participants CRMP
Total Events Total number of all training and meetings held CRMP
Total Participants Total number of participants in all events CRMP
Total Percent % Male Participants (Total male participants/Total participants)100 CRMP Community Organizer Attribute Variables
CO Age Sum total of ages of all COs/Number of COs CRMP
CO Gender Number COs male/Total number of COs CRMP
CO Marital Status Number COs married /Total number of COs CRMP
CO Work Experience Total years work experience of all COs/Number of COs CRMP CO Government Experience Number with government experience/Total number for the village CRMP CO Village Organization Exp. Number of COs members of village organization/Total number COs CRMP CO Social Status Sum of rankings for all COs/No. COs (scale 1-5, 1-low, 5-high) CRMP CO Background Score Sum of % work exp + % vil org exp + % gov ex
CO Ethnic Homophily Total with same ethnicity as majority/total COs CRMP CO Religious Homophily Total with same religion of majority/total COs CRMP Composite Homophily Score Sum of % same Ethnic + % same Religion + % edu<10 yrs.
CO Communications Skills (Avg. ranking for all COs by FEO) (scale 1-5, 1-low, 5-high) CRMP CO Leadership Skills (Avg. ranking for all COs by FEO) (scale 1-5, 1-low, 5-high) CRMP CO Organization Skills (Avg. ranking for all COs by FEO) (scale 1-5, 1-low, 5-high) CRMP CO Teamwork Skills (Avg. ranking for all COs by FEO) (scale 1-5, 1-low, 5-high) CRMP CO Interpersonal Skills (Avg. ranking for all COs by FEO) (scale 1-5, 1-low, 5-high) CRMP Composite CO Skills Score Total of comm, lead, org, team, inter. skills scores
CO Effort Total number of COs for the village CRMP
Field Extension Officer Attribute Variables
FEO Age Total years CRMP
FEO Gender Male = 1, Female =0 CRMP
FEO Education Type of Degree: Marine Science or Fisheries = 1, other =0 CRMP
FEO Marital Status Married =1, not married = 0 CRMP
FEO Work Experience Total years of work experience CRMP
FEO Composite Background Score Total age>30=1, +edu + marital + work>3.99 =1
FEO Ethnic Homophily FEO ethnicity same as most dominant ethnic group = 1, different=0 CRMP FEO Religious Homophily FEO religion same as most dominant religion = 1, different=0 CRMP Composite Homophily Score Total FEO ethnic homophily + religous homophily
Results
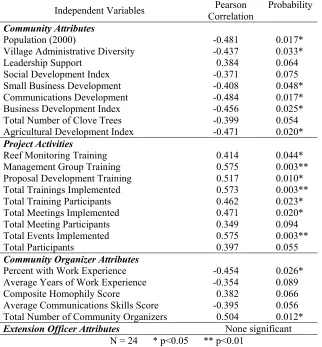
The following are the results of the analysis of factors associated with progress in establishing community-based MPAs at village sites in Likupang. Table 3 shows the statistically significant (p<0.10) Pearson correlation coefficients for each independent variable relative to the dependent variable of success (milestone score of progress). These are organized into four areas - community attributes, project activities, community organizer attributes and field extension officer attributes. The table shows the correlation coefficient, and corresponding probability for each statistically significant variable with a p < 0.10 used in the analysis.
Table 3. Correlation of milestone scores with selected independent variables
Independent Variables Pearson
Total Number of Clove Trees -0.399 0.054
Agricultural Development Index -0.471 0.020*
Percent with Work Experience -0.454 0.026*
Average Years of Work Experience -0.354 0.089
Composite Homophily Score 0.382 0.066
Average Communications Skills Score -0.395 0.056 Total Number of Community Organizers 0.504 0.012*
Extension Officer Attributes None significant
N = 24 * p<0.05 ** p<0.01
Village characteristics or context factors associated with better progress that are statistically significant at the 0.10 alpha level include:
• Village Population and Administrative Diversity – Villages with smaller total population and a smaller number of sub-villages tend to have higher Milestone/Progress scores.
• Social Development Index – The social development index consisting of total number of educational, religious and health facilities was inversely correlated with the
Milestone/Progress Score.
tend to have higher milestone/progress scores. Several other development indicators were not significant.
• Leadership Support – Villages with a higher score on leadership support tend to have higher milestone/progress scores.
• Farming- Two farming variables were inversely correlated with the milestone/progress score including the number of clove trees (an indicator of agricultural development) and the total agricultural development index. However, several of the individual agricultural development indicators were not significant.
Clove trees are usually not abundant in coastal areas and are typically found at higher elevations. Therefore, this variable may be an indicator of the degree to which the village land area is coastal. The two significant agricultural related variables suggest that villages with less dependence on farming (and by inference more dependence of marine resources such as fisheries) tend have higher milestone/progress scores.
We would expect that number of fishers would be positively correlated with the
milestone/progress score as this was a consistent result in the Pollnac et al. (2001) study. In this study, it was positively correlated but not statistically significant. The small number of fishers and low variance in the data may be a factor contributing to this explanation. In addition, many households in Minahasa have multiple occupations (Pollnac et al. 1997, 1998, Sukmara et al. 2001). For instance a household or individual may farm, fish and be involved in other productive activities. Hence by using only one occupational class, individuals classified or self-identified as farmers may also fish as a part-time occupation. Therefore using this measure taken from census data, village profiles or village leaders may under-represent the actual number of households and individuals who rely to some extent on fishing. Number of boats was not significant either.
It should be noted that all community context variables, with the exception of leadership support, were negatively correlated with the progress score. Hence, in general, smaller villages with less development tend to have higher progress scores. The relationship of village population to progress is similar to the results of the Pollnac et al. (2001) study. However, the correlation with many of the development indicators differed with that of Pollnac et al. (2001) where no development measures were significantly correlated with success. This was surprising. We must bear in mind however, that different success
measures were used and measured at a different time in the project cycle. Hence, while less developed villages in this case tend to make faster progress (higher progress score), it may not be important over the long term after projects are completed. Hence, we may be able to make faster progress in smaller less developed villages, but longer project time frames applied in larger more developed villages may ultimately result in equal long term success as well. The village size and level of development therefore may be important if project
timeframes are short or project resources limited. It is also possible that level of development is important in Indonesia but not in the Philippines due some other supra variable that differs between these nations. More research is needed in this area.
Activity indicators related to faster progress are:
• Training effort – Villages with a greater number of total trainings implemented and greater number of participants attending trainings tend to have higher milestone/progress scores. These process measures of project activities can be viewed as capacity
• Types of training - Three types of training were directly correlated with the
milestone/progress score. These were manta tow, management group and proposal training. Several training courses such as on facilitation techniques and CRM training were not statistically significant. However, on examination of the raw data, these courses were implemented in a majority of villages so the variance was quite low. Total number of training courses implemented therefore is a more meaningful indicator.
• Meeting effort – The more meetings held and the larger the number of participants attending meetings, the greater the likelihood of a higher milestone/progress score.
• Total number of events and participants – Total number of events and total number of participants was positively correlated with the Milestone/Progress Score.
The large number of project activity variables positively correlated with higher progress scores is not surprising. Without project inputs, it is difficult to see how communities could make significant progress. This reinforces many findings that emphasize the importance both public participation and capacity development. Rudd (2003) has emphasized the need for capacity development to build social capital especially in decentralized systems where local government institutions are weak. This type of situation is found in Indonesia.
Community organizer characteristics associated with progress include:
• Work Experience – The percent of COs with work experience and average years of CO work expereince was inversely correlated with the milestone/progress score.
• Total Number of Community Organizers – The number of community organizers was directly correlated with the Milestone/Progress Score.
• Community Organizer Homophily Score – CO homophily was directly correlated with the milestone/progress score
• Communications Skills –The average communications skills score for all community organizers in the village was inversely correlated with the milestone/progress score.
The fact that work experience was indirectly correlated with progress was opposite our expectations. Project extension officers were queried about this result. They felt that certain individuals in the community have little free time to devote to volunteer activities and are engaged in food production and/or income generating activities. Hence, those with greater work experience may be more gainfully employed on a full time basis and less able to devote time to community organizing activities. Therefore, work experience may be an indirect indicator of total amount of time COs are able to devote to project activities.
Total number of COs is likely related to total time or effort devoted to community organizing within the community. More people means more effort that results in faster progress.
The positive correlation between progress and CO homophily corresponds with other research on extension. The COs act as an important link for diffusion of the CB-MPA innovation in the village. Since the community selects and therefore respects the COs , they are likely opinion leaders within the community, increasing the likelihood of adoption of the CB-MPA innovation by others within the community. Once COs accept the innovation based on information they obtain through trainings organized and implemented by the field
extension agents they likely diffuse the innovation rapidly within their own homophilous intra-community communications network. Many extension agents have remarked that cross visits between the older pilot sites and new scaling up sites were very influential in
demonstrated that knowledge of the Blongko village MPA rules diffused from Blongko to neighboring villages primarily through fisher households (Crawford et al. 2000), a relatively homophilous group. Fisher to fisher and community to community communication channels are therefore likely to represent homophilous communication networks.
The inverse correlation between communications skills and progress scores was opposite our expectations as good communicators can spread information more rapidly. However, FEOs ranked the communications skills of COs and if FEOs are hetrophilous in relation to the COs, communication between them is more difficult. Hence, a low communication rank by the FEO may represent the ability of the CO to communicate with the FEO, not the ability of the CO to communicate effectively with village residents. COs with higher communication rankings may be more homophilous with the FEO and by inference, more heterophilous with members of their own community. Therefore a low communication skills rank by the FEO may be an indirect indicator of CO homophily with others in the community, resulting in an inverse correlation with the progress measure. More research is needed in this area. For instance, methodologically, CO interpersonal communications and leadership skills may be more accurately ranked by community peers rather than FEOs and therefore could provide a different result.
There were no statistically significant extension officer characteristics associated with progress. This is a surprising finding since many experts, particularly in the Philippines, consider their role crucial in the planning and development process (Crawford et al. 2000). However, Pollnac et al. (2001) found no relationship between part time or full time status of field extension workers in the Philippines. CRMP staff in North Sulawesi are of a similar opinion as experts in the Philippines and also felt that the role of FEOs is very important. One possible explanation may be that there was not enough variance in the data to carry out a useful analysis. This could have been caused by a reluctance of senior extension officers to give a wide range of scores to FEOs. Another explanation may be that they all have adequate and similar capacity to perform their responsibilities based on hiring requirements and
orientation training provided, creating a relatively uniform level of capabilities among the group. Hiring requirements and initial training were based on lessons from assignment of FEOs in the original pilot sites. Hence, they may all have minimal or essential characteristics deemed important.
While homophily can be important, it was not significant in this case of FEOs. However, all the FEOs were from the local province and have some knowledge of local dialects such as Manadonese. The results may have differed if the sample included FEOs from more far-flung locations of Indonesia, such as Java with no knowledge of local dialects and culture. The local FEOs therefore may be homophilous relative to a possible national pool of FEOs. However, there may be another explanation.
New ideas often enter a system through individuals with higher status that are considered opinion leaders (Rogers 1995). These individuals are often heterphilous with most
community residents. COs may view FEOs as opinion leaders of higher status since they lead training courses and are university graduates. In this case, we could view COs as community innovators that accept new ideas from the outside through communications networks (e.g training courses) with heterophilous FEOs (heterophilous relative to the COs).
A third explanation is also possible. The roles and skills of FEOs may be less critical
as noted above. The fact that the FEOs are not living full time in the community may be a reason that their backgrounds and skills are less critical for progress compared to the COs. In cases where FEOs are assigned full time to the community and where there is less use of COs, some FEO attributes may be important and therefore should not necessarily be de-emphasized based on results in this particular analysis. More research on communication networks and the role of homophily and heterophily is needed.
No gender variables in the project activities, FEO or CO categories were significantly correlated with progress. This also goes against the conventional wisdom that stresses the need for gender equity as an important aspect of the quality of community participation. However, the establishment of a CB-MPA in the marine waters of the village involves stakeholders that are primarily fishers, which are mostly male. Some women fish, many glean the reef flats and women are often involved in shore based fisheries activities such as marketing or processing (Pollnac et al. 1997a, 1997b, Pollnac et al. 1998, Crawford et al. 1999, Kussoy et al. 1999). However, males dominate activities on the water they are the most important stakeholders in determining MPA location as well as allowable and
prohibited activities. In all villages, male participation exceeded 50 percent of participants in training events and meetings and was an average of 83 and 75 percent respectively. Hence it would seem that a process with a high level of male participation in this case is appropriate. It is likely that if a significant number of villages had percentages of male participation below 50 percent (female dominated project training and meeting activities), we may have had a different result.
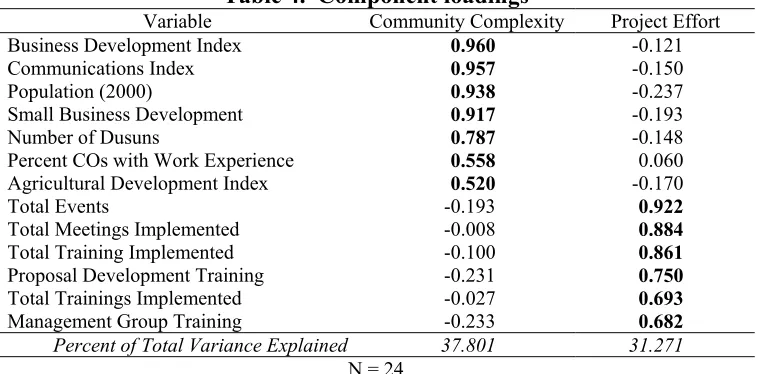
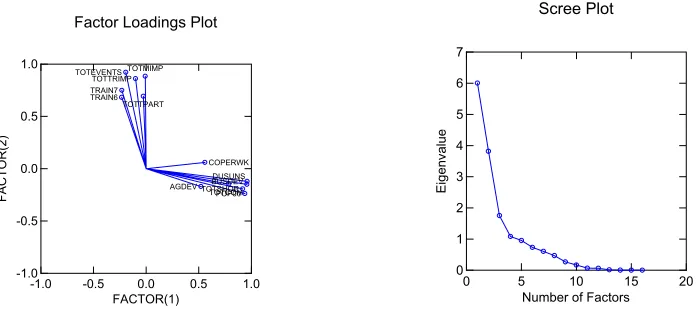
Principle component analysis using two and then three factors were compared. Two rather than three components resulted in a better interpretation of the data even though the
eigenvalue for three factors was approximately half the eigenvalue of two factors. Data reduction using three components resulted in the third component having only one variable with a loading greater that 0.5, hence, it did not contribute to a better interpretation or a significant reduction of the data. Loadings for each variable on the two principle component analysis were examined and two variables - total number of COs and total number of clove trees - were eliminated since they demonstrated low loadings (< 0.5) on both factors.
Thirteen variables were then used in the final analysis. The loadings for each variable using two components are provided in Table 4. Factor loadings and Scree plots are presented in
Table 4. Component loadings
Percent COs with Work Experience 0.558 0.060
Agricultural Development Index 0.520 -0.170
Percent of Total Variance Explained 37.801 31.271
Figure 2. The first component is interpreted as community complexity since all of the variables loading strongest and positively on this component are various community characteristics such as population size and administrative diversity of the village as well as several different development characteristics. Even the percent of COs with work experience can loosely be considered a community characteristic in relation to the project context. The second component is interpreted as project effort since all the variables loading highest and positively on this component are project inputs (number of events) or outputs (number persons trained). Hence this component tends to be a holistic measure of project activity – total effort.
Figure 2. Plot of factor loadings for two principle components and Scree plot using thirteen variables
Factor Loadings Plot
Both principle components – community complexity and project effort – are correlated with the milestone/progress score (Table 5). Community complexity is negatively correlated with progress. This is expected since all of the variables loading most strongly on this component are individually, negatively correlated with progress. Again, this reinforces results from the individual zero order correlations that less developed, smaller villages with fewer
administrative divisions make faster progress. This fits with Ostrom’s (1994) institutional design principles for community-based management of common pool resources whereby smaller more homogeneous groups tend to be more successful.
Table 5. Correlations between principle components and milestone score
Principle Component R Prob.
Community Complexity -0.442 0.030
Project Effort 0.574 0.003
N = 24
Stepwise forward multiple regression using the milestone/progress score as the dependent variable resulted in three independent variables being entered into the equation (Table 6). One case was eliminated in this analysis due to missing data. Total number of events, CO homophily score and average years of CO work experience were included in the model. Total number of events and homophily score contributed positively to the progress score. CO work experience contributed negatively. Total number of events and homophily score
will not produce favorable results and may be a primary reason why many CB-CRM efforts tend to fail.
Table 6. Results of Forward Stepwise Regression
Independent Variable Coefficient Std Error Std Coef Tol. df F P
Total Number of Events 0.219 0.057 0.564 0.95435 1 14.639 0.001
CO Homohpily score 0.011 0.003 0.443 0.99134 1 9.394 0.006
Avg. Yrs. of CO Work Experience -0.140 0.079 -0.261 0.96074 1 3.155 0.091 N = 23, R = 0.765, R-Squared = 0.586
Conclusions and Recomendations
There are remarkable similarities between the results of this study in Indonesia and those obtained by Pollnac et al. (2001) in the Philippines. Villages with smaller populations and stronger leadership support were predictors of success in the Philippines study and were significant in this analysis as well. Hence, these factors seem to have widespread
applicability for community-based management programs. Villages with less administrative diversity (number of sub-villages) also had higher progress scores in this study. This may also be an indicator of village population. Regardless, smaller less complicated communities tend to be easier to achieve progress.
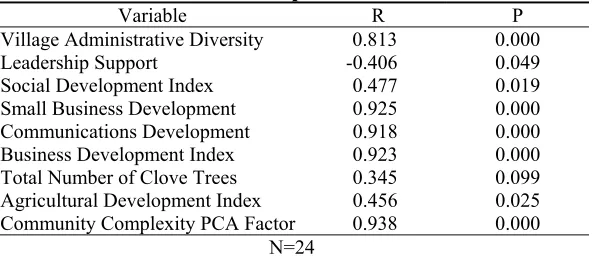
There were also a number of unexpected differences between the Philippine and Indonesia studies. Several development indicators were correlated with progress in this study whereas none were correlated with success in the Philippines. Data used from the Indonesia census statistics as the basis for development and complexity measures may be better indicators than those used in the Philippines. However, the community complexity PCA factor as well as every community attribute correlated with progress are also significantly correlated with population (see Table 7). Hence, most of the development indicators used in Indonesia may only be surrogate measures of village size. Further research is needed to determine whether these results and the differences in indicators truly reflect accurate levels of development, or just village size or complexity. Village complexity fits well with community-based
management theory and this may be the underlying causal factor of the empirical results generated.
Table 7. Correlations between village population in 2000 with selected independent variables
Variable R P
Village Administrative Diversity 0.813 0.000
Leadership Support -0.406 0.049
Social Development Index 0.477 0.019
Small Business Development 0.925 0.000
Communications Development 0.918 0.000
Business Development Index 0.923 0.000
Total Number of Clove Trees 0.345 0.099
Agricultural Development Index 0.456 0.025 Community Complexity PCA Factor 0.938 0.000
N=24
difference in mean population sizes between mainland and small island communities in this study. Hence, population size rather than physical geography may play a more important determinant role.
Tourism was not a predictor of success in Indonesia as it was for one analysis the Philippines Pollnac (in press). This may be due to the fact that Likupang project activities have not emphasized tourism development and no CB-MPAs in North Sulawesi at this time are earning revenues from diver tourism. This is in contrast to the Philippines where some CB-MPA sites are earning significant revenues from rural sites such as on Apo Island in
municipalities located in proximity to the large urban centers (White et al. 2001). It may also be too early in the process for any of the Indonesian CB-MPAs to have obtained tourism benefits yet. The Pollnac (in press) study in the Philippines was undertaken after the CB-MPAs had been established for at least three years, allowing substantial time to start generating benefits in the form of dive tourism revenues. In contrast, only a few of the Indonesian MPAs were formally established at the time of this analysis and several sites are mangrove MPAs that have no potential as dive tourism sites. The lack of emphasis on promoting dive tourism revenues in the MPA development and management strategy in Indonesia may also be a factor.
CRM and facilitation trainings were not significantly correlated with progress even though senior project managers felt this was important. This is may be due to the fact that most villages had received this training so at this stage in the process little variance is exhibited in the data. This does not mean these training events are unimportant, and they may well be. However, they did not seem to be useful individual indicators for this analysis.
FEO characteristics were not significantly correlated with progress. Hence it would seem that the range of variation in the background and skills of the current cohort of FEOs is adequate. This should be factored into hiring policies in the future. In addition, the training and orientation that these FEOs received prior to and during their field service should also be provided to new inexperienced hires.
Communications skills of COs was inversely correlated with progress. Several possible explanations have been provided for this unusual result. Given the uncertainty in understanding the reasons behind this, it should not be used as a recommendation in CO selection practices until further research has been undertaken. In future sites, projects should work closely with the villages to select as many COs as possible since the total number of COs was significantly correlated with progress. They can be of any age, marital status or gender. However, they should have homophilous characteristics in relation to the general community with respect to ethnicity, religion and educational attainment. This analysis also suggests government experience or membership in community organizations should not be a requirement
by the community. However, as previously mentioned, homophilous characteristics of COs including ethnicity, religion and educational attainment do seem to be important at the intra-community level.
Interestingly, no gender variables were significantly correlated with progress in this analysis, either with respect to the project activity variables or with respect to FEO and CO
characteristics. This would seem to go against conventional wisdom. There are two possible explanations. First, gender may not be important to achieving the success measures used here. It should be noted that the progress score quantifies outputs such as ordinances, plans and organizations and does not measure any variables concerning individual behaviors or attitudes or social equity. Therefore the outputs could conceivably be achieved with little or no inputs from female members of the community, particularly if village institutions are male dominated, which tends to be the case. In addition, the primary stakeholders for MPA
designation are fishers, a male dominated activity. However, another possibility is that the project has adequately addressed gender issues so that they do not show up as a relevant factor towards making progress. Extension officers have often remarked on the importance of informal participation and education, which is not captured in any of the more formal progress measures such as attendance at public meetings and training events. Therefore, we have no way of assessing how informal interactions have influenced results.
A better understanding is needed of how FEOs and COs influence success. In this study, FEO backgrounds and skills did not seem to be important. Until more research is conducted, hiring FEOs with the characteristics that experienced extension agents suggest would be wise. Many characteristics of COs also seemed unimportant except homophilous characteristics and total number of COs. In addition, the relationship of lower CO communications skills with progress is also puzzling. Different ways of measuring skill attributes should be tested to validate these initial findings and to rule out possible methodological biases.
In summary, specific recommendations particularly for large-scale projects working at multiple sites, are as follows:
• Concentrate activities in villages with relatively smaller populations and with a small number of sub-villages.
• Choose villages with less farming and more fishing orientation as well as those with low levels of social and communications infrastructure, as well as less business development.
• Use existing and readily available village census statistics to prioritize villages targeted for community-based interventions based on criteria suggested above.
• Select villages where local leadership support for the project is strong. Assess this carefully before inviting villages to participate in the program.
• Select COs that have ample time to devote to community organizing and encourage communities to select as many volunteers as possible.
• Select COs that are homophilous with the general population of the community.
• Maximize the number of training events and participants to build community capacity.
• Ensure a highly participatory process that allows for maximum input from community members through formal meetings as well as informal discussions.
supervising staff. In addition, monitoring of number of training events and meetings as well as total number of participants in all events would seem to be valid indicators of intermediate progress.
It must be kept in mind that the above mentioned relationships are probabilities and therefore do not predict with absolute certainty whether any particular site will be successful, or whether any particular FEO or CO will perform adequately. However, we can increase the likelihood of success through several strategies. First, careful community selection should be accomplished through a triage process using key context variables and assessments of
leadership support. A community-based approach is not appropriate for all villages and ones where the likelihood of success is low should not be asked to participate in the program. This is particularly important where project resources are not sufficient to have all villages
participate and therefore some selection criteria and culling process will be necessary. Projects that are working in multiple sites can choose a subset of all potential sites where the probability of success will be greatest. If there is a need or desire to include all villages, projects should plan on a longer time frame and greater resource inputs for those villages where success is less likely (more difficult). However, this strategy does not consider ecological criteria in the community selection process. Ideally an additional layer of ecological criteria should be considered, especially for establishing an interconnected network of CB-MPAs.
Based on these findings, strategies for projects that use simultaneous interventions in
multiple communities should be adjusted. This includes targeting villages more amenable to community-based interventions. This is likely to increase the probability of success and result in a better return on investments made by local governments and international donors in community-based marine conservation initiatives.
Acknowledgements
We would like to thank the staff of the Indonesia Coastal Resources Management Project in North Sulawesi for their cooperation and assistance in collecting the data used in this study. In particular, their expert opinion on extension officer and community organizer attributes to empirically test were invaluable. Their expressed interest and desire to apply these results in subsequent activities is commendable.
References Cited
Alcala, A.C. 1988. Effects of marine reserves on coral fish abundance and yields of Philippine coral reefs.
Ambio 17(3): 194-199.
Alcala, A.C. 1998. Community-based coastal resource management in the Philippines: a case study. Ocean and Coastal Management. 38:179-186.
Alcala, A.C. 2001. Marine Reserves in the Philippines: Historical Development, Effects and Influence on Marine Conservation Policy. The Bookmark Inc. Makati City, Philippines. 115p.
Alder, J. 1996. Have tropical marine protected areas worked? An initial analysis of their success. Coastal Management 24:97-114.
BPS. 1992 Statistik Potensi Desa Tahun 1992. Biro Pusat Statistik, Sulawesi Utara, Indonesia.
BPS. 1996 Statistik Potensi Desa se-Sulawesi Utara1996. Biro Pusat Statistik, Sulawesi Utara, Indonesia.
Carr, M., et al. 2003. Comparing marine and terrestrial ecosystems: implications for the design of coastal marine reserves. Ecological Applications 13(1):90-107.
Crawford, B.R., I. Dutton, C. Rotinsulu, L. Hale. 1998. Community-Based Coastal Resources Management in Indonesia: Examples and Initial Lessons from North Sulawesi. pp. 299-309. In: Proceedings: International Tropical Marine Ecosystem Management Symposium, Townsville, Australia.
Crawford, B.R., P. Kussoy, A Siahainenia and R.B. Pollnac, 1999. Socioeconomic Aspects of coastal resources use in Talise, North Sulawesi. Proyek Pesisir Publication. University of Rhode Island, Coastal Resources Center, Narragansett, Rhode Island, USA. 67p.
Crawford, B., M. Balgos and C. R. Pagdilao. 2000. Community-Based Marine Sanctuaries in the Philippines: A Report on Focus Group Discussions. Coastal Management Report # 2224. PCAMRD Book Series No. 30. Coastal Resources Center, University of Rhode Island, Narragansett, RI, USA, and Philippine Council for Aquatic and Marine Research and Development, Los Banos, Laguna, Philippines. 84p.
CRMP. 2002. Project Monitoring and Performance Reports. Indonesia Coastal Resources Management Project. Coastal Resources Center, University of Rhode Island, Narragansett Rhode Island, USA.
Dahuri, R. and I. Dutton. 1999. Integrated Coastal and Ocean Management Enters a New Era in Indonesia.
Integrated Coastal Zone Management 1: 11-16.
Ferrer, E. M., L. Polotan-Dela Cruz and M. Agoncillo-Domingo (Eds.). 1996. Seeds of hope: A collection of case studies on community based coastal resources management in the Philippines. College of Social Work and Community Development, University of the Philippines, Diliman, Quezon City, Philippines. 223p.
Francis, J. A. Nilsson and D. Waruinge. 2002. Marine protected areas in the East Africa region: how successful are they? Ambio 31(7-8): 503-511.
Gell, F.R. and C.M. Roberts. 2003. The fishery effects of marine reserves and fishery closures. WWF-US. Washington D.C. USA.
Halpern, B.S. and R.R. Warner. 2002. Marine reserves have rapid and lasting effects. Ecology Letters 5: 361-366.
Halpern, B.S. 2003. The impact of marine reserves: do reserves work and does size matter? Ecological Applications 13(1): 117-137.
Hanson, A. I. Augustine, C.A. Courtney, Akhmad Fauzi, Sarah Gammage, Koesoebiono. 2003. Proyek Pesisir: an assessment of the coastal resource management project (CRMP) in Indonesia. Coastal Resources Center, University of Rhode Island, Narragansett Rhode Island USA. 158p.
Horrill, J.C., H. Kalombo and S. Makoloweka. 2001. Collaborative Reef and Reef Fisheries Management in Tanga, Tanzania. Tanga Coastal Zone Conservation and Development Programme, IUCN Eastern Africa Programme. 37p.
Jameson, S.C., M. Tupper and J.M. Ridley. 2002. Three screen doors: can marine “protected” areas be effective? Marine Pollution Bulletin 44:1177-1183.
Johannes, R.E. 1998. Government-supported, village-based management of marine resources in Vanuatu.
Ocean and Coastal Management 40: 165-186.
King, M. and U. Faasili. 1998. A network of small, community-owned village fish reserves in Samoa. Parks
8(2):11-16.
Kussoy, P., B.R. Crawford, M. Kasmidi dan A. Siahainenia. 1999. Aspek Sosial-Economi untuk Pemanfaatan Sumberdaya Pesisir di Desa Blongko Sulawesi Utara. Technical Report. Coastal Resources Center, University of Rhode Island, Narragansett, Rhode Island, USA.
Lubchenco, J. S. Gaines, R. Warner, S. Arame and B. Simler. (eds.) 2002. The science of marine reserves. Partnership for interdisciplinary studies of coastal oceans (http//www.piscoweb.org). 22p.
McClanahan, T.R. 1999. Is there a future for coral reef parks in poor tropical countries? Coral Reefs 18: 321-325.
McClanahan, T.R. and Mangi, S. 2001. Spillover of exploitable fishes from a marine park and its effect on the adjacent fishery. Ecological Applications 10: 1792-1805.
Minahasa Law No. 2 of 2002 on integrated community-based management of coastal resources. (Peraturan Daerah Kabupaten Minahasa Nomor 2, Tahun 2002, Tentang Pengelolaan Sumberdaya Wilayah Pesisir Terpadu Berbasis Masyarakat di Kabupaten Minahasa Dengan Rahmat Tuhan Yang Maha Esa Bupati Minahasa.
National Law No. 22 of 1999 on regional autonomy (Undang-Undang Republik Indonesia No. 22, 1999, Tentang Pemerintahan Daerah Dengen Rahmat Tuhan Yang Maha Esa Presiden Republik Indonesia)
NRC. 1999. Sustaining Marine Fisheries. Committee on Ecosystem Management for Sustainable Marine Fisheries, National Research Council. National Academy Press. Washington D. C. 164p.
NRC. 2001. Marine Protected Areas: Tools for Sustaining Ocean Ecosystems. National Research Council. National Academy Press. Washington DC. 272p.
Olsen, S.B., J. Tobey and L.Z. Hale. 1998. A learning based approach to coastal management. Ambio 27(8): 611-619.
Ostrom. E. 1994. Institutional analysis, design principles and threats to sustainable community governance and management of the commons. pp. 34-50. In: Pomeroy, R. S. (ed.), Community management and common property of coastal fisheries in Asia and the Pacific: concepts, methods and experiences. ICLARM (International Center for Living Aquatic Resources Management) Conference Proceedings 45. ICLARM, Manila, Philippines.
Pajaro, M., F. Olano, B. San Juan. 1999. Documentation and review of marine protected areas in the
Philippines: a preliminary report. Haribon Foundation for the Conservation of Natural Resources. Metro Manila, Philippines.
Palumbi, S. 2002. Marine reserves as a tool for ecosystem based management and conservation. Pew Oceans Commission, Arlington, Virginia.
Patlis, J., R. Dahuri, M.K. Knight and J. Tulungen. 2001. Integrated management in a decentralized Indonesia: how it can work. Pesisir dan Lautan (Journal of Coastal and Marine Resources) 4(1): 24-39.
Patlis, J. 2003. The role of law and legal institutions in determining the sustainability of integrated coastal management projects in Indonesia. Jurnal Pesisir dan Lautan (Journal of Coastal and Marine Resources Special Edition).
Patlis, J., N. A. Tangkilisan, D. Kawar, M.E. Ering, J. Tulungen, R. Titahelu, M. Knight. 2003. Case study developing a district law in Minahasa on community-based integrated coastal management. Coastal Resources Center, University of Rhode Island, Narragansett, Rhode Island, USA. 60p.
Pollnac, R.B. (in press) Multiple Component Assessment of Coral Reef Marine Protected Areas. World Resources Institute.
Pollnac, R.B., C. Rotinsulu and A. Soemodinoto. 1997a. Rapid Assessment of Coastal Management Issues on the Coast of Minahasa. Proyek Pesisir Technical Report No: TE-97/01-E. Coastal Resources Center, University of Rhode Island, Narragansett, Rhode Island, USA. 67p.
Pollnac, R.B., F. Sondita, B. Crawford, E. Mantjoro, C. Rotinsulu and A. Siahainenia. 1997b. Baseline Assessment of Socioeconomic Aspects of Resources Use in the Coastal Zone of Bentenan and Tumbak. Proyek Pesisir Technical Report No: TE-97/02-E. Coastal Resources Center, University of Rhode Island, Narragansett, Rhode Island, USA. 79p.
Pollnac, R.B., B. Crawford, C. Rotinsulu, P. Kussoy and A. Siahainenia. 1998. An Examination and Comparison of Rumbia and Minanga: Control Villages for the Coastal Resource Management Project Sites at Bentenan and Tumbak.” Proyek Pesisir Publication TE-98/01-E. Coastal Resources Center, University of Rhode Island, Narragansett, Rhode Island, USA. pp. 41.
Pollnac, R. B., B.R. Crawford and M. Gorospe. 2001. Factors Influencing the Success of Community-Based Marine Protected Areas in the Visayas, Philippines. Ocean and Coastal Management 44:683-710. Pajaro, M., F. Olano, B. San Juan. 1999. Documentation and review of marine protected areas in the
Polotan-de la Cruz, L. 1993. Our Life Our Sea. Proceedings of the seminar workshop on community-based coastal resources management. February 7-12, 1993, Silliman University, Dumaguete City, Philippines. Voluntary Services Overseas, Quezon City, Philippines. 95p.
Pomeroy, R. S. (ed.). 1994. Community management and common property of coastal fisheries in Asia and the Pacific: concepts, methods and experiences. ICLARM (International Center for Living Aquatic Resources Management) Conference Proceedings 45. ICLARM, Manila, Philippines.
Pomeroy, R.S. 1995. Community-based and co-management institutions for sustainable coastal fisheries management in Southeast Asia. Ocean and Coastal Management 27(3): 143-162.
Pomeroy, R. and M.B. Carlos. 1997. Community-based coastal resources management in the Philippines: a review and evaluation of programs and projects, 1984-1994. Marine Policy 21(5): 445-464.
Rogers, E. M. 1995. Diffusion of Innovations. The Free Press. New York.
Rudd, M.A., M.H. Tupper, H. Folmer and G.C. van Kooten. 2003. Policy analysis for tropical marine reserves: challenges and directions. Fish and Fisheries 4: 65-85.
Russ, G.R. and A.C. Alcala. 1994. Sumilon Island Reserve: 20 years of hopes and frustrations. Naga: The ICLARM Quarterly 7(3): 8-12.
Russ, G.R. and A. Alcala. 1996. Do marine reserves export adult fish biomass? Evidence from Apo Island, Central Philippines. Marine Ecology 132:1-9.
Sukmara, A., B.R. Crawford, dan R.B. Pollnac. 2001. Pengelolaan Sumberdaya Pesisir Berbasis-Masyarakat: Penilaian Sementara Terhadap Desa Proyek Pesisir di Talise, Minahasa, Sulawesi Utara. Technical Report TE-01/05-I. University of Rhode Island, Coastal Resources Center, Narragansett, Rhode Island, USA. 55p.
Taryoto, A.H.W. 2002. Towards Decentralized Integrated Coastal Management Policy in Indonesia. Ministry of Marine Affairs and Fisheries, Jakarta, Indonesia.13p.
Tulungen, J.T,. B.P. Devi dan C. Rotinsulu. 2000. Pengelolaan Pengembangan, Persetujuan dan Pelaksanaan Rencana Pembangunan dan Pengelolaan Sumberdaya Wilayah Pesisir Berbasis-Masyarakat di Sulawesi Utara. Dalam: Proceeding Konferensi Nasional II: Pengelolaan Sumberdaya Pesisir dan Lautan, Makkassar, Sulawesi Selatan. 15 – 17 Mei 2000.
Tulungan, J.T., S. Putra, F. Pua and B. Crawford. 1999. Decentralized Coastal Resources Management in Indonesia: the Case of North Sulawesi Province. Regional Development Journal. (In Indonesian -Decentralisasi Pengelolaan Sumberdaya Wilayah Pesisir di Indonesia: Kasus Propinsi Sulawesi Utara)
Jurnal Pembangunan Daerah 3(2): 43-53.
Veitayaki, J. 1998. Traditional and community-based marine resources management system in Fiji: an evolving integrated process. Coastal Management 26:47-60.
Wantiez, L., P. Thollot and M. Kulbicki. 1997. Effects of marine reserves on coral reef fish communities from five islands in New Caledonia. Coral Reefs 16: 215-224.
Ward, T.J., D. Heinemann and N. Evans. 2001. The role of reserves as fisheries managemernt tools: a review of concepts, evidence and international experience. Bureau of Rural Sciences; Agriculture, Fisheries and Forestry – Australia. Canberra, Australia, 192p.
White, A.T. 1989. Two community-based marine reserves: lessons for coastal management. P. 85-96. In T.E. Chua and D. Pauly (eds.) ICLARM Conf. Proc. 19. Ministry of Science, Technology and the
Environment, Kuala Lumpur, Johor State Economic Planning Unit, Jahore Bahru, Malaysia, and International Center for Living Aquatic Resources management, Metro Manila, Philippines. 254p.
White, A.T. and G.C. Savina. 1987. Reef fish yield and non-reef catch of Apo Island, Negros, Philippines.
Asian Marine Biology 4: 67-76.
White, A. T., L.Z. Hale, Y. Renard and L. Cortesi. (eds.) 1994. Collaborative and community-based
management of coral reefs: lessons from experience. Kumarian Press, West Hartford, Connecticut, USA. 124p.
White, A.T., H.P. Vogt and T. Arin. 2000. Philippine Coral Reefs under threat: the economic losses caused by reef destruction. Marine Pollution Bulletin 40(7): 598-605.
World Bank. 1998. Project Appraisal Document: Coral Reef Rehabilitation and Management Project. Rural Development and Natural Resources Sector Unit, Indonesia Country Management Unit, East Asia and Pacific Region, World Bank. Washington D.C. USA.