What Happens to the Careers of
European Workers When Immigrants
“Take Their Jobs”?
Cristina Cattaneo
Carlo V. Fiorio
Giovanni Peri
Cattaneo, Fiorio, and Periabstract
Following a representative longitudinal sample of native European residents over the period 1995–2001, we identify the effect of the infl ows of immigrants on natives’ career, employment, and wages. We control for individual, country- year, occupation group- year, and occupation group- country heterogeneity and shocks, and construct an imputed infl ow of the foreign- born population that is exogenous to local demand shocks. We fi nd that native European workers are more likely to move to occupations associated with higher skills and status when a larger number of immigrants enters their labor market. We fi nd no evidence of an increase in their probability of becoming unemployed.
I. Introduction
There is debate on the effect that immigrants have on the labor market opportunities of natives (Borjas 2003; Borjas, Grogger, and Hanson 2008; Card 2001, 2009; Card and DiNardo 2000; Ottaviano and Peri 2012). As immigrants concentrate their labor supply in some occupations, their effect on natives depends on how much these occupations compete with, or instead complement, natives’ jobs. The effect also
Cristina Cattaneo is senior researcher at Fondazione Eni Enrico Mattei- FEEM, Milan, Italy. Carlo V. Fiorio is an associate professor of public economics at the Department of Economics, Management and Quantita-tive Methods, University of Milan, Senior researcher at Irvapp, Trento and Research Fellow at Dondena, Milan, Italy. Giovanni Peri is full professor of economics at the Department of Economics, University of Cal-ifornia, Davis, U.S.A. The authors thank two anonymous referees for helpful comments and the Fondazione Rodolfo Debenedetti for its support. Participants to the CReAM Immigration conference (London), MILLS Workshop (Milan), and the European Economic Association Meetings (Gothenburg) also provided useful suggestions. This paper was partly funded within the EC project “Sustainable Development in a Diverse World,” VI Framework Program. The data used in this article may be acquired from the Eurostat and from IPUMS- International. The authors are willing to advise other scholars on the application process.
[Submitted March 2013; accepted April 2014]
ISSN 0022- 166X E- ISSN 1548- 8004 © 2015 by the Board of Regents of the University of Wisconsin System
depends on the response of natives to immigration as they may change their occupa-tion to take advantage of their specifi c skills vis- a- vis immigrants (Peri and Sparber 2009, D’Amuri and Peri 2014).
The literature has so far mainly analyzed the aggregate effects of immigration us-ing the regional or national wages and employment of natives (or groups of natives) as outcomes. Researchers have constructed average wages or employment rates for region/skill groups and estimated the impact of immigration on the average outcomes in the group, constructed using repeated cross- sections of individuals. Most of these studies fi nd small wage and employment effects of immigration on natives both in Europe (Dustmann, Frattini, and Preston 2013; D’Amuri, Ottaviano, and Peri 2010; Glitz 2012) and in the United States (Ottaviano and Peri 2012; Card 2009). There are, however, some signifi cant exceptions (Borjas 2003, 2006). A problem of this approach is that labor markets are in continuous fl ux. People enter and exit labor markets as well as skill groups. This alters the composition of individuals over time in the market (cell) so that the wage effects of immigration identifi ed at that level can be due to changes in wages of individuals or to changes in the composition of individuals in the analyzed cell. In particular, the average outcome of a labor market cell may change because of entry and exit of different workers or because of a change in outcome of incumbent workers. The aggregate analysis can mask differentiated effects of immigration on the incumbents or on the selection of potential entrants and those who exit.
Our analysis asks the less- explored question: How much does immigration affect the occupation and wage of an incumbent native if one follows him/her over time after a signifi cant infl ow of immigrants? What happens to native workers over the following years when immigrants take jobs in the same labor market as theirs? This is a very im-portant complement to the aggregate question as it focuses on incumbents and their in-dividual effects. By comparing similar workers, some of whom were exposed to large infl ows of immigrants and others who were not, and following them over time, we analyze how competition and complementarity with immigrants affected their careers.
This way of analyzing the effects of immigrants has interesting implications. First, we can control for heterogeneity at the individual level, reducing the scope for omitted variable bias. Second, this method is closer to the idea of evaluating the gain/losses for incumbent native workers when exposed to immigrant competition. Third, it moves the literature on labor market effects of immigration closer to the analysis of individual effects of aggregate shocks (globalization, technology). To the best of our knowledge, this is one of the fi rst papers analyzing the effects of immigration on individual labor market outcomes, following people over time.1
The data requirements to implement this type of analysis are larger than those needed for repeated cross- section cell- based regressions. We need longitudinal panel data for a representative sample of native individuals. The data must include demo-graphic and labor market information and provide their location. Further, the data should capture a country (or an economy) during a period in which it received a sig-nifi cant infl ow of immigrants. At the same time, we need an aggregate data set to
Cattaneo, Fiorio, and Peri 657
construct accurate measures of the local immigration fl ows for the receiving labor markets. The European Community Household Panel (ECHP) provides a representa-tive longitudinal sample of narepresenta-tives for one of the largest economies in the world: the European Union. The ECHP is a European survey that was designed to provide a rep-resentative and cross- nationally consistent picture of households and individuals on a range of topics including income, health, education, housing, demographics, and em-ployment characteristics. The survey, designed as a longitudinal panel, was conducted between 1994 and 2001 in eight successive waves in the EU- 15 European countries using a standardized methodology. The ECHP was designed to be representative for native households. Hence, while we use this survey to track the outcomes of natives, we use the harmonized European Labour Force Survey (ELFS) to compute the share of immigrant population by country, year, and occupation group. The ELFS is a larger database and is representative of the whole population in EU countries. It is, however, a repeated cross- section.
We consider individual outcomes and labor- market immigration shocks so that the reverse causality issues are reduced. However, the infl ow of immigrants in country/oc-cupation cells may be correlated with unobserved economic and labor market shocks that may affect native careers causing an omitted variable bias. In order to estimate the casual impact of immigrants on individual outcomes, we use an instrumental variable approach. The method is a variation on the so- called “enclave” instrument fi rst used by Altonji and Card (1991), followed by Card (2001), Peri and Sparber (2009), and Lewis (2011) (among others), and now broadly used in this literature. We construct the imputed infl ow of immigrants allocating the aggregate fl ows by country of origin between 1991 and 2001 in proportion to the 1991 immigrant distribution across coun-tries and occupations. We then use these imputed fl ows as an instrument for actual immigrant fl ows. This instrument uses the historical location of immigrants and ag-gregate immigration shocks to predict country- occupation specifi c immigration. We will discuss further the advantages and the caveats for this identifi cation approach.
This paper focuses on the effect of immigration on natives, who in this paper are defi ned as persons born in the specifi c country.2 There are four main
fi ndings. First, an infl ow of immigrants generates a higher probability that a native worker moves to a higher occupational level within the next year.The effect is statistically and economically signifi cant. We fi nd this result by fi rst grouping occupations in four levels (or “tiers”) that are ranked in terms of wage, education, and social status, from lower to higher: “Elementary,” “Clerical and Craft,” “Technical and Associate,” and “Professional and Manager.” Hence, we estimate that an increase of immigrants by one percentage point of employment in the occupation- cell increases the probabil-ity for a native worker to move to a higher ranked tier by 0.38 percentage points. As the average probability of an annual upgrade to a higher occupational tier for a native worker is 8.8 percentage points, increasing the immigrant share in a cell by four percentage points of employment (its standard deviation in the sample) would increase the probability of upward mobility by 1.5 percentage points. This is a 17 per-cent increase over the average. Second, we fi nd that in response to immigration there is no change in the probability that a native worker joins unemployment in any of
the following three years. Third, we also fi nd some evidence that immigration in-creases wages of natives, with some lags (one to two years). The immediate upgrade in response to immigration and the delayed wage gain is compatible with an effect of moving natives toward a better career path, still requiring some time to accumulate specifi c human capital in the new occupation. Results also suggest that natives move away from self- employment in response to immigration, probably because immigrants themselves are more likely to be self- employed. Fourth, workers both in lower and upper tiers are signifi cantly more likely to experience occupational upward mobility as a consequence of immigrant competition though the coeffi cient is much larger for workers starting at high tiers. All these effects indicate a dynamic response of natives along the occupational dimension, which may benefi t natives in the long run. At the very least, the occupational upgrade protects native individuals on average from the potential competition effect of immigrants, which could be detrimental if they stay in the original job.
Overall, it appears that immigrants speed up the transition of natives to higher- ranked occupations, which are complementary to lower- ranked ones. The rest of the paper is organized as follows. Section II frames the contribution of this paper within the existing literature. In Section III, we present the empirical framework of analysis. Section IV presents the data set and the main variables, and Section V describes our main results. Section VI extends the analysis and performs robustness checks, and Section VII concludes the paper.
II. Literature Review
Cattaneo, Fiorio, and Peri 659
The immigration literature has not, to the best of our knowledge, used individual panel data to measure the effects on natives. Individual panel data allow us to follow individuals during and after immigrants move into their country/occupation and to analyze the impact on their labor market outcomes over one or more years. Peri and Sparber (2011) analyze the substitutability of highly educated natives and foreigners by tracking natives’ occupations at two points in time. They then assess how an infl ow of immigrant workers with graduate degrees affects the occupation of highly educated natives. In their paper, however, only yearly changes in occupation are recorded and no medium- run effects are considered.
The use of individual panel data to track the medium- and long- run transition has been confi ned to the analysis of other types of shocks. For instance, Von Wachter, Song, and Manchester (2007); Neal (1995); and Stevens (1997) (among others) ana-lyzed the impact of mass layoffs on employment and wages of individuals who were subject to those shocks by following them for years after the mass layoffs. Oreopulos, von Wachter, and Heisz (2012) analyzed the medium- and long- run effects of a reces-sion at the beginning of one’s career. Bartel and Sicherman (1998) studied the effect of technological change on employee training. Zoghi and Pabilonia (2007) analyzed the effect of the introduction of computers on individual wages. Dunne et al. (2004), using establishment- level data, assessed the effect of computer investment on the dispersion of wages and productivity. All of these papers consider aggregate shocks and track their effects on individual panel data. Although this is common in the labor literature, it is rarely done when analyzing the long- run impact of immigration.
The present paper brings individual panel data and a strategy similar to the one used to identify the effects of recession, layoffs, and technological change to the study of the impact of immigration on native workers’ labor market outcomes. This is par-ticularly important if natives respond to immigration by changing their specialization (as suggested in Peri and Sparber 2009), or by investing in fi rms’ specifi c skills (as suggested by the wage dynamics in Cohen- Goldman and Paserman 2011), or by un-dertaking other changes. These responses, in fact, may take some time to manifest.
III. Empirical Framework and Implementation
Let us begin by presenting the empirical framework that we adopt in our analysis. We also discuss in this section important issues related to the identifi ca-tion strategy and to the construcca-tion of the instruments.
A. Basic Specifi cation
Our basic specifi cation relates the presence of immigrants working in the same occupation- country- year cell of natives to several outcomes of native individuals. In particular, we defi ne fjct as the number of foreign- born workers in occupation j and country c and year t relative to total workers in that cell. The immigrant infl ows are matched to the individual observations by occupation- country- year. Denoting yit a specifi c outcome for individual i at time t, we estimate the following specifi cation:
In Specifi cation 1, the outcome y will be, alternatively, a variable measuring the oc-cupational mobility (or the ococ-cupational attainment) of a worker, a dummy for unem-ployment status, the logarithm of income, or a dummy for self- emunem-ployment status. The term t is a set of year effects, which controls for common time effects. l,c is a set of occupational- level (l) by country (c) fi xed effects, which captures country- specifi c heterogeneity in relative demand. Occupational- level (or “tier”) l is the aggregation of occupations j allowing a ranking of occupations from lower to higher (more on this in Section IV below) as follows: “Elementary,” “Clerical and Craft,” “Technical and As-sociate,” and “Professional and Manager” (see Table 1). We include all the possible pair- wise interactions between country c, year t, and occupational- level l (c,t, l,t, l,c
).3 These fi xed effects capture country- specifi c fi nancial and macroeconomic shocks, occupation- level demand shocks, and the potential heterogeneity of demand and im-migration across country and occupation levels. Their inclusion brings the identifi cation based on this approach close to that of national- level studies (such as Borjas 2003, Ottaviano and Peri 2012). In those studies, once the authors have controlled for fi xed effects, the remaining variation of immigrants in a cell is assumed to be driven by supply shocks and OLS estimation is applied. We instead worry about potential linger-ing country- occupation specifi c demand shocks, and we devise an instrument (de-scribed below) based on a shift- share approach at the European level. Finally, we also included the term i, capturing a set of individual fi xed effects fully controlling for the individual heterogeneity in all specifi cations but those measuring occupational mobil-ity, which is an outcome already defi ned as a difference over time for one individual.
Given the longitudinal structure of our data set, we also estimate a specifi cation that includes lags of the immigrant share in order to see whether some effects of immigra-tion on native workers occur with a lag:
3. We do not include specifi c occupation (nine groups) fi xed effects and their interactions as all our occupa-tional mobility and occupaoccupa-tional attainment variables are defi ned for occupational levels, which allow for a clear ranking of occupations.
Table 1
The Skill Content of Occupations
Occupation Levels or Tiers Occupation (ISCO Code–1 Digit) First: “elementary occupations” 9. Elementary occupations Second: “clerical and craft
occupations”
4. Clerks
5. Service workers and shop and market sales workers
6. Skilled agricultural and fi shery workers 7. Craft and related trades workers
8. Plant and machine operators and assemblers Third: “technical and associate
professionals”
3. Technicians and associate professionals Fourth: “professional and
manager”
Cattaneo, Fiorio, and Peri 661
(2) yi,t =t+l,c+c,t+l,t+Xi,t+ r=0
R
∑
rfj,c,t−r+i,t.The fi rst outcome that we consider is an indicator of occupational mobility. Our data have a defi nition of occupations that can be organized (as we illustrate in the next section) into four tiers (or levels) with a clear ranking. These tiers are associated with different levels of wage, average education, and use of cognitive and complex skills. Ranking those tiers with respect to any of those variables would provide the same ordering. Our occupational mobility variable is a standardized index that takes the value of 0 if at time t the individual i works in the initial occupational level (the occupation the individual was employed in when he/she entered the sample)4 while it takes a value of +1 if he/she works in a higher tier one, or - 1 if he/she works in a lower ranked one. This variable, therefore, is an “index of occupational mobility” relative to the entry level. Based on this variable, we also created a dummy “upgrade oc-cupational mobility” index and a “downgrade ococ-cupational mobility” dummy, which isolate upward and downward mobility respectively, allowing for differential effects of immigrants on either side (“up” or “down”) of occupational mobility. We also consider a measure of occupational attainment, which reports the tier level (l) of individual i at year t and hence captures the absolute position of a worker in the occupational tiers.
The second outcome that we consider is the worker’s unemployment status. The outcome variable is a dummy equal to 1 if individual i is unemployed at time t and 0 if he/she is not. The third is the logarithmic income for individual i at time t, distin-guishing between yearly wage- salary earnings and yearly self- employment income. Finally, we consider an indicator that records entrepreneurial activity computed as a dummy equal to 1 if an employed person receives only wage and salary and no self- employment income and 0 otherwise.
B. Identifi cation and Instrumental Variable
The goal of the empirical analysis is to identify and consistently estimate the param-eter in Equations 1 and 2 so that it can be interpreted as the causal effect of im-migration on individual outcomes. Our imim-migration variable varies at the country- occupation- year group and we control with fi xed effects for each pair- wise interaction of country, year, and occupational- level. Labor market outcomes could differ across countries due to differences in institutions, sector of specialization, and other structural features. Hence, we control for country- occupation level fi xed effects (l,c). Changes in technology, such as adoption of computers, the progress of information technology, the change in the relative demand across skills, are controlled for by the inclusion of the occupation level by year fi xed effects (l,t). Country- specifi c shocks driven by political, fi nancial, or institutional evolutions are also controlled for by the inclusion of the country by year fi xed effects (c,t). Finally, the heterogeneity of native individu-als is controlled for either by differencing the dependent variable (as in the case of occupational mobility) or by including individual fi xed effects (i). The described fi xed effects absorb a large array of demand shocks and have been considered as suf-fi cient controls to identify a causal effect in national- level analysis (Borjas 2003,
Ottaviano and Peri 2012). Still, there can be omitted variables at the country- year level that cause estimation bias. Specifi c labor markets, defi ned as country cells, might be experiencing expansion or contraction of their labor demand in a certain year for specifi c reasons related to the interaction of technological change and specifi c country conditions. These shocks could affect the infl ow of immigrants, as well as individual outcomes for native workers, generating a spurious correlation. Hence, we adopt an instrumental variable strategy. Using the national censuses of 1991, we can observe the distribution of immigrants from nine different areas of origin to European countries and occupational groups.5 From the 1991 censuses, we can calculate the total number of foreign born from area of origin N in Europe, F1991
N . We then impute the share of European immigrants of nationality N who are in country c
and occupation j, shjN,c,1991, as the product of the country c’s share of European immi-grants of area of origin N, Fc,1991
N /F 1991
N and the occupation j share of European immi-grants of area of origin N, FjN,1991/F1991N , both measured in 1991. So we obtain:
N ).6 Such initial imputation reduces the risk of endogeneity of immigrant distribution to cell- specifi c economic conditions for two reasons. First, it uses variables measured in 1991 while the analysis is relative to the period 1995–2001. Second, it assumes independence between the country and occu-pational distribution of immigrants, preventing country- occupation specifi c factors in 1991 to affect it. We then use the OECD data on net migrant fl ows by area of origin into Europe (Ft
N) to obtain the total number of foreign born from each area in each year. In particular, the number of foreign born from area of origin N in Europe in year
t is constructed as Ft
N. Then we allocate the total number of immigrants from each area of origin to country- occupation cells according to their shares shj,c,1991
N . The “imputed” number of immigrants of area of origin N in occupation
j and country c in year t will therefore be: pFjN,c,t= oFtNshjN,c,1991. The total imputed num-ber of foreign born in that country- occupation cell is obtained by summing across areas of origin so that Fpj,c,t =NFpj,Nc,t. We then divide this imputed immigrant popula-tion in occupapopula-tion j and country c by the total imputed employment in that cell to ob-tain pfj,c,t =( pFj,c,t / pEmplj,c,t), where pEmplj,c,t is an imputed measure of employment, defi ned as the stock of natives in each country- occupation cell as of 1991, plus the total imputed number of foreign born in that country- occupation cell. We use pfj,c,t as instrument for fj,c,t, the employment share of foreign born in occupation j, country c, and period t.
The assumption behind this instrument is that the distribution of immigrants of spe-cifi c nationality across countries or occupations in 1991 is the result of historical settle-ments and past historical events. This initial distribution, combined with networks of information and individual preferences for their own kind, implies that new immigrants are more likely to move to the same country- occupations in which previous immigrants
5. The areas of origin that we construct are: Central and South America, Eastern Europe, Middle East Central Asia, North Africa, North America, Oceania- Pacifi c, Other Africa, South and Eastern Asia, Western Europe. 6. An alternative instrument was developed using the distribution of nationality N across occupations in the EU minus the destination country in the formula. Hence shjc1991
N =(F
Cattaneo, Fiorio, and Peri 663
of the same nationality operated. Hence, in periods of large aggregate immigrants in-fl ows that vary by country of origin, independently of labor market shocks, cells receive different infl ows of immigrants due to their initial different composition. The occupation specifi c changes in demand after 1991 do not affect at all the instrument. Moreover, the rich set of fi xed effects captures a large part of demand shocks. Hence, the variation of the instrument, after controlling for the fi xed effects, can be thought of as proxying for a supply- driven change in immigrants. It should, therefore, be corre-lated with the share of foreign born but not with the region- sector specifi c demand shocks. Let us emphasize again that our approach combines the fi xed effects controls used in the “national- level” approach with the imputed immigration instrumental vari-able used in the area approach. Also, in constructing the instrument pfj,c,t, we use census data from European countries in 1991 to compute the initial shares and aggregate OECD fl ows of immigrants to European countries to measure the total fl ows by nation-ality. The independent variable, fj,c,t, is taken instead from the European Labor Force Survey (as described below), available only between 1995–2001. Hence, using a dif-ferent, much larger (census) and lagged in time (1991) data set to construct the IV should also reduce the measurement error bias and increase the exogeneity of the IV.
IV. Data and Summary Statistics
The main data set used is the European Community Household Panel (ECHP), a survey that involves annual interviewing of a representative panel of house-holds and individuals in each EU- 15 country. The total duration of the ECHP was eight years, running from 1994 to 2001. In the fi rst wave, a sample of around 60,500 nationally representative households—including approximately 130,000 adults aged 16 years and older—were interviewed in the EU- 12 Member States. Austria, Finland, and Sweden (which joined the European Union in 1995) joined the ECHP project in 1995, 1996, and 1997, respectively. Two major areas covered in considerable detail in the ECHP are the economic activity and personal income of the individuals inter-viewed. Information on other topics such as health, education, housing, demographics, and employment characteristic was also provided.
The important feature of ECHP is its longitudinal panel structure. Within each coun-try, the original sample of households and persons is followed over time at annual intervals. Persons who move or otherwise form or join new households are followed at their new location, provided they move within the same country. In this manner, the sample refl ects demographic changes in the population and continues to remain representative of the population over time, except for losses due to sample attrition. Households formed purely of new immigrants into the population are not included (European Commission 1996). Hence, the survey is only representative of natives. Although attrition is a typical problem with panel surveys and ECHP is no exception, its sample dynamic compares well with other similar panels (Peracchi 2002).
be-fore 1995 are absent in most countries. We use ELFS to construct yearly measures of foreign- born shares by occupation and country. The ELFS is an aggregation of repeated cross- sections, built with standard sampling techniques to make them rep-resentative of the national labor force, allowing us to capture infl ows and outfl ows of migrants by country and years. The sample size of ELFS is fi ve to ten times larger than the ECHP, depending on the year and country considered, allowing for a more reliable estimate of migrant shares by occupation. Using ELFS, we are left with 11 of the EU- 15 countries (namely Austria, Belgium, Denmark, Finland, France, Greece, Ireland, the Netherlands, Spain, Portugal, and the United Kingdom). As for the others, there is no information allowing us to distinguish between native- and foreign- born individuals.7
In both data sets, we selected only observations relative to working age individu-als (15–65). Their occupations are coded according to the 1988 International Standard Classifi cation of Occupations (ISCO) produced by the International Labour Offi ce (ILO 1990). The ISCO classifi cation is the result of detailed investigation of national coding of occupations in the European countries and organizes them into standard groups (Elias and McKnight 2001). We group the ISCO- 88 occupations into four occupational levels or “tiers.” Table 1 provides the correspondence between the four occupation tiers and the ISCO occupations at one- digit. The fi rst tier (“Elementary”) includes occupations that use skills associated with a basic general education, usually acquired by the completion of compulsory education. Examples of occupations in the fi rst tier include postal work-ers, hotel portwork-ers, cleanwork-ers, and catering assistants. The second tier (“Clerical and Craft”) covers a large group of occupations, all of which require basic knowledge as for the fi rst tier, but also worker- related training or work experience. Occupations classifi ed at this level include machine operation, driving, caring occupations, retailing, and clerical and secretarial occupations. The third tier (“Technical and Associate”) applies to occupations that normally require a body of knowledge associated with a period of post- secondary education but not necessarily up to a college degree level. A number of technical oc-cupations fall into this category, as do a variety of trades ococ-cupations and proprietors of small businesses. In the latter case, educational qualifi cations at subdegree level or a lengthy period of vocational training may not be a necessary prerequisite for competent performance of tasks, but a signifi cant period of work experience is typical. The fourth tier (“Managers and Professionals”) relates to what are often termed professional occu-pations and managerial positions in corporate enterprises or national/local government such as legislators and senior offi cials and managers. Occupations at this level typically require a tertiary degree or equivalent period of relevant work experience.
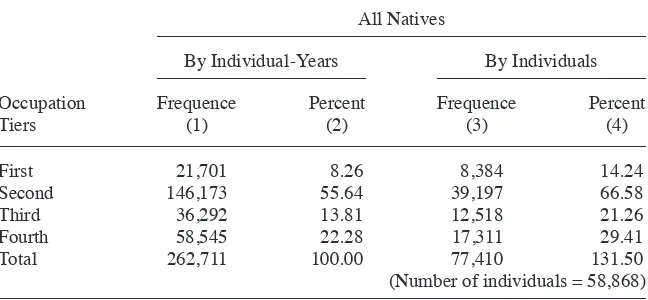
Table 2 shows the distribution of native workers across the four tiers.As we notice from Columns 1–2, overall about 8 percent of individual- year observations fall in the fi rst occupation tier, 56 percent in the second tier, 14 percent in the third, and 22 per-cent in the fourth (top) tier occupations. This table also shows frequencies (Columns 3–4) of tiers in terms of individuals rather than individual- years, showing that 14 per-cent of individuals ever worked in the fi rst tier, 67 percent in the second, 21 percent in the third, and 29 percent in the fourth, for a grand total of 77,410 individual- tier
Cattaneo, Fiorio, and Peri 665
observations. Considering that we have about 59,000 individuals in our sample, this table suggests that mobility across occupational tiers is substantial as one quarter of the European individuals in the period considered has held occupations in at least two different tiers.
The grouping of the occupations into the four hierarchical levels is quite reasonable. The aggregate data, in fact, show that moving from Tier 1 to 4 we fi nd an increasing percentage of native workers with tertiary education. The levels of wage and salary earnings also increase and so does income from self- employment. In addition, a higher score in complex skills as well as a lower score in manual skills is associated with higher tiers (see Table A1 in the appendix to see these descriptive statistics).8
The full sample of native workers comprises over 260,000 individual- year observa-tions. Table A2 provides summary statistics of the main outcome variables for the full and the 2SLS sample. The latter is restricted to countries for which an instrument can be constructed.9 The average of the occupational mobility index in the full sample is 0.03, which suggests that the upgrades are more likely than downgrades. In fact, about
8. The intensity of skills of the different tiers are computed using the D’Amuri and Peri (2014) calculation based on the O*NET data from the U.S. Department of Labor. Complex scores are computed as the average of scores in communication, complex, and mental skills. Noncomplex, manual scores are the average of scores in manual and routine skills. The higher scores in complex tasks for Tier 4 occupations imply that workers in this group are the most likely to use intensively complex skills compared to the rest of the workers. 9. The sample in the 2SLS estimations does not include all 11 countries available because the 1991 census data used to compute the instrument were available only for six, namely France, United Kingdom, Greece, Spain, Portugal, and Austria.
Table 2
Distribution of Native Workers in the Four Occupation Tiers (Percent). Average 1995–2001
All Natives
By Individual- Years By Individuals Occupation
Tiers
Frequence (1)
Percent (2)
Frequence (3)
Percent (4)
First 21,701 8.26 8,384 14.24
Second 146,173 55.64 39,197 66.58
Third 36,292 13.81 12,518 21.26
Fourth 58,545 22.28 17,311 29.41
Total 262,711 100.00 77,410 131.50
(Number of individuals = 58,868)
Source: authors’ calculation based on ECHP data.
10 percent of individual- year observations record an occupation upgrade and about 7 percent a downgrade. The percentages computed for the 2SLS sample are almost the same. A better idea of the intertier mobility is given by the Matrix A3 in the appendix. That table shows that the more likely transition within one year is from Tier 1 to 2: every year, 19 percent of individuals in Tier 1 transition to Tier 2. Also common is transitioning from Tier 3 to 4 (7.3 percent per year). The most common downward transition is from Tier 3 to 2 (8.6 percent of those in Tier 2 experience it within a year). The other transitions are not larger than 5 percent per year. Overall, however, transi-tions between two adjacent tiers occur to 5–10 percent of individuals in the sample. Looking at worker- year observations (Table A2), the average unemployment rate is around 5 percent and the other averages for the outcome variables are very similar considering the full or the 2SLS samples.
Our main explanatory variable is the share of foreigners employed in country c and time t in occupation j. We defi ne as foreign born those workers who were born in a country different from the one where they currently reside. Figure 1 shows the average share (1995–2001) of foreign- born workers in employment by country (left panel) and by the ISCO occupation categories (right panel). The fi rst shows that EU coun-tries widely differed in their share of foreign workers. Averaging the whole period, in France about 10 percent of the working population was foreign born, in Belgium that percentage was over nine, while in Finland it was less than 2 percent of the popula-tion. Breaking down the foreign- born population of workers by ISCO codes, one also notices that foreign- born workers are a relatively large share (roughly 10 percent) of workers in elementary occupations but they also constitute a large share (about 6–7 percent) of those employed in occupations requiring high qualifi cations (such as professional, legislators, senior offi cials, and managers).
V. Main Empirical Results
In this section, we present the results of the empirical analysis. As the main explanatory variable, fj,c,t, varies at the occupation- country- year level, and as in-dividuals are followed over time, we use a two- way cluster to compute the standard errors. To account for possible correlation within individual over time, one needs to cluster at the individual level. To account for the correlation within the same country- year, one would cluster at that level. Hence, the two- way cluster should ac-count for correlation within each group and across them so that the standard errors are not artifi cially reduced by within group correlation. The reported regressions include all individual controls (Xi,t), the year effects (t), and the full set of two- way interaction dummies (c,t, l,t, l,c). The only coeffi cients shown in the estimation tables are those on the main explanatory variable, fj,c,t.
Ca
Share (percent) of Foreign Born Workers Over Total Population by Isco 1- digit. Average 1995–2001 Source: authors’ calculations based on ELFS.
dependent variable is a measure of occupation mobility, it measures a change in time; hence, no individual fi xed effects are included. In the other regressions in which out-comes are not differenced, individual fi xed effects i are included.
A. Immigrants and Native Job Mobility and Attainment
In Table 3, we report the estimates of the coeffi cient on the immigrant share of employ-ment (fj,c,t) when the dependent variable is the occupational mobility index described above. The outcome yi,t for occupational level is coded with a discrete variable that is standardized to 0 for the occupational tier that the individual had when we fi rst observe her/him in our panel. It takes a value of +1 or −1 if the worker experiences a level up-grade or downup-grade, respectively, relative to the initial occupational level. If the individ-ual did not change tier or went back to the original one, the variable takes a value of 0.10 The 2SLS results are robust and consistent across specifi cations. The imputed im-migrant share by cell, constructed as described in Section IIIB, turns out to be a strong instrument for the endogenous variable in all the specifi cations used. The F- statistics of the excluded instrument, reported in the last row of the tables, are always well above ten and in many cases very high. The coeffi cient estimates show that the effect of immigration on occupation level mobility is positive and signifi cant at time t for all specifi cations. First, let us notice that the OLS estimates are not very different in their size and signifi cance when using the full sample of 11 countries (Specifi cation 1) or the restricted sample of six countries (Specifi cation 2). The comparison of the fi rst two columns, in fact, shows that the estimates are close, suggesting that no large bias is introduced by the smaller sample.
The 2SLS estimates of Column 3, however, are signifi cantly larger than the OLS ones. This direction of the bias suggests that immigrants in Europe might have moved endogenously to occupations or countries that were not experiencing fast upward career mobility for natives. For instance, one may think of a positive demand shock for a par-ticular set of occupations in a parpar-ticular country. This increase in demand would tend to draw immigrants into that market as well as keep native- born workers from moving out of it although the increase in supply would tend to push workers out. These types of endogenous infl ows would bias the estimate toward zero. Our instrument is, by construc-tion, uncorrelated with these types of demand shocks and hence it only allows disentan-gling the supply push margin.11 Finally, measurement error in the ELFS, corrected by the census- based instrument, could also contribute to explain the downward OLS bias.
Focusing on the specifi cation in Column 3, the 2SLS estimated effect of immi-grants on occupational level is large and signifi cant. Using the coeffi cient of 0.7, an increase of immigrants by one standard deviation of employment in a cell (equal to four percentage points) would increase the average measure of occupational mobility by nearly 0.03 points. This implies that it made an occupational level upgrade three
10. In case the individual enters the panel as a nonemployed person, the initial occupation level refers to the fi rst time we see him/her working. In case an individual temporarily exits employment, we ignore that observation as we would be unable to correctly assign him/her an occupation level. However, the individual is retained in the sample if we observe him/her at least two periods over the period considered as this still could allow us to defi ne occupational mobility indices or introduce individual fi xed effect estimation.
Ca
Share of immigrants 0.4037*** 0.2839** 0.7097*** 4.9649** 0.9233***
at time t [0.1215] [0.1289] [0.2749] [2.0914] [0.3505]
Fixed effects Year Year Year Year Year
Interaction effects Country*occ.lev. Country*occ.lev. Country*occ.lev. Country*occ.lev. Country*occ.lev. country*year country*year country*year country*year country*year
First- stage F- statistics — — 78.45 33.56 37.83
Note: Each column reports the estimate from a different regression where the dependent variable is defi ned as equal to 0 if the individual is at the same tier level as when he fi rst entered the sample, 1 if he is at a higher tier, and - 1 if he is at a lower tier. The coeffi cient reported in Columns 1–3 is the coeffi cient on the share of foreign born at time
percentage points more likely or an occupational downgrade three percentage points less likely for a native. In Column 4, we include the past values of the share of immi-grants. In this specifi cation, both the contemporaneous and the lags of the immigrant shares are instrumented, including the corresponding lags of the imputed shares in the instrument set. In this specifi cation, the coeffi cient on the share of immigrants at time
t increases up to a value of 5 (Column 4). This large impact of the current share of immigrants, however, is dampened by the effect of the past value of the share of im-migrants. The coeffi cient of the three- year lag is negative and statistically signifi cant. In Specifi cation 4, however, the introduction of lags (three of them) and the need to instrument for each one of them, plus the high correlation among current and lagged variables, reduces signifi cantly the joint power of the instrument and the precision of the estimates. We would not attach too much weight to the exact size of the coef-fi cients in Specifi cation 4 and their implied timing because of large standard errors.
To better understand the details of the occupational response of natives, it is useful to separate between upward and downward occupational mobility. In this way, we are able to detect whether immigrants are genuinely providing a “push” to native careers or if they are simply preventing them to “fall” in the occupational levels. To do this, we defi ne an “upward mobility” dummy that is equal to 1 if an individual moves into an occupation level higher than that of his/her fi rst entry in the sample and 0 otherwise. Similarly, we defi ne a “downward mobility” dummy that is coded 1 if an individual moves to an occupation in a lower tier than the initial one and 0 otherwise.
Table 4 presents results on the dummy “upward mobility.” The estimated coef-fi cients are consistently positive and signifi cant. Considering the 2SLS estimates without lags shown in Column 3, the coeffi cient of the share of immigrants at time
t is 0.38. This suggests that an increase in the share of immigrants by one standard deviation of cell employment raises the average likelihood of occupational upgrading from the average (8.8 percentage points) to 10.3 percentage points. This confi rms a signifi cant effect of immigrants on native occupational improvements and shows that more than half of the coeffi cient in Table 3 is due to increased upward mobility. The coeffi cients of the lagged variables in Column 4 are not statistically signifi cant, and the point estimates are negative. This dynamic response is consistent with the idea that relatively mobile individuals respond relatively quickly to the pressure as immigrants move into the market. It is important to note that it may take some time for the produc-tive consequences of this upgrade to be realized. Wages, as we will see below, respond with a lag. This likely takes place because a change in occupation, although upward, entails an immediate loss of specifi c human capital. Nevertheless, the relatively high occupational mobility of natives, especially during their early career, may provide opportunities to respond quickly to competition via upgrading opportunities. Hence, by taking jobs at the lower tiers of the occupational distribution, immigrants provide a push and complementarity benefi ts to faster career upgrades of natives. Over time. this affords a wage increase or at least protects natives from wage competition. On average, native workers seem to take advantage of this by having higher probability of upward mobility within the considered period (1995–2001).
Table 5 shows results for the dummy “lower occupational level.” The coeffi cients suggest a negative and statistically signifi cant effect of the share of immigrants at time
Ca
Immigration and Occupational Upward Mobility of Natives
Specifi cation
Share of immigrants 0.1786** 0.1534* 0.3833** 2.7970** 0.6278**
at time t [0.0807] [0.0841] [0.1785] [1.3113] [0.2505]
Fixed effects Year Year Year Year Year
Interaction effects Country*occ.lev. Country*occ.lev. Country*occ.lev. Country*occ.lev. Country*occ.lev. country*year country*year country*year country*year country*year
First- stage F- statistics — — 78.45 33.56 37.83
T
Immigration and Occupational Downward Mobility of Natives
Specifi cation
Share of immigrants –0.2251*** –0.1305 –0.3264* –2.1679 –0.2955
at time t [0.0787] [0.0872] [0.1704] [1.3839] [0.1959]
Fixed effects Year Year Year Year Year
Interaction effects Country*occ.lev. Country*occ.lev. Country*occ.lev. Country*occ.lev. Country*occ.lev. country*year country*year country*year country*year country*year
First- stage F- statistics — — 78.45 33.56 37.83
Cattaneo, Fiorio, and Peri 673
the specifi cation including lags has much larger standard errors because of decreased joint power of the instruments. We can, therefore, summarize that an infl ow of im-migrants into an occupation- country cell encourages natives to escape competition by signifi cantly increasing the chances of moving to a higher level, but also by somewhat reducing the chances of moving to a lower one. Competition within an occupational level is avoided by moving up the ladder of occupational tiers.
The last columns (Specifi cation 5) of Tables 3, 4, and 5 show another interesting feature of the impact of immigrants on occupational mobility of natives. In those specifi cations, we also include the share of immigrants in the next higher occupational tier as a control. While increased competition of immigrants within an occupation is escaped by upward mobility, the presence of immigrants in the upper occupational tier could discourage mo-bility. Natives could encounter competition after upgrading if the next tier up experiences a very large infl ow of immigrants. The results show some evidence in favor of this hy-pothesis. The share of immigrants in the next higher occupation level has a negative and statistically signifi cant effect on the probability of upward mobility (Table 4) while its impact on downward mobility is not signifi cant (Table 5). These results are consistent with the idea that competition in the immediately higher tier may in part discourage upgrading.
Finally, Table 6 shows the main results when the dependent variable is occupational attainment, simply measured as the “occupation level” defi ned above. In this specifi ca-tion, we include individual fi xed effects i in order to account for individual heteroge-neity, which in the previous regression was differenced away. The 2SLS coeffi cients suggest a strong and positive effect of the share of immigrants at time t on the level of occupation of natives. The much larger 2SLS coeffi cient relative to Table 4 is due to the dependent variable being measured with an index varying between 1 and 4 rather than between 0 and 1. Converting the effect into standard deviations produces a com-parable effect to those estimated above. One standard deviation increase in the share of immigrants would increase the average occupation level by 0.4, moving the level of attainment from an initial average of 2.4 to 2.8. This is a 17 percent increase over the average, which is about the same as the probability of upward mobility relative to the average estimated with reference to Table 4. Notice that in Table 6 the downward bias of the OLS is strong enough to produce negative point estimates. The estimates includ-ing lagged values of the explanatory variable (Column 4) show some negative coeffi -cients at lags one and two though much smaller in size than the positive contempora-neous one. However, as already noted, the need to instrument for each lag largely reduces the F- statistic of the fi rst stage.
T
he
J
ourna
l of H
um
an Re
sourc
es
Table 6
Immigration and Occupational Attainment of Natives
Specifi cation
OLS, Full Sample (1)
OLS (2)
2SLS (3)
2SLS (4)
Share of immigrants –3.0195*** –2.4841*** 10.3401*** 25.0209***
at time t [0.6767] [0.7252] [3.5911] [5.9217]
Share of immigrants –4.0233***
at time t – 1 [1.4421]
Share of immigrants –2.7625***
at time t – 2 [1.0152]
Share of immigrants –1.3765
at time t – 3 [1.0436]
Share of immigrants in next higher tier level at time t
Fixed effects Year, Individual Year, Individual Year, Individual Year, Individual Interaction effects Country*year Country*year Country*year Country*year
Observations 262,711 183,068 183,068 65,705
First- stage F- statistics — — 280.8 29.75
Cattaneo, Fiorio, and Peri 675
only the result of compositional changes (new hires or selective retirement) but of exist-ing native individuals movexist-ing more rapidly toward higher- ranked occupations.
B. Immigrants and Native Unemployment and Wages
The outcome considered in Table 7 is the unemployment status of native individual
i at time t. While the mobility toward higher occupational tiers is potentially a posi-tive outcome for naposi-tives, it may imply, in the short and medium run, higher risk of unemployment by displacing workers from their initial job. A modifi ed version of the “crowding- out” hypothesis (which argues that immigrants decrease the job opportuni-ties for natives) implies that immigrants push natives to move to other occupations but generate periods of costly unemployment. The fact that natives have to change jobs to take advantage of the opportunities created by immigrants may leave them unemployed or out of the labor force for a while.
To test this possibility, we consider as outcome yi,t a dummy equal to 1 if native indi-vidual i is unemployed at time t and 0 if he/she is not. As already discussed in Section IV, we consider only individuals aged 15–65. We then exclude those in education or train-ing, retired, or doing community or military service. Table 7 shows the estimates of the coeffi cient in such regressions. The table has the same structure as the previous ones, showing different columns with estimates from OLS and 2SLS specifi cations. The results are similar across specifi cations and they show no signifi cant effect of immigration on the probability of being unemployed. The point estimates on the share of immigrants at time
t in Column 3, with no lags for the immigrant share, are negative and not statistically sig-nifi cant. Also, in the specifi cation that includes the lagged values (Column 4) of the share of immigrants, the coeffi cients are mostly nonsignifi cant. If anything, a negative effect of immigration on unemployment emerges for the two- year lag. An increased share of immigrants does not change the natives’ likelihood of experiencing unemployment and, with a two- year lag, it may reduce it slightly. This is probably because workers are more likely to be in higher occupational tiers (as shown above) in the following years and the unemployment rate is lower for those occupations. Taken together, these results imply that immigration has no signifi cant impact (or possibly a negative impact after two years) on the probability that a native worker becomes unemployed. This effect is consistent with the hypothesis that immigrants generate complementary working opportunities for natives in higher occupational tiers. They may even induce stronger job creation by fi rms, stimulating upgrading and employment of natives (as shown, for instance, in Chassam-boulli and Palivos 2012). We do not fi nd evidence supporting the idea of crowding out. Our data also contain information on the yearly wage and salary earnings of an individual. Using these variables, we explore one further potential outcome. First, we analyze the impact of immigrants on yearly wage income of individual natives. On the one hand, the occupational upgrade identifi ed before should contribute positively to wages. On the other, especially in the short run, the loss of specifi c human capital may offset the positive wage effect of occupational upgrading. Moreover, immigrant com-petition may decrease the occupational wages at low levels of the occupation ranking so that climbing up may simply offset the potential decreases. Whether immigration in the short run is associated to a positive wage effect on natives is an empirical question.
T
he
J
ourna
l of H
um
an Re
sourc
es
Table 7
Immigration and Native Unemployment
Specifi cation
OLS, Full Sample (1)
OLS (2)
2SLS (3)
2SLS (4)
Share of immigrants 0.0447 0.0574 –0.1353 0.0147
at time t [0.0531] [0.0641] [0.1122] [0.2361]
Share of immigrants 0.0827
at time t – 1 [0.3103]
Share of immigrants –0.4643***
at time t – 2 [0.1663]
Share of immigrants –0.0070
at time t – 3 [0.1576]
Fixed effects Year, Individual Year, Individual Year, Individual Year, Individual Interaction effects Country*occ.lev. Country*occ.lev. Country*occ.lev. Country*occ.lev.
country*year country*year country*year country*year occupational
level*year
occupational level*year
occupational level*year
occupational level*year
Observations 321,934 218,629 218,629 96,000
First- stage F- statistics — — 158.0 52.57
Ca
tta
ne
o, F
iori
o, a
nd P
eri
677
Table 8
Immigration and Native Earnings
Specifi cation
OLS, Full Sample (1)
OLS (2)
2SLS (3)
2SLS (4)
Share of immigrants –0.1525 –0.2095 0.3363 0.6381
at time t [0.1523] [0.1749] [0.4172] [0.6156]
Share of immigrants 0.9603**
at time t – 1 [0.4343]
Share of immigrants 0.5690
at time t – 2 [0.3885]
Share of immigrants –0.4517
at time t – 3 [0.4292]
Fixed effects Year, Individual Year, Individual Year, Individual Year, Individual Interaction effects Country*occ.lev. Country*occ.lev. Country*occ.lev. Country*occ.lev.
country*year country*year country*year country*year occupational
level*year
occupational level*year
occupational level*year
occupational level*year
Observations 213,287 141,996 141,996 51,700
First- stage F- statistics — — 119.0 32.20
However, the more demanding specifi cation, with the inclusion of the lagged share of immigrants (Column 4), suggests that a signifi cant (but not large) positive effect on natives’ wage and salary earnings occurs with one to two- year lags. The point estimates of the effect of immigrants at time t−1 is around one. Therefore, an increase of immigrants’ share by one standard deviation of cell employment at time t−1 would increase the average wage and salary earnings by 4 percent. These results suggest that occupational upgrade may imply a delayed wage increase and no contemporary wage loss. Natives are pushed to a more remunerative occupation, but due to an initial loss of specifi c human capital the actual wage gain is only shown later. It should be noted that we estimate an average effect, merging people who upgrade with people who do not upgrade. It is possible that the positive effect is driven by the subset of workers upgrading, offsetting possible wage declines of workers who do not upgrade.
C. Effects on Self- Employment
We then focus on self- employment income. Self- employment income is a signifi cant component of labor income in many countries. As immigrants usually have a larger self- employment rate than natives, they could have an effect on the employment status of natives. Figure A1 plots the probability of receiving self- employment income for im-migrants with respect to natives. Over the period considered, this probability increased sharply. This generated a signifi cant increase in the supply of self- employed immigrants. The response of natives to this change in supply of immigrants can be ambiguous. On the one hand, the presence of immigrants may increase the opportunity of natives to start a business, hiring immigrants in manual tasks at moderate cost. On the other, the competition of immigrants as entrepreneurs can crowd out (pushing toward paid em-ployment) native entrepreneurs. While there are some studies analyzing immigrants as self- employed (Fairlie 2010), there is very little research on whether more immigration encourages natives to become entrepreneurs. An exception is Fairlie and Meyer (2003), which fi nds a crowding out effect of immigrant entrepreneurs on native ones.
In Table 9, Panel A, we test whether immigration affects an individual’s likelihood of receiving no self- employment income, where the outcome variable takes value equal to one if an employed person receives only wage and salary and no self- employment income and 0 if one receives either some or only self- employment income. In Table 9, Panel B, we analyze the effect of immigration on the (logarithm of ) self- employment income of natives.
The analysis of these two outcomes provides a sense of the effect on native entrepre-neurial activity overall (self- employment income) and on the extensive margin (prob-ability of self- employment). The empirical fi ndings are as follows. First, the likelihood of native workers to receive self- employment income decreases with increased share of foreign born (Table 8, Panel A). An increase of foreign born by one percentage point of cell employment would imply up to 1.1 percentage point increase in the probability of not having any self- employment income. Second, immigration does not produce any signifi cant effect on the average level of self- employment income (Table 9, Panel B).12
Cattaneo, Fiorio, and Peri 679
The point estimates, consistent with the result on the extensive margin, are always neg-ative though not statistically signifi cant. This implies a decrease in the propensity to do self- employment activities. Hence, there is some evidence that immigration decreases the probability of self- employment activities by natives and that some crowding- out effects of immigrants on natives occur, consistent in this area with fi ndings by Fairlie and Meyer (2003).
VI. Extension and Checks
A. Different Defi nitions of Occupational Mobility
One key element of our fi nding is the increased occupational mobility of natives in response to immigration. In order to verify that the specifi c occupational “tier” struc-ture imposed is not responsible for the fi ndings of larger occupational mobility, in this section we compute occupational change without any occupational level. In par-ticular, we analyze whether immigration affects the probability of natives to move between any of the nine ISCO occupational groups, independently of the direction of this move. We construct a binary outcome variable that we call occupation change. The variable takes the value of 0 for each individual when he/she joins the sample. It equals 1 if individual i works in a different occupation than the initial one while it remains 0 otherwise. This outcome variable does not allow to test for the “direction” of the occupation change but it is a check that immigration affects the propensity of native individuals to change occupation, independently of the tier- structure imposed. Clearly, in the sample there are more occupation changes than the sum of upgrades and downgrades: Some occupation changes are not coded as either upgrades or down-grades as they occur between occupations of the same tier. While the sample average probability of occupational change is 22 percent per year, the sum of average upgrades and downgrades is around 16 percent (see Table A2).
T
he
J
ourna
l of H
um
an Re
sourc
es
Table 9
Immigration and Native Probability of Receiving No Self- Employment Income and Self- Employment Income
Specifi cation
OLS, Full Sample (1)
OLS (2)
2SLS (3)
2SLS (4)
Panel A: Native probability of receiving no self- employment income
Share of immigrants 0.3444*** 0.3658*** 1.1092*** 0.8929**
at time t [0.0965] [0.1175] [0.2516] [0.3508]
Share of immigrants 0.5937**
at time t – 1 [0.2715]
Share of immigrants 0.1140
at time t – 2 [0.1926]
Share of immigrants –0.2863
at time t – 3 [0.2165]
Fixed effects Year, Individual Year, Individual Year, Individual Year, Individual Interaction effects Country*occ.lev. Country*occ.lev. Country*occ.lev. Country*occ.lev.
country*year country*year country*year country*year
occ.lev.*year occ.lev.*year occ.lev.*year occ.lev.*year
Observations 262,711 183,068 183,068 65,705
Ca
tta
ne
o, F
iori
o, a
nd P
eri
681
Panel B: Native self- employment income
Share of immigrants 0.1166 0.4252 –1.1288 –2.1609
at time t [0.6409] [0.7378] [2.3136] [3.9169]
Share of immigrants 0.5663
at time t – 1 [2.6247]
Share of immigrants –0.5351
at time t – 2 [2.4543]
Share of immigrants 0.2094
at time t – 3 [2.5947]
Fixed effects Year, Individual Year, Individual Year, Individual Year, Individual Interaction effects Country*occ.lev. Country*occ.lev. Country*occ.lev. Country*occ.lev.
country*year country*year country*year country*year
occupational level*year occupational level*year occupational level*year occupational level*year
Observations 37,407 28,864 28,864 11,806
First- stage F- statistics — — 120.1 9.046
T
he
J
ourna
l of H
um
an Re
sourc
es
Table 10
Immigration and Native Probability of Occupation Change
Specifi cation
OLS, Full Sample (1)
OLS (2)
2SLS (3)
2SLS (4)
Share of immigrants 0.0929 0.0448 1.9884*** 4.0966*
at time t [0.1542] [0.1601] [0.4258] [2.3567]
Share of immigrants –2.1187**
at time t – 1 [1.0745]
Share of immigrants –0.2839
at time t – 2 [1.5665]
Share of immigrants 0.8515
at time t – 3 [2.3397]
Fixed effects Year Year Year Year
Interaction effects Country*occ.lev. Country*occ.lev. Country*occ.lev. Country*occ.lev.
country*year country*year country*year country*year
occupational level*year occupational level*year occupational level*year occupational level*year
Observations 262,711 183,068 183,068 70,620
First- stage F- statistics — — 78.45 33.56
Cattaneo, Fiorio, and Peri 683
B. Heterogeneity by Initial Skill, Age, Gender
There is large heterogeneity in the labor market outcomes of workers that is associated to their age, gender, and skills. These differences can make one group more vulnerable and responsive to the infl ow of migrants than other groups. In Table 11, we take into account this heterogeneity and we split the sample of workers according to three crite-ria. First, we distinguish workers in terms of their occupational tiers at the entry in the sample. As we have found a positive effect of the share of immigrants at time t on oc-cupational mobility and ococ-cupational attainment, we would like to check whether this also is confi rmed by looking at subsamples of workers, depending on their tier when we fi rst observe them in 1995. Native workers in Tier 1 and 2 may be subject to more intense competition from immigrants in manual jobs, whereas natives in Tier 3 may have stronger upward mobility opportunities linked to their higher skills, better abil-ity to learn, and stronger wage incentives to upgrade (as wage distributions are more “stretched” at the top). Second, we assess whether the ability to respond to immigra-tion via an occupaimmigra-tional upgrade is mainly an opportunity for young workers, defi ned as individuals younger than age 40 at the entry in the sample, or if it is also shown by older workers. Third, we also test whether results are robust to the exclusion of individuals younger than 25. This group could include workers who are also enrolled in higher education and who may experience large upgrades after the completion of their tertiary education. Finally, we distinguish between male and female workers. A larger share of immigrants in Europe is male so one could expect a larger pressure on that gender to upgrade occupation. However, some house- service occupations typical of migrants can substitute for women’s household work. All these models are estimated by 2SLS using Specifi cation 1, which does not include the lagged values of immigrant share.
The empirical fi ndings presented in Table 11 show the estimated effect of immi-grants on occupational mobility (Panel A), unemployment status (Panel B), and log earnings (Panel C). First, Columns 1 and 2 show that workers both in lower and upper tiers are signifi cantly more likely to experience occupational upward mobility as a consequence of immigrant competition. The coeffi cient is larger for workers starting at high tiers, suggesting more responsiveness of intermediate occupations to immigra-tion waves. As for occupaimmigra-tional attainment, results show positive coeffi cients for both groups, which are only statistically signifi cant for the group in the upper tiers. These results are consistent with the hypothesis that large infl ows of immigrants increase the demand for managerial occupations and natives have a particular advantage in those. In Columns 3 and 4, we present results for the group of young workers (younger than 40 years old) and older workers (40 years or older). Occupational mobility induced by immigrant infl ows occurs more strongly among older natives than younger ones. The point estimates in both the occupational mobility and the occupational attainment specifi cations are larger for natives older than 40 years than for those younger than 40 years. This result may be linked to the fact that older workers have higher probability of being in Tier 3, which is where most upward mobility in response to immigrants takes place. The possibility of having access to managerial occupations and the pres-ence of complementary immigrants in the lower tier may accelerate that process.
T
he
J
ourna
l of H
um
an Re
sourc
es
Table 11
Immigration and Native Occupation Level, Unemployment, and Earnings: By Skill, Age, and Gender
Subsamples
Tier:1 or 2 (1)
Tier: 3 or 4 (2)
Age < 40 (3)
Age ≥ 40 (4)
Age ≥ 25 (5)
Male (6)
Female (7)
Panel A: Occupation mobility
Share of immigrants 0.7194*** 1.4853*** 0.3588 1.1630*** 0.8106*** 0.9310*** 0.7690** at time t [0.1971] [0.5236] [0.2819] [0.3556] [0.2714] [0.3013] [0.3824]
Observations 135,441 57,298 122,104 70,635 153,201 115,274 77,465
First- stage F- statistics 68.33 88.65 76.91 76.03 83.69 82.64 80.79
Panel B: Unemployment status
Share of immigrants –0.2261* 0.2549 –0.1994 0.0492 0.0302 –0.1781 –0.0082 at time t [0.1280] [0.1689] [0.1480] [0.1270] [0.1107] [0.1291] [0.2086]
Observations 156,340 62,289 139,882 78,747 170,899 125,796 92,833
First- stage F- statistics 132.1 193.3 133.6 193.9 178.5 147 140.5
Panel C: Log wage earnings
Share of immigrants 0.4177 –0.5469 0.7159 –0.3305 –0.2052 0.4658 –0.1528 at time t [0.4731] [0.8059] [0.5463] [0.5353] [0.3855] [0.4515] [0.9576]
Observations 99,489 42,507 92,990 49,006 113,570 83,611 58,385
First- stage F- statistics 95.90 152.9 103.7 136.4 130.9 119.9 80.51


![Table 5The Journal of Human ResourcesImmigration and Occupational Downward Mobility of NativesSpecifi cation OLS, Full Sample(1) OLS(2) 2SLS(3) 2SLS(4) 2SLS(5)Share of immigrants–0.2251***–0.1305–0.3264*–2.1679–0.2955 at time t[0.0787][0.0872][0.1704][1.3839][0.1959]Share of immigrants–0.2607 at time t – 1[0.7029]Share of immigrants0.5907 at time t – 2[0.9967]](https://thumb-ap.123doks.com/thumbv2/123dok/1217819.779916/18.432.65.599.88.329/resourcesimmigration-occupational-downward-mobility-nativesspeci-immigrants-immigrants-immigrants.webp)


