Tal Gross is an assistant professor at the Mailman School of Public Health, Columbia University, and a Faculty Research Fellow at the National Bureau of Economic Research. Jeremy Tobacman is an as-sistant professor at the Wharton School, University of Pennsylvania, and a Faculty Research Fellow at the National Bureau of Economic Research. The authors are grateful to David Cutler, Guy David, Mark Duggan, Amy Finkelstein, John Friedman, Alex Gelber, Jon Gruber, David Laibson, Timothy Moore, Matt Notowidigdo, Mark Pauly, and two anonymous referees for very useful comments and suggestions. For help obtaining the hospital data, the authors thank Betty Henderson- Sparks, Joan Mock, and Louise Hand of California’s Offi ce of Statewide Health Planning and Development. Beginning six months after publica-tion through three years hence, upon request Tal Gross <tg2370@columbia .edu> and Jeremy Tobacman <tobacman@wharton.upenn .edu> will provide the nonconfi dential data used in this article and detailed instructions on securing the confi dential data used in this article.
[Submitted January 2012; accepted April 2013]
ISSN 0022- 166X E- ISSN 1548- 8004 © 2014 by the Board of Regents of the University of Wisconsin System
T H E J O U R N A L O F H U M A N R E S O U R C E S • 49 • 2
Dangerous Liquidity and the Demand
for Health Care
Evidence from the 2008 Stimulus Payments
Tal Gross
Jeremy Tobacman
A B S T R A C T
I. Introduction
Nearly 10 percent of low- income respondents to the National Health Interview Survey report that in the past year they needed medical care but could not afford it.1 Such households may not have been able to afford care because they were liquidity constrained. Health policy depends critically on whether such liquidity con-straints affect the care that people receive. If consumers are liquidity constrained, then deductibles, copayments, and other departures from full insurance may ineffi ciently discourage care. Similarly, liquidity constraints may cause consumers to forgo cost- effective preventive care and risk expensive hospitalizations.
In this paper, we test for liquidity constraints in health care utilization. To do so, we study how government payments to taxpayers affect inpatient hospitalizations and emergency department (ED) visits. We exploit exogenous variation in the timing of the 2008 Economic Stimulus Payments. The payments were sent to households on a date determined by the last two digits of the head- of- household’s Social Security Number (SSN), and those two digits are quasi- randomly assigned. In exploiting this variation we follow Evans and Moore (2012); Gross, Notowidigdo, and Wang (2011); and Parker et al. (2011); among others.
The stimulus payments temporarily relaxed households’ liquidity constraints. This could have a direct effect of increasing hospitalizations and ED visits if liquidity- constrained individuals could not afford such health care before the payments. Alter-natively, the direct effect could be negative if consumers use the payments to purchase preventive care that reduces the probability of a hospital visit. One would expect such a direct effect to be strongest for the uninsured and for medical conditions in which the timing of care is discretionary.
Alternatively, the stimulus payments may impact health care consumption indi-rectly, via changes in health. This could occur if households use the stimulus payments to increase certain types of consumption which affect the need for hospital care. For instance, if some consumers spend the payments on recreational drugs, then such a change in consumption patterns might indirectly affect health care utilization by lead-ing to adverse events. Such a mechanism would be consistent with the fi ndings of Ev-ans and Moore (2011) and Dobkin and Puller (2007). Other consumption, representing a general increase in (legal) activity, could be dangerous as well (Ruhm 2000; Miller et al. 2009; Lusardi, Schneider, and Tufano 2010; Dehejia and Lleras- Muney 2004).
We fi nd that the stimulus payments caused ED visits to increase by an average of 1.1 percent over a 23 week followup observation period. This amounts to an annual-ized rate of over 50,000 additional ED visits in California. This impact alone is diffi cult to reconcile with the Life- Cycle Hypothesis / Permanent Income Hypothesis (LCH / PIH) because the stimulus payments were small relative to lifetime income. In contrast, it suggests that a portion of the population responds to transitory changes in income.
Moreover, our results suggest that the increase in hospital utilization occurred via the indirect channel rather than the direct channel. We document evidence that the stimulus payments increased risky consumption patterns. The payments caused a large percentage increase in alcohol- and drug- related hospital visits but did not change the
The Journal of Human Resources 426
risk of an avoidable hospital visit or visits associated with chronic conditions. The stimulus payments had statistically indistinguishable impacts for people who were publicly insured, privately insured, and uninsured, and for people who lived in ZIP codes of varying average income levels.
Our fi ndings relate to several studies of household fi nance, health, and health care. First, our fi ndings complement previous studies that have demonstrated how income transfers can affect health. Evans and Moore (2011) demonstrate that short- term income transfers increase mortality, and Dobkin and Puller (2007) fi nd that transfers through cash welfare programs increase hospital visits for drug- and alcohol- related medical conditions. Our results support the conclusions of these two papers in that we demon-strate how income transfers to the general population affect the need for emergency care. Second, this paper is related to a larger discussion regarding the affordability of health care. Moran and Simon (2006) estimate that an increase in lifetime income in-creases the consumption of pharmaceuticals.2 This suggests that many individuals may not consume the health care they need because they cannot afford it. This paper studies a similar question but instead focuses on hospital visits and the general population. Moreover, we focus on a temporary increase in income rather than a large, sustained increase in income. Doing so allows us to test whether short- term liquidity constraints affect the demand for health care.
Finally, Parker et al. (2011) and Shapiro and Slemrod (2009) examine the consump-tion response to the 2008 Economic Stimulus Payments and estimate that consumers had a marginal propensity to consume of only 0.025 on health care. We replicate this
fi nding and decompose it across types of health care goods. We fi nd economically and statistically insignifi cant changes in all of the available subcategories of health expen-diture. This suggests the liquidity shocks did not cause substitution from outpatient physicians’ services into hospital care, and confi rms our main results.
Together with this prior work, our fi ndings support the view that liquidity con-straints are not a primary, direct barrier to obtaining health care. Rather, temporary increases in liquidity can be dangerous by inducing risky forms of consumption.
The paper proceeds as follows. Section II describes the structure of the stimulus payments and the administrative hospital data on which we rely. Section III presents our analysis for hospital visits. Section IV presents a replication and extension of the results of Parker et al. (2011). Section V discusses the implications of our fi ndings and concludes.
II. Background on the Stimulus Payments and Hospital
Data
On February 13, 2008, the Economic Stimulus Act of 2008 was enacted with bipartisan support. Two- thirds of the $152 billion bill, and more than 90 percent of the net outlays from 2008–18, consisted of direct payments to 130 mil-lion households. The priority of most subsequent analysis has been to study the conse-quences of the stimulus for aggregate consumption and savings (for instance, Parker
et al. 2011; and Shapiro and Slemrod 2009). The randomized disbursement schedule also provides an opportunity to study impacts on additional outcome variables, and in this paper we take up the question of how the stimulus payments affected health and the utilization of health care.
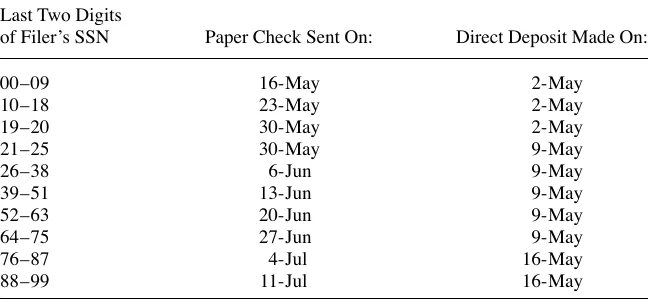
The stimulus payments were distributed by the Internal Revenue Service according to the staggered schedule reported in Table 1. Heads- of- household with lower values of the last two digits of their SSNs received their stimulus payments earlier, and these SSN digit- pairs are effectively randomly assigned.3 Paper checks were sent out over three months. The fi rst SSN group (digits 00–09) was sent its checks on May 16 and the fi nal group (digits 88–99) on July 11.
Households in 2008 could elect to receive their stimulus payments via direct deposit instead of mail, and roughly 40 percent of households did so (Parker et al. 2011). The direct deposit transfers were made on only three dates, listed in the third column of Table 1. In our analysis below, we treat the direct deposit and paper check schedules symmetrically, though direct deposit recipients were less likely to be liquidity con-strained, and the three- week span for disbursing direct deposit payments provides little variation for detecting an impact.4
Households received stimulus payments in 2008 if they paid taxes or had suffi cient qualifying income in 2007.5 The base payments ranged from $300–$600 for single fi lers to $600–$1,200 for couples. The IRS also included a $300 supplement for each qualifying child. Stimulus payments were phased out linearly between income levels of $75,000 and $87,000 for childless, single- headed households and at twice those
3. Parker et al. (2011) review additional details of the stimulus payment distribution. Here we summarize the most relevant facts.
4. Online Appendix Table 1 indicates that ignoring the direct deposit schedule entirely would yield similar overall conclusions. All online appendix material can be found at http: // jhr.uwpress .org.
5. The qualifying income included Social Security income. Table 1
Dates When Economic Stimulus Payments Were Sent in 2008
Last Two Digits
of Filer’s SSN Paper Check Sent On: Direct Deposit Made On:
00–09 16- May 2- May
10–18 23- May 2- May
19–20 30- May 2- May
21–25 30- May 9- May
26–38 6- Jun 9- May
39–51 13- Jun 9- May
52–63 20- Jun 9- May
64–75 27- Jun 9- May
76–87 4- Jul 16- May
The Journal of Human Resources 428
levels for childless households of married couples fi ling jointly. Roughly 85 percent of households received a stimulus payment, and the average payment was roughly $900.
In order to measure how the stimulus payments affected health care utilization, we obtained an extract of administrative hospital records from the California Offi ce of Statewide Health Planning and Development (OSHPD). The data comprise a near- census of ED and inpatient hospital visits in California for 2008.6 For each visit, we observe the patient’s gender, age, insurance status, and zip code of residence, in ad-dition to the medical conad-dition and the exact date when the visit occurred.7 The data also include a categorical variable for each patient corresponding to one of the 10 SSN groups in Table 1. We restrict the sample to visits that occurred at most 19 weeks before the stimulus payments were sent and at most 23 weeks after the stimulus pay-ments were sent. That restriction is the widest interval possible given the data set.
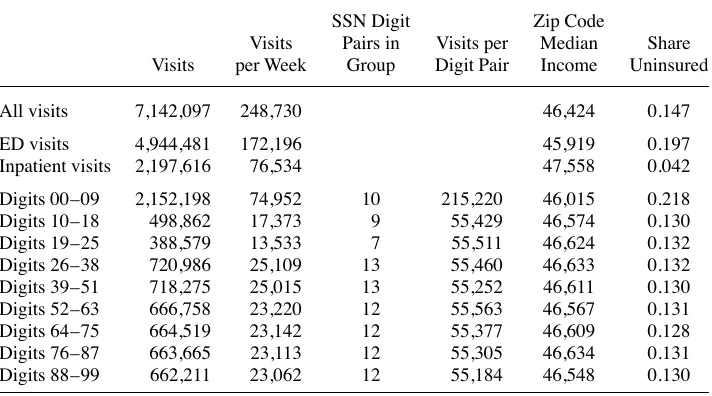
Table 2 presents summary statistics for the entire sample and for the 9 groups sent paper checks. Observations in the fi rst group, with digit pairs 00–09, are more numer-ous, more likely to be uninsured, and more likely to live in lower- income zip codes. Those differences exist because the fi rst group includes not only patients with SSNs ending in 00–09 but also patients with no SSN recorded. The fi rst group thus
contrib-6. The dataset includes all visits at hospitals regulated by OSHPD. Only Veterans’ Hospitals, Prison Hospitals, and State Hospitals are excluded from coverage.
7. Emergency department patients who are admitted to the hospital appear only in the inpatient data. Table 2
All visits 7,142,097 248,730 46,424 0.147
ED visits 4,944,481 172,196 45,919 0.197
Inpatient visits 2,197,616 76,534 47,558 0.042
Digits 00–09 2,152,198 74,952 10 215,220 46,015 0.218
Digits 10–18 498,862 17,373 9 55,429 46,574 0.130
Digits 19–25 388,579 13,533 7 55,511 46,624 0.132
Digits 26–38 720,986 25,109 13 55,460 46,633 0.132
Digits 39–51 718,275 25,015 13 55,252 46,611 0.130
Digits 52–63 666,758 23,220 12 55,563 46,567 0.131
Digits 64–75 664,519 23,142 12 55,377 46,609 0.128
Digits 76–87 663,665 23,113 12 55,305 46,634 0.131
Digits 88–99 662,211 23,062 12 55,184 46,548 0.130
utes a disproportionate share of measurement error, since patients with missing SSNs are either not affected by the stimulus payments (for instance, if they are undocu-mented immigrants) or are randomly assigned to other mailing dates. We thus drop that SSN group from the analysis.8 The remaining rows of Table 2 demonstrate that the other SSN groups have similar characteristics. That comparison is reassuring, because the SSN groups are randomly assigned.
III. The Effect of the Stimulus Payments on Hospital
Utilization
This section presents our main empirical results. We fi rst demonstrate the effect of the stimulus payments on ED visits and hospitalizations. We then investi-gate the mechanisms involved. To do so, we decompose visits by characteristics of the patients and their medical conditions.
A. The effect of the stimulus payments on total visits
In principle, the impact of the stimulus payments could arise and fade at any delay after payment receipt. We seek to be fully agnostic about these dynamics, and we use mul-tiple approaches to study the effects. First, we run a standard difference- in- difference specifi cation to measure the average effect of the stimulus payments over the followup observation period. We aggregate the data to counts of visits by SSN group and week,
Ygt, and estimate
log(Ygt) = β1 · I{CheckSent}gt + β2 · I{DirectDepositSent}gt + αt + γg + εgt
This regression includes a fi xed effect for each week, αt, and a fi xed effect for each SSN group, γ
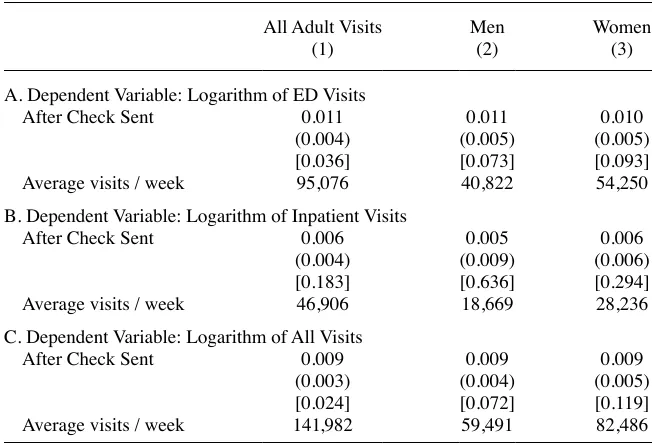
g. The indicator functions, I{CheckSent}gt and I{DirectDepositSent}gt, indicate, respectively, whether checks were mailed and whether the direct deposits were made to group g by time t. We thus interpret the point estimates as the percentage change in utilization for groups that have received their stimulus payments relative to groups that have not yet received their payments. The fi xed effects control for season-ality in hospital utilization and variation driven by differences in the size of the groups. Table 3 reports estimates of this specifi cation. Each cell of the table presents an estimate of β1 when the logarithm of ED visits, inpatient visits, or all visits is the dependent variable.9 The fi rst column demonstrates that after the stimulus payments are mailed, total ED visits increase by 1.1 percent (p- value of 0.036), over a baseline average of 95,076 visits per week. Inpatient visits increase by less than 1 percent, a change that is not statistically signifi cant at the 5 percent level. ED and inpatient visits combined increase by 0.9 percent, over a baseline of 141,982 visits per week, implying an increase of nearly 1,200 visits per week on average for 23 weeks after the checks
8. Online Appendix Table 3 presents our main results with this fi rst SSN group added back in. The results are generally not sensitive to the exclusion of this group.
The Journal of Human Resources 430
were sent. The remaining columns of Table 3 present estimates of β1 separately for visits by adult men and adult women. Both genders experienced a roughly 1 percent increase in ED visits; both estimates are statistically signifi cant at the 10 percent level.
Younger patients are not matched to the SSN group of their parents. Reassuringly, we fi nd no statistically signifi cant change in visits for children (p- value of 0.41). For all remaining estimates, we focus solely on visits by adults.
These difference- in- difference estimates assume that the stimulus payments have a constant, persistent effect on hospital visits. The treatment effect, however, may not be constant, for instance decaying as time passes.
Our second empirical approach attempts to measure the dynamics of the response to the stimulus payments. We estimate distributed- lag specifi cations, by replacing
I{CheckSent}gt in the regression equation above with a series of indicator variables that are equal to one if the hospital visit occurred 1–2 weeks before rebate receipt, the week of rebate receipt or 1 week after, 2–3 weeks after rebate receipt, and so on.10
10. All main text fi gures report results when estimating two leads and six lags. Robustness is demonstrated in Online Appendix Figures 1–2.
Table 3
The Effect of the Stimulus Payments on Hospital Visits
All Adult Visits
A. Dependent Variable: Logarithm of ED Visits
After Check Sent 0.011 0.011 0.010
(0.004) (0.005) (0.005)
[0.036] [0.073] [0.093]
Average visits / week 95,076 40,822 54,250
B. Dependent Variable: Logarithm of Inpatient Visits
After Check Sent 0.006 0.005 0.006
(0.004) (0.009) (0.006)
[0.183] [0.636] [0.294]
Average visits / week 46,906 18,669 28,236
C. Dependent Variable: Logarithm of All Visits
After Check Sent 0.009 0.009 0.009
(0.003) (0.004) (0.005)
[0.024] [0.072] [0.119]
Average visits / week 141,982 59,491 82,486
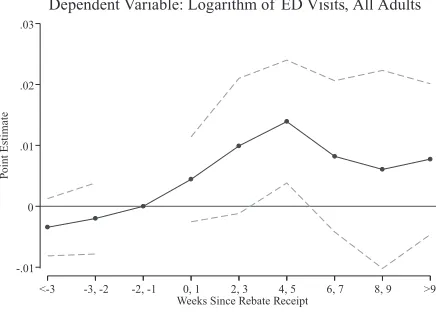
Figure 1 presents the point estimates from this regression, for all visits and sepa-rately by gender. In each panel, the solid line plots the point estimates, whereas the dashed lines plot 95- percent confi dence intervals. The omitted lag in each regression is the period immediately prior to the week in which the stimulus payments were sent.
In all panels, the probability of an ED visit becomes positive and statistically sig-nifi cant within fi ve weeks after the stimulus payments are sent. Some delay in the impact may be caused by the time required for households to receive and cash the stimulus checks. Alternatively, the payments may alter families’ monthly budgets, and the surplus may only become salient at the end of the month. For all visits, we observe a statistically signifi cant 2 percent increase in emergency visits in Weeks 4 and 5 after the rebates. The modest pretrends discernible here are consistent with anticipation of stimulus payments by some households. For men, the fi gures surprisingly suggest a permanent effect of the payments on ED visits. But the confi dence intervals after the fi rst month are wide. We view such long- term estimates as speculative because we possess no true control group after all groups receive their checks.11
The estimates above rely on a proxy for when individuals would have been sent their stimulus checks if they received a payment based on their own SSN. But the actual number of individuals treated (by being sent a check) differs from the number
identi-fi ed by our research design. The regressions above capture the intent- to- treat effect of the payments on health care consumption. If we observed actual payment receipt, we could scale the intent- to- treat effect by the share of individuals who received a payment, to estimate the treatment effect on the treated.12 Relative to the treatment effect on the treated, the intent- to- treat effect is scaled toward zero by the probability of actual check receipt. Several considerations affect this scaling factor.
First, Parker et al. (2011) report that roughly 85 percent of households received a stimulus payment and 60 percent of households received the payments via paper check. Second, in married households receiving stimulus payments, the date the check was sent was determined by the fi rst SSN listed on the joint income tax return (IRS 2008). Either spouse could be listed fi rst on a joint return, and in 2008, 38 percent of returns were joint. This implies that 28 percent of payment recipients (and possibly hospital patients) would have received their payments based on the schedule for their spouse’s SSN group, which differs from their own 89 percent of the time.13
If the causal effect of actual check receipt on hospital visits were identical across households, and stimulus payment amount, receipt by paper check, marital status, and ordering of spousal SSNs on the tax return are independent, then we could multiply the reduced- form intent- to- treat estimates by 1 / (0.85 * 0.6 * 0.75) = 2.6 to scale up to the treatment- on- the- treated effect. This scale- up would apply both for the difference- in- difference and distributed- lag specifi cations. Multiplying, our estimate of a 1.1 percent
11. Online Appendix Table 4 reports estimates of an alternative functional form, which allows for expo-nential decay of an initial effect. The point estimates in that table also show a statistically signifi cant initial increase in ED visits of 1.1 percent. The decay rate takes the wrong sign in that specifi cation but is not statisti-cally different from 0.
12. In estimating effects of the stimulus payments using the Consumer Expenditure Survey, Parker et al. (2011) run instrumental variables regressions, instrumenting for payment amount with an indicator for (ran-domly assigned) payment receipt.
432
Figure 1
Distributed- Lag Estimates by Gender
Notes: Each fi gure plots point estimates from a regression of log counts of visits on a set of indicators for two- week intervals. The dotted lines plot 95 percent confi dence intervals that are robust to autocorrelation between observations from the same SSN group. SSN group fi xed effects, week fi xed effects, and an indicator for whether direct deposits had been made are also included in the regressions. The omitted time period is one and two weeks before rebate checks were sent.
-.01 0 .01 .02 .03
P
oint Estimate
<-3 -3, -2 -2, -1 0, 1 2, 3 4, 5 6, 7 8, 9 >9 Weeks Since Rebate Receipt
Dependent Variable: Logarithm of ED Visits, All Adults
-.02 0 .02 .04
P
oint Estimate
<-3 -3, -2 -2, -1 0, 1 2, 3 4, 5 6, 7 8, 9 >9 Weeks Since Rebate Receipt
Dependent Variable: Logarithm of ED Visits, Men
-.02 0 .02 .04
P
oint Estimate
<-3 -3, -2 -2, -1 0, 1 2, 3 4, 5 6, 7 8, 9 >9 Weeks Since Rebate Receipt
effect from the difference- in- difference specifi cations implies that the effect of actu-ally receiving a stimulus payment is 2.87 percent.
This number still may not equal the average treatment effect for several reasons. First, paper check recipients differ systematically from the general population. Parker et al. (2011) indicate that direct deposit recipients had higher incomes than paper check recipients, similar family sizes, and slightly larger stimulus payment amounts. Households without suffi cient qualifying income to receive a stimulus payment, and households with suffi cient income to be above the phase- out would likely have had different responses as well. Second, the reduced- form regressions are biased toward zero because of measurement error and because some check recipients may have be-gun to change consumption behavior in anticipation of their checks. It is not clear which of these reasons for differences from the average treatment effect dominate, but they go in offsetting directions.
Taken together, our results provide evidence of an increase in hospital utilization caused by modest liquidity shocks. We next investigate the mechanisms for this effect by testing for variation in treatment effects by medical condition and patient charac-teristics.
B. The effect of the stimulus payments by medical condition
Section 1 discussed two possible mechanisms for the increase in ED visits. First, the stimulus payments may have relaxed household liquidity constraints, in which case the increase in visits may be driven directly by an increase in demand for primary care or by the treatment of chronic conditions.14 Alternatively, the increase in ED visits may be driven indirectly, by a change in nonhealth consumption patterns that may affect health care needs. For instance, if the stimulus payments increased general activity, then that consumption itself may lead to an increase in hospital utilization to treat new or newly aggravated health conditions. This section distinguishes between these direct and indirect channels by comparing the types of medical conditions that drive the increase in ED visits.
We classify visits in the data using three proxies for each visit’s cause. First, we isolate visits that are related to a chronic condition.15 Second, we categorize visits as alcohol- or drug- related using the same criteria as Dobkin and Puller (2007).16 Finally, we classify some hospital visits as “avoidable” following Aizer (2007), Kolstad and Kowalski (2010), and Dafny and Gruber (2005), amongst others. Avoidable hospital visits are visits that could have been prevented with timely care outside of the hospital. For instance, an adult visit for asthma is classifi ed as avoidable.
Table 4 presents estimates of β1 when the sample is restricted to visits that do and
14. Primary care is more likely to be consumed in a clinic or private doctor’s offi ce than in an ED. Neverthe-less, emergency departments are the source for much primary care (Grumbach, Keane, and Bindman 1983). We use the Consumer Expenditure Survey later to present estimates of the effect of the 2008 stimulus pay-ments on outpatient visits to physicians. The results suggest little effect.
15. We rely on computer code published by the Agency for Health, Research, and Quality that links Interna-tional Classifi cation of Diseases 9 Revision (ICD- 9) codes to an indicator for whether the visit is likely related to an underlying chronic condition.
T
The Effect of the Stimulus Payments by Medical Condition
Related to
A. Dependent Variable: Logarithm of ED Visits
After Check Sent 0.013 0.010 0.062 0.009 0.001 0.014
(0.013) (0.004) (0.021) (0.004) (0.006) (0.006)
[0.346] [0.031] [0.019] [0.071] [0.913] [0.053]
Average visits / week 15,005 80,071 3,528 91,548 22,694 72,382
B. Dependent Variable: Logarithm of Inpatient Visits
After Check Sent 0.001 0.009 0.002 0.006 0.004 0.006
(0.009) (0.005) (0.013) (0.004) (0.012) (0.004)
[0.921] [0.093] [0.892] [0.163] [0.713] [0.201]
Average visits / week 19,684 27,222 3,967 42,939 14,548 32,358
C. Dependent Variable: Logarithm of All Visits
After Check Sent 0.006 0.010 0.028 0.008 0.002 0.011
(0.007) (0.003) (0.012) (0.003) (0.007) (0.003)
[0.431] [0.016] [0.046] [0.045] [0.765] [0.011]
Average visits / week 34,689 107,293 7,495 134,487 37,242 104,740
do not fall into these three categories. Columns 1a and 1b present estimates for visits linked to chronic conditions and visits not linked to chronic conditions. The results suggest that chronic and nonchronic conditions are roughly equal contributors to the 1.1 percent overall increase in ED visits. But the increase in ED visits linked to chronic conditions is not statistically signifi cant at conventional levels.
Column 2a shows that the percentage increase in visits is especially large for and alcohol- related medical conditions. In the emergency department, such visits increase by nearly 6 percent after the stimulus payments.17 This estimate is surprising, given that Parker et al. (2011) estimate only a 0.9 percent marginal propensity to con-sume on alcohol out of the 2008 stimulus payments. At the same time (Column 2b), visits unrelated to drugs or alcohol increase by nearly 1 percent in the ED. Drugs and alcohol thus contribute a notable share of the total increase in ED visits, but because of the low baseline share of these conditions in ED visits, we estimate that they account for only one- fi fth of the overall increase in visits.18
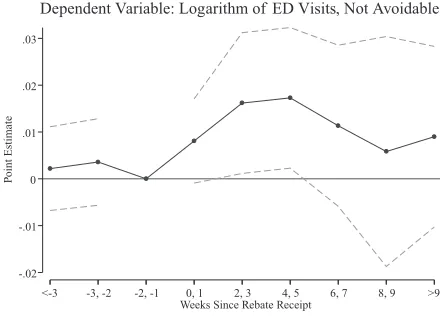
Finally, Columns 3a and 3b of Table 4 document that the overall effect on emer-gency visits is not driven by “avoidable” conditions for which timely outpatient care could have suffi ced. All estimates for avoidable visits are close to zero. The confi dence interval for all hospital visits (in the third panel of Table 4) rules out a change in avoid-able hospitalizations greater than 1.3 percent.
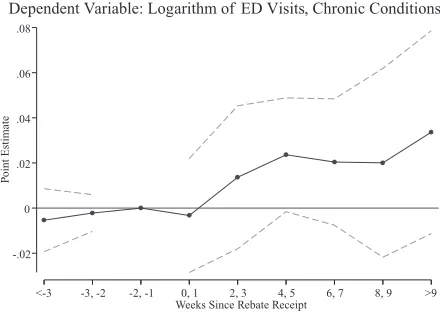
To measure the relevant adjustment dynamics for the outcomes studied in Table 4, we again estimate distributed- lag models. Figure 2 presents the results of such models for emergency department visits. The fi gure generally demonstrates similar patterns as in Figure 1. For all outcomes except avoidable visits, we observe a statistically signifi cant increase in visits around one month after the payments were sent. In all cases, the effect of the stimulus payments nine weeks after they are sent is statisti-cally insignifi cant at the 5 percent level. Still, the magnitude of the point estimates suggests that the risk of a visit did not return to baseline. For instance, the point estimates suggests that drug- and alcohol- visits increased by roughly 5 percent for weeks after the stimulus payments. This pattern is consistent with the fi nding of Parker et al. (2011) that some of the consumption impact of the stimulus is detectable at a one- quarter lag. That said, the confi dence intervals in all of the fi gures widen in the weeks after the checks are distributed. More importantly, after nine weeks, all groups have been sent their checks, and thus we possess no control group that has not yet received its check. We thus view the long- term estimates as speculative rather than conclusive.
In summary, Table 4 and the associated fi gures imply that the increase in ED visits overall is driven by visits that tend: (1) not to be related to chronic conditions, (2) to be drug- and alcohol- related, and / or (3) not to be avoidable. All of these characteristics point to a health response that is characterized less by a direct response to liquidity as by an indirect response. The results suggest that the stimulus payments changed households’ consumption, which in turn worsened health and increased hospital uti-lization.
17. Drug- and alcohol- related visits account for roughly 4 percent of all ED visits. Drug- and alcohol- related inpatient visits, in contrast, do not increase.
436
Figure 2
Distributed- Lag Estimates by Medical Condition
Notes: Each fi gure plots point estimates from a regression of log counts of visits on a set of indicators for two- week intervals. The dotted lines plots 95 percent confi dence intervals that are robust to autocorrelation between observations from the same SSN group. SSN group fi xed effects, week fi xed effects, and an indicator for whether direct deposits had been made are also included in the regressions. The omitted time period is one and two weeks before rebate checks were sent. Chronic, avoidable, and drug- related conditions are described in Section III.B of the text.
-.02 0 .02 .04 .06 .08
P
oint Estimate
<-3 -3, -2 -2, -1 0, 1 2, 3 4, 5 6, 7 8, 9 >9 Weeks Since Rebate Receipt
Dependent Variable: Logarithm of ED Visits, Chronic Conditions
-.01 0 .01 .02
P
o
int Estimate
<-3 -3, -2 -2, -1 0, 1 2, 3 4, 5 6, 7 8, 9 >9 Weeks Since Rebate Receipt
Dependent Variable: Logarithm of ED Visits, not Chronic Conditions
-.04 -.02 0 .02 .04
P
oint Estimate
<-3 -3, -2 -2, -1 0, 1 2, 3 4, 5 6, 7 8, 9 >9 Weeks Since Rebate Receipt
Figure 2 (continued) -.02 -.01 0 .01 .02
P
oint Estimate
<-3 -3, -2 -2, -1 0, 1 2, 3 4, 5 6, 7 8, 9 >9 Weeks Since Rebate Receipt
-.05 0 .05 .1 .15 .2
P
oint Estimate
<-3 -3, -2 -2, -1 0, 1 2, 3 4, 5 6, 7 8, 9 >9 Weeks Since Rebate Receipt
Dependent Variable: Logarithm of ED Visits, Drug-Related
-.01 0 .01 .02
P
oint Estimate
<-3 -3, -2 -2, -1 0, 1 2, 3 4, 5 6, 7 8, 9 >9 Weeks Since Rebate Receipt
The Journal of Human Resources 438
C. The effect of the stimulus payments by patient characteristics
This section explores which patients are responsible for the results above. We divide patients by proxies of their socio- economic status. Specifi cally, we match each patient to their zip code of residence, and each zip code to the median household income recorded in the 2000 census. We defi ne a zip code as low- income if its median house-hold income is between percentiles 0 through 30 of the zip code income distribution, middle- income if its median income is between percentiles 31 through 70, and high- income if its median income is between percentiles 71 through 100. We also separate patients by the insurance status recorded in the administrative data (privately insured, publicly insured, or uninsured). If liquidity constraints constitute barriers to care, they would be most consequential for the uninsured and those with low income.
Table 5 presents estimates when we separate the patients by income. The fi rst three columns present the treatment effect for patients from low- income, middle- income, and high- income zip codes. The point estimates present no clear pattern in treatment effects. In the emergency department, the stimulus payments led to a roughly equal increase in visits across income categories. Any increase in inpatient visits, however, was driven solely by residents of low- income zip codes.
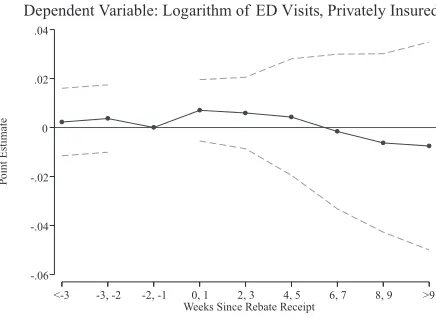
The remaining columns of Table 5 present estimates by insurance status of the pa-tient. In the emergency department, the estimated treatment effects are nearly identical for publicly insured and uninsured patients, but the effect of the stimulus payments on privately insured visits is close to zero. Estimates for inpatient visits, in contrast, are more variable.
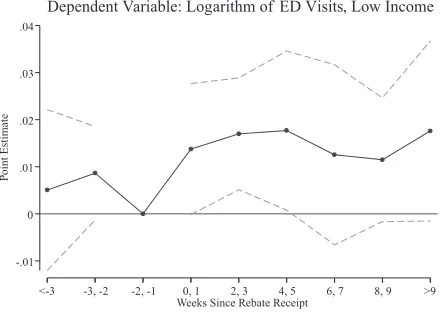
Figure 3 presents distributed- lag estimates for these outcomes in the emergency de-partment. The fi gure makes clear that ED visits by publicly insured patients increased dramatically after the checks were sent. In contrast, the pattern of point estimates for pri-vately insured and uninsured patients are much less precise. Additionally, while the point estimates in Table 5 are similar across income groups, the dynamics indicate that only low- income patients exhibited a short- lived, statistically signifi cant increase in ED visits. Taken as a whole, Table 5 and Figure 3 do not suggest a clear pattern based on socioeconomic status or insurance status. The fi gures suggest that the treatment effect was concentrated in lower- income groups, but the simple difference- in- difference re-sults do not demonstrate such a contrast. Moreover, the pattern of estimates is similar between uninsured and publicly insured patients, even though fi nancial barriers to care vary by insurance status. For instance, the publicly insured typically face the lowest copayments and deductibles, and yet Table 5 suggests that publicly insured visits were affected in a similar manner as uninsured visits. This further suggests that the direct channel is not responsible for the overall treatment effect.
IV. Evidence from Expenditure Data
G
ros
s a
nd
T
oba
cm
an
439
Low Income (1)
Middle Income (2)
High Income (3)
Privately Insured (4)
Publicly Insured (5)
Uninsured (6)
A. Dependent variable: Logarithm of ED visits
After Check Sent 0.006 0.009 0.010 0.004 0.017 0.011
(0.005) (0.005) (0.008) (0.007) (0.005) (0.008)
[0.283] [0.103] [0.239] [0.514] [0.009] [0.177]
Average visits / week 32,362 43,914 33,065 39,913 38,373 16,790
B. Dependent variable: Logarithm of inpatient visits
After Check Sent 0.013 0.005 –0.008 0.007 0.006 –0.018
(0.006) (0.008) (0.007) (0.011) (0.004) (0.018)
[0.071] [0.538] [0.271] [0.516] [0.127] [0.340]
Average visits / week 13,742 19,096 14,919 15,736 29,498 1,672
C. Dependent variable: Logarithm of all visits
After Check Sent 0.008 0.008 0.005 0.005 0.012 0.009
(0.005) (0.004) (0.005) (0.007) (0.003) (0.007)
[0.132] [0.068] [0.413] [0.477] [0.002] [0.250]
Average visits / week 46,104 63,010 47,984 55,649 67,871 18,461
440
Figure 3
Distributed Lag Estimates by Patient Demographics
Notes: Each fi gure plots point estimates from a regression of log counts of visits on a set of indicators for two- week intervals.The dotted lines plot 95 percent confi dence intervals that are robust to autocorrelation between observations from the same SSN group. SSN group fi xed effects, week fi xed effects, and an indicator for whether direct deposits had been made are also included in the regressions.The omitted time period is one and two weeks before rebate checks were sent. Zip codes are defi ned as low, middle, and high- income if their median household income is between percentiles 0–30, 30–70, and 70–99 of the zip code income distribution, respectively.
-.06 -.04 -.02 0 .02 .04
P
oint Estimate
<-3 -3, -2 -2, -1 0, 1 2, 3 4, 5 6, 7 8, 9 >9 Weeks Since Rebate Receipt
Dependent Variable: Logarithm of ED Visits, Privately Insured
-.02 0 .02 .04 .06
P
oint Estimate
<-3 -3, -2 -2, -1 0, 1 2, 3 4, 5 6, 7 8, 9 >9 Weeks Since Rebate Receipt
Dependent Variable: Logarithm of ED Visits, Publicly Insured
-.04 -.02 0 .02 .04 .06
P
oint Estimate
<-3 -3, -2 -2, -1 0, 1 2, 3 4, 5 6, 7 8, 9 >9 Weeks Since Rebate Receipt
Figure 3 (continued) -.01
0 .01 .02 .03
P
oint Estimate
<-3 -3, -2 -2, -1 0, 1 2, 3 4, 5 6, 7 8, 9 >9 Weeks Since Rebate Receipt
-.02 0 .02 .04
P
oint Estimate
<-3 -3, -2 -2, -1 0, 1 2, 3 4, 5 6, 7 8, 9 >9 Weeks Since Rebate Receipt
Dependent Variable: Logarithm of ED Visits, Medium Income
-.04 -.02 0 .02 .04
P
oint Estimate
<-3 -3, -2 -2, -1 0, 1 2, 3 4, 5 6, 7 8, 9 >9 Weeks Since Rebate Receipt
The Journal of Human Resources 442
In particular, they may have substituted visits to the emergency department for other forms of less expensive care outside of the hospital. This section attempts to rule out such a possibility, and thereby reinforce the conclusion that worsening health was the reason for increased emergency care episodes.
We perform this test by replicating and extending analysis by Parker et al. (2011) on the expenditure effects of the 2008 stimulus payments. Parker et al. (2011) use the Consumer Expenditure Survey (CEX), which included a special module with ques-tions on the stimulus payments. A disadvantage of the CEX is its low (quarterly) time resolution. The CEX allows confi dent estimation of only the contemporaneous effect of the tax rebate and one, quarter- long lag. On the other hand, the CEX asks respondents about their expenditures in many areas, including many categories of health care.
We estimate the change in health care consumption per dollar of stimulus payment.19 Specifi cally, we regress changes in nine categories of health- related expenditures on the contemporaneous and once- lagged tax rebate amount. Following Parker et al. (2011), we use indicators for tax rebate receipt and lagged tax rebate receipt as in-strumental variables. We control for age, the change in the number of adults in the household, the change in the number of children in the household, and a full set of indicator variables for the month of the survey interview.
Table 6 presents estimates of these regressions. The fi rst column replicates the es-timates of Parker et al. (2011). It demonstrates that $0.023 of each stimulus payment dollar was spent on health in the two quarters after rebate receipt.20 That change in spending is not statistically signifi cant at conventional levels; the p- value is 0.397.
The remainder of Table 6 decomposes this increase in health expenditures into sub-categories.21 Columns 2 through 5 report the effects on the four health subcategories included in the CEXFMLY data fi les: health insurance, medical services, prescription drugs, and medical supplies. Using the CEXMTAB data fi les, we further decompose the medical services expenditures into the outcomes listed in Columns 6 through 9.
None of the estimates in Columns 1 through 9 are statistically signifi cant at con-ventional levels, and the point estimates tend to be economically small. The results provide no evidence of a change (in either direction) in outpatient care as a result of the stimulus payments. Parker et al. (2011) do document large consumption responses in other areas, like car purchases, without an obvious connection to hospital utiliza-tion. Consistent with our evidence from the hospital utilization data of an increase in alcohol- and drug- related emergency visits, the fi nal column in Table 6 replicates the fi nding of Parker et al. (2011) that the stimulus payments did have a statistically signifi cant effect on the purchase of alcoholic beverages. We estimate that $0.011 of every stimulus payment dollar was spent on alcohol.22
19. Because the CEX includes questions about the payments themselves, we can estimate not only the effect of stimulus payment eligibility during a given week but also the effect of the payments.
20. The dependent variable in Table 6 is a change in quarterly expenditure. 21. Note that all of this spending is out- of- pocket.
443
Rebate effect 0.023 –0.003 0.006 0.010 0.010 0.002 –0.004 –0.005 0.005 0.011
(0.028) (0.012) (0.022) (0.007) (0.007) (0.010) (0.005) (0.006) (0.013) (0.005) [0.397] [0.804] [0.787] [0.155] [0.156] [0.881] [0.418] [0.413] [0.685] [0.018]
Share of nondurable expenditure
0.129 0.081 0.027 0.017 0.003 0.003 0.000 0.008 0.009 0.015
Quarterly expenditure ($)
761.33 437.78 201.71 98.02 23.82 28.63 6.45 49.97 71.65 85.42
The Journal of Human Resources 444
V. Discussion
We fi nd that the 2008 Economic Stimulus Payments increased emer-gency department visits by over 1 percent, a result that is diffi cult to reconcile with the LCH / PIH. The increase was driven by nondiscretionary visits and did not differ by insurance status. This suggests that the stimulus payments did not affect health care consumption directly by expanding the short- run budget set. Rather, the effect was in-direct: the payments provided liquidity that was dangerous to some recipients’ health, leading to additional emergency care.
These fi ndings have several implications. First, optimal health policy depends in part on how health care utilization responds to household fi nances. Copayments and deductibles are often viewed as useful for improving the effi ciency of decisions to seek medical care. However, to the extent that hospital utilization is not affected through the direct channel of an expanded short- run budget set, copayments, deductibles, and other deviations from full insurance may be less useful.
Second, we contribute to the literature on the effects of fi scal policy. In 2008, the Economic Stimulus Payments distributed by paper check appear to have caused a statistically signifi cant, small increase in hospital utilization. Because hospital visits are relatively severe indicators of health, this result may have been counterbalanced by improvements in the rest of the health distribution that we do not observe. The effects we fi nd are too small to speak decisively to debates about the overall effectiveness of
fi scal policy. Instead, our fi ndings are best viewed as an example of how the effects of fi scal policy can be detected beyond standard economic variables, for example on proxies for well- being.
Finally, the fi nding that liquidity can be dangerous has implications for the imple-mentation of transfer programs. Payments made by direct deposit or electronic benefi t transfer might be less salient than those made by paper check, and they also might receive mental accounting treatment that makes them less susceptible to use for risky consumption (Sahm, Shapiro, and Slemrod 2012). Of course, the purpose of the Eco-nomic Stimulus Act of 2008 was to encourage consumption broadly. The question of how transfer design can engender the optimal mix of consumption is ripe for future research.
References
Aizer, Anna. 2007. “Public Health Insurance, Program Take- Up and Child Health.” Review of
Economics and Statistics 89(3):400–15.
Dafny, Leemore, and Jonathan Gruber. 2005. “Public Insurance and Child Hospitalizations: Access and Effi ciency Effects.” Journal of Public Economics 89(1):109–29.
Dehejia, Rajeev, and Adriana Lleras- Muney. 2004. “Booms, Busts, and Babies’ Health.”
Quarterly Journal of Economics 119(3):1091–130.
Dobkin, Carlos, and Steven Puller. 2007. “The Effect of Government Transfers on Monthly Cycles in Drug Abuse, Hospitalization and Mortality.” Journal of Public Economics
91(11–12):2137–57.
———. 2012. “Liquidity, Economic Activity, and Mortality.” Review of Economics and Statis-tics 94(2):400–18.
Evans, William, and Steven Snyder. 2006. “The Impact of Income on Mortality: Evidence from the Social Security Notch.” Review of Economics and Statistics 88(3):482–95. Gross, Tal, Matthew J. Notowidigdo, and Jialan Wang. Forthcoming. “Liquidity Constraints
and Consumer Bankruptcy: Evidence from Tax Rebates.” Review of Economics and Statis-tics.
Grumbach, Kevin, Dennis Keane, and Andrew Bindman. 1983. “Primary Care and Public Emergency Department Overcrowding.” American Journal of Public Health 83(3):372–78. Internal Revenue Service. 2008. “IRS Announces Economic Stimulus Payment Schedules,
Provides Online Payment Calculator.” (IR- 2008- 44). www .irs .gov / newsroom / article / 0,,id=180247,00 .html.
Johnson, David, Jonathan Parker, and Nicholas Souleles. 2006. “Household Expenditure and the Income Tax Rebates of 2001.” American Economic Review 96(5):1589–610.
Kolstad, Jonathan, and Amanda Kowalski. 2010. “The Impact of Health Care Reform on Hospital and Preventive Care: Evidence from Massachusetts.” Journal of Public Economics
96(11–12):909–29.
Lusardi, Annamaria, Daniel Schneider, and Peter Tufano. 2010. “The Economic Crisis and Medical Care Usage.” Working Paper 15843, National Bureau of Economic Research. Miller, Doug, Marianne Page, Ann Huff Stevens, and Mateusz Filipski. 2009. “Why Are
Recessions Good for Your Health?” American Economic Review: Papers & Proceedings
99(2): 122–27.
Moran, John, and Kosali Simon. 2006. “Income and the Use of Prescription Drugs by the Elderly: Evidence from the Notch Cohorts.” Journal of Human Resources 41(2):411–32. Parker, Jonathan, Nicholas Souleles, David Johnson, and Robert McClelland. 2011. “Consumer
Spending and the Economic Stimulus Payments of 2008.” Working Paper 16684, National Bureau of Economic Research.
Ruhm, Christopher. 2000. “Are Recessions Good for Your Health?” Quarterly Journal of
Economics 115(2):617–50.
Sahm, Claudia, Matthew Shapiro, and Joel Slemrod. 2012. “Check in the Mail or More in the Paycheck: Does the Effectiveness of Fiscal Stimulus Depend on How It Is Delivered?”
American Economic Journal: Economic Policy 4(3):216–50.
Shapiro, Matthew, and Joel Slemrod. 2009. “Did the 2008 Tax Rebates Stimulate Spending?”