S
ATISFACTION
: E
VIDENCE FROM THE
HILDA S
URVEY
MARKWOODEN* ANDDIANAWARREN*
I
t is widely assumed that non-standard employment arrangements, and especially casual employment, involve employment conditions that are inferior to more traditional employment arrangements. This paper uses data from the first wave of the Household, Income and Labour Dynamics in Australia (HILDA) Survey to examine this issue. These data suggest that workers do not necessarily see non-standard employment as undesirable. First, workers on fixed-term contracts are more satisfied with their jobs than other workers. Second, the lower levels of job satisfaction among casual employees are restricted to those working full-time and even then the size of the effect is only marked among male employees.INTRODUCTION
One of the distinctive features of the Australian labour market is the high incidence of casual employment. According to Australian Bureau of Statistics (ABS) data, for example, just over 27 per cent of all employees were employed on a casual basis (in their main job) in August 2002. Moreover, these same data indicate marked growth in recent decades, with the comparable rate of casual employment in 1984 being just under 16 per cent (Dawkins & Norris 1990: 164).1 For many academic commentators this growth in the casual employment share is seen as an unfortunate by-product of many years of economic reform. Campbell (1996a), for example, argues that casual employees are typically without the legislative protections accorded other employees. He highlights the possibility that many casual employees are outside the coverage of the awards system or, when they are covered, are vulnerable to the evasion of award conditions. Moreover, he goes on to argue that even those casual employees who are subject to effective regulation are likely to enjoy few of the safeguards typically provided to non-casuals. Most often mentioned here is the greater job insecurity arising from casual employment, though other negative aspects of casual employment, such as low pay, limited opportunities for career progression, unsatisfactory working hours, low levels of access to work-related training and low levels of union representation are also frequently mentioned (e.g. Romeyn 1992;, Burgess 1996; Campbell 1996b). Quantitative evidence
documenting these differences in the quality of jobs by employment status, however, is relatively scarce.
Another key weakness in much of the research to date has been the tendency to think of employment as falling into one of two types – casual employment and permanent employment. As Campbell and Burgess (2001: 89) have observed, however, there is a third group of employees with a distinctive type of employ-ment contract who do not fit easily into either of these two groups. This is the group of employees on fixed-term contracts. Researchers have generally ignored this group, though there are a number of notable exceptions (Hall et al. 1998; VandenHeuvel & Wooden 2000; Waite & Will 2002).
In this paper, data are presented from a new national survey that, among other things, collected extensive information about job characteristics and employment experiences. Among the variables collected is a self-reported measure of employment contract status that distinguishes between three types of employment arrangements: fixed-term employment contracts, casual employment, and permanent or ongoing employment. The analysis uses these data to identify how the quality of the employment experience, as assessed through a subjective measure of job satisfaction, varies across workers in these three groups.
PREVIOUS RESEARCH
The earliest studies into casual employment in Australia were relatively modest in scope and concentrated on quantifying its extent, identifying the industries and occupations in which it was concentrated and discussing possible explanations for the rising trend in its incidence (Dawkins & Norris 1990; Lewis 1990; Romeyn 1992). Subsequently, the number of journal articles, reports and papers on the issue of casual employment in Australia has grown enormously. Despite this, relatively little serious attention has been paid to the quality of the jobs that are filled by casual employees. Even much of the case-study research that has been conducted on casual employment has tended to ignore issues relating to job quality and has instead focused on the reasons why employers use casual employment (and other types of ‘non-standard’ employment) and the factors that shape labour use strategies (e.g. Probert 1995; Whitehouse et al. 1997; Allan 1998; Weller et al. 1999). There are, of course, exceptions (e.g. Walsh & Deery 1997 Smith & Ewer 1999), but as a whole the case-study research remains unconvincing, partly because case-studies are by their nature selective, and partly because job quality is so badly measured.
especially permanent part-time work, may not be as large as usually presumed (e.g. Whitehouse et al. 1997; Junor 1998).
Another explanation for the low level of research activity on this issue is the absence of appropriate data. In Australia the collection of survey-based data on any significant scale has mostly been left to the ABS. The ABS approach to both data collection and dissemination, however, means that for the purpose of examining the relationship between employment status and job quality, their data are far from ideal. First, the ABS has traditionally steered away from collecting subjective opinion-based information. As such, most ABS employment surveys collect information about relatively objective job characteristics such as earnings, the number of hours worked and, though less frequently, duration of job tenure, but rarely much else. Second, the ABS has restricted access to unit-record data, and hence often forcing researchers to rely solely on cross-tabulated data. This is a serious weakness given that it is widely recognised that the types of workers who fill casual jobs are very different from the types of workers who fill the non-casual jobs. There have, however, been exceptions. The various Surveys of Training and Education, for example, have been made available in unit-record form and as a result it has been well established that casual workers are far less likely to participate in employer-provided training programs than non-casual employees, even after other personal and other job characteristics are controlled for (e.g. Baker & Wooden 1992; Miller 1994; Wooden 1996).
Nevertheless, it was not until the 1995 Australian Workplace Industrial Relations Survey (AWIRS) data were released that researchers had access to a large national database that both enabled casual workers to be identified and included a range of measures of job quality.2Hall et al. (1998) were the first to exploit this feature of the data. They separated the workforce into six distinct categories based on hours of work (full-time or part-time) and contractual employ-ment status (permanent, casual or fixed-term) and then examined how employees in each of these categories varied in their responses to questions about control over work, job satisfaction and a range of other work attitudes (e.g. with respect to fairness of pay, job stress, job insecurity and the like). On the basis of simple correlation coefficients it was concluded that contingent work (that is, casual work) ‘continues to be characterised by low pay, limited control and discretion, relative exclusion from workplace decision-making, a lack of task diversity and a high level of dissatisfaction with the amount of work provided by employers’ (Hall et al. 1998: 77). However, their results also demonstrated that, on average, casual workers report higher levels of overall job satisfaction and more favourable responses on a range of other attributes, such as fairness of pay and job stress.
Perhaps more importantly, when assessing overall job satisfaction, their results suggested that it was not the casual distinction that matters so much, but hours of work. For all three categories of workers, the part-time employees were at least 40 per cent more likely to report being satisfied with their jobs than comparable employees working standard hours (defined as between 35 and 44 hours per week).
This more benign interpretation of the data is also supported in Hall and Harley (2000). Again on the basis of data from the 1995 AWIRS, they acknowledged that many casual and fixed-term contract employees have positive feelings about their jobs. Their main conclusion, however, was that casual and fixed-term contract employees are not homogenous groups and that attitudes about jobs vary markedly across industry sectors.
Finally, in 2001 the Australian Centre for Industrial Relations Research and Training (ACIRRT) conducted its own survey of Australian employees with a view to assessing quality of working life. They collected subjective data from a sample of 1001 employed people on the degree of satisfaction and dissatisfaction with 14 different aspects of work. Initial findings from this survey are summarised in Considine and Callus (2002). Unfortunately, differences by employment type were not reported in any detail. However, it was reported that the mean score on an index that combines all 14 items was not significantly different for permanent and casual employees.
Overall, recent survey data suggest that the ‘bad job’ tag that is traditionally attached to casual employment may not be deserved. Nevertheless, it is just as clear that more research is warranted. The data that have been used are often far from ideal and more attention needs to be paid to ensuring that the marked differences that exist in the human capital endowments (and other characteristics) of the average casual employee and the average non-casual employee are taken into account.
HILDA SURVEY DATA
The data used in this analysis come from the first wave of the Household, Income and Labour Dynamics in Australia (HILDA) Survey. Described in more detail in Watson and Wooden (2002), the HILDA Survey is based on similar studies conducted in both Germany and the UK (the German Socio-Economic Panel and the British Household Panel Survey, respectively). The HILDA Survey thus involved the selection of a nationally representative sample of households and then seeking interviews with members of those households (who were over the age of 15 years on the 30 June preceding interview). In addition, all persons completing a personal interview were given a self-completion questionnaire which they were asked to return, once completed, either by mail or by handing it to the interviewer at a subsequent visit to the household. Almost all of the interviews were conducted during the period between 24 August and 21 December 2001.
across Australia. Within each of these CDs all dwellings were fully enumerated and a sample of private dwellings (approximately 25 per CD) randomly selected.3 After adjusting for out-of-scope dwellings and households (e.g. unoccupied or non-residential dwellings) and for multiple households within dwellings, the total number of households identified as in-scope was 11 693. Interviews were completed with all eligible members at 6872 of these households and with at least one eligible member at a further 810 households. The total household response rate was, therefore, 66 per cent. Within the 7682 households at which interviews were conducted, there were 19 917 people. Of this group, 4790 were under 15 years of age on the preceding 30 June and hence were ineligible for an interview in Wave 1. This left 15 127 persons eligible for a personal interview, 13 969 of which were successfully interviewed.4
As discussed in Wooden et al. (2002), these response rates compare favourably with the rates achieved in the first waves of similar major household panel surveys conducted in other Western nations. More importantly, comparisons with population benchmark data from ABS sources suggest that the sample has characteristics that are broadly in line with what would have been expected if the sample were truly random. In any case, observable differences between the responding and selected samples can be corrected for with the application of population weights that are provided with the data.
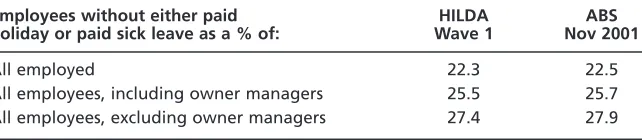
For this study what obviously matters most is that casual employees (and employees on fixed-term contracts) are adequately represented. In Table 1, therefore, a comparison of estimates from the HILDA Survey and from the ABS Forms of Employment Survey (FOES), conducted in November 2001, is presented using the traditional ABS measure of casual employment (based on access to entitlements to paid annual leave and paid sick leave). The FOES is an ideal reference source given that it was undertaken at a time coincident with the HILDA Survey fieldwork period and employed close to identical population coverage rules to that used in the HILDA Survey. In addition, the published data from the FOES readily enable the identification of owner-managers. This is important since in the HILDA Survey owner-managers
Table 1 Leave entitlements status of employees: HILDA survey and ABS survey estimates compared
Employees without either paid HILDA ABS
holiday or paid sick leave as a % of: Wave 1 Nov 2001
All employed 22.3 22.5
All employees, including owner managers 25.5 25.7
All employees, excluding owner managers 27.4 27.9
Notes:1. The HILDA Survey data have been weighted to ensure sample reflects broader population. 2. Owner-managers have been excluded from the numerator in all calculations.
Sources: HILDA: confidentialised unit-record data from HILDA Survey Wave 1 (2001), Release 1, October 2002.
are not asked about access to leave entitlements. As a consequence, owner-managers have been excluded from the numerator in all of the estimates presented in Table 1.
As can be seen, the estimates of casual employment from the two surveys are very similar. Some differences are to be expected given the variation in the timing of the survey reference periods and given the FOES is conducted on an ‘any responsible adult basis’ (meaning persons can answer on behalf of other household members) whereas in the HILDA Survey all data about a respondent’s employment are collected directly from that respondent. Both surveys indicate that, in late 2001, approximately 22 per cent of the employed workforce was employed on a casual basis, using the leave entitlements definition. If we restrict the population of interest to employees and also exclude those owner-managers that the ABS treats as employees of their own business, then the percentage rises to between 27 and 28 per cent.
CLASSIFYING EMPLOYEES
Despite the widespread use made of ABS data in quantifying the extent of casual employment, identifying casual employees is no simple matter. Common law definitions, for instance, impose very few constraints on the form casual employ-ment can take (Owens 2001: 119). While it is generally accepted that under common law ‘each engagement of casual workers constitutes a separate contract of employment’ (Brooks 1985: 166), this still does not mean casual employment is necessarily restricted to short-term, intermittent employment. That is, a casual employee could be employed on a series of contracts and, from the perspective of employment continuity at least, may be observationally indistinguishable from a non-casual employee.
For many employment matters, however, common law is largely irrelevant; far more important have been the conditions set down in awards and agreements. The definitions of casual employment that can be found in awards, however, are extremely varied and in many cases provide little guidance as to the employment conditions that define casualness. Indeed, as has long been recognised, in many awards a casual employee is defined simply as ‘one engaged and paid as such’ (Campbell 1996a: 48). Moreover, Owens (2001: 120–121) claims that this very unhelpful type of definition will have become even more widespread following the Award Simplification decision of 1997.
type and qualification for these entitlements and hence this measure will be less than perfect.
The standard ABS measure also suffers from other weaknesses. First, like any survey, it will be subject to reporting errors. Most obviously, some respondents may confuse use of entitlements with access to entitlements. Reporting errors are not necessarily a problem if they are random, but in this case there are good reasons to expect some systematic under-reporting of entitlements, especially with respect to paid sick leave.
Second, some respondents are unable to provide an answer to the questions about access to leave entitlements and in these instances the ABS codes the answers as equivalent to a ‘no response’. This seems problematic, especially given the survey method used by the ABS allows for household members to answer on behalf of others.
Third, as is now well recognised (Campbell 1996b; Campbell & Burgess 2001; Murtough & Waite 2000; Wooden & Hawke 1998), included in the standard ABS definition of an employee are owner managers of incorporated businesses, who are treated as employees of their own business. Many of these respondents, however, are likely to respond that they do not give themselves paid sick leave or paid annual leave and would thus be classified by the ABS as a casual employee.
Finally, and as noted earlier, the ABS approach assumes that all employees can be classified into two groups — casual employees and the somewhat misleadingly labelled permanent employees. This does not work well for workers on fixed-term employment contracts. Such employees tend to have entitlements to paid sick leave and paid annual leave and hence will mostly be assigned to the permanent employee group, yet on any objective criteria per-manent employment status is exactly what this type of worker does not have. Indeed, in most European data collections, employees on fixed-term employment contracts would fit perfectly into their definition of temporary employment, whereas most casual employees would not. The OECD has thus recently assembled data on temporary employment across countries that explicitly reject equating casual employment in Australia with temporary employment elsewhere (OECD 2002; see also Wooden 2001b).
The latter has literally been the subject of many hundreds of empirical studies and it is now well accepted that even simple global self-report measures about overall happiness and life satisfaction generally possess adequate statistical properties (Diener et al. 1999: 277–278).
In the analysis presented in this paper we rely on self-reported data about employment contract type. The relevant question used in the HILDA Survey, however, is superior to that used in the FOES in at least two notable ways. First, all employees (excluding owner-managers) are asked to indicate which category of employment they fall into and not just those who indicated they did not receive either paid annual leave or sick leave. Second, in line with the recommendations of Campbell and Burgess (2001), the question in the HILDA Survey asks respondents to classify themselves into one of three categories: (i) permanent or ongoing; (ii) casual; and (iii) fixed-term.5A respondent can thus not have a fixed-term employment contract and be classified as a permanent employee, as can happen in the ABS data.
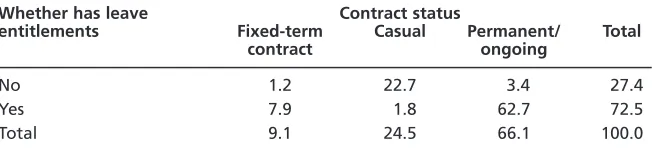
A summary of the population-weighted responses to this question, cross-tabulated by the traditional ABS measure of casual employment status based on leave entitlements, is provided in Table 2. This table reveals that access to leave entitlements is highly correlated with self-reported casual employment status, with 92.7 per cent of casual employees also reporting not having paid annual leave or sick leave entitlements. Nevertheless, use of leave entitlements causes the casual employment share to be overstated by almost three percentage points, with around 17 per cent of employees who reported not having leave entitlements indicating that they were employed on either an ongoing basis or on a fixed-term contract.
JOB SATISFACTION AND EMPLOYMENT CONTRACT STATUS
Isolating the attributes of jobs that would enable good jobs to be distinguished from bad jobs is an extremely difficult exercise for at least two reasons. First, there are a great many dimensions to jobs that contribute to overall worker well-being. 282 TH E JO U R N A L O F IN D U S T R I A L RE L AT I O N S September 2004
Table 2 Leave entitlements by self-reported employment contract status (%): Employees, excluding owner managers
Whether has leave Contract status
entitlements Fixed-term Casual Permanent/ Total
contract ongoing
No 1.2 22.7 3.4 27.4
Yes 7.9 1.8 62.7 72.5
Total 9.1 24.5 66.1 100.0
Notes:1. The data have been weighted to ensure sample reflects broader population.
2. The total includes a small number of cases that could not be classified according to contract status.
Second, there is likely to be great variation across individual workers in the weight assigned to different job attributes. Consider, for example, a worker who has been offered employment in two jobs and on most objective criteria job A seems better than job B; it involves better pay, more stimulating tasks and much more security of employment. Job B, however, provides much greater work-time flexibility. Which job will be preferred by the worker will depend on the relative weight placed on each of these attributes and if the worker places sufficiently large weight on work-time flexibility, job B will be preferred. Survey data, however, typically does not provide us with the information necessary to construct such weights. As a consequence, in this analysis we make no effort to measure objective job characteristics and instead rely on self-reported measures of satisfaction with the job. This seems a reasonable approach if it is accepted, as we do, that enhancing job quality is essentially about enhancing the utility individuals derive from work, and as Clark (1997: 344) has observed, ‘job satisfaction may be as close as we are likely to come to a proxy measure of utility at work’. Nevertheless, we accept that job satisfaction is, at best, an imperfect reflection of job quality.
The HILDA Survey provided measures of satisfaction with five distinct aspects of work: total pay, job security, the work itself, hours worked, and the flexibility available to balance work and non-work commitments. In addition, a measure of overall job satisfaction was also collected. All items were scored on an 11-point (0–10) scale with only the extreme values labeled. The construction of the questions was based on a similar set of questions included in the British Household Panel Survey (BHPS) and which have formed the basis of a number of studies into job satisfaction in Britain (Clark 1996, 1997; Clark et al. 1996; Booth et al. 2002).6
Table 3 summarises the mean responses to these questions cross-classified by employment contract status and sex. The results of formal tests of significance of difference between the mean responses of employees on fixed-term contracts and permanent employees and between casual employees and permanent employees are also presented. Focusing first on men, these simple results suggest that, on average, the most satisfied are those working on fixed-term contracts while the least satisfied are casual employees. Fixed-term contract workers are especially satisfied with the type of work they are doing and while this is apparently offset to some extent by relatively low levels of satisfaction with job security, in terms of overall job satisfaction, fixed-term workers score significantly higher than all other worker types. Male casual employees, on the other hand, when compared with permanent employees, report significantly lower levels of satisfaction with all of the measured job aspects except pay.
284
T
HE
J
OURNAL
OF
I
NDUSTRIAL
R
ELA
TIONS
September
2004
Table 3 Job satisfaction by employment contract status and sex: Employees, excluding owner managers
Sex/type of job satisfaction Mean scores (0–10 scale) t-statistic on difference between: Fixed-term Casual Permanent/ Fixed-term and Casual and
contract ongoing permanent permanent
Men
Pay 6.98 6.63 6.79 1.48 1.60
Job security 7.26 6.77 7.92 4.36 9.88
Work itself 7.93 7.02 7.56 3.44 5.84
Hours worked 7.04 6.85 7.10 0.48 2.55
Flexibility available to balance work 7.24 7.42 7.15 0.62 2.50
and non-work commitments
Overall job satisfaction 7.75 7.18 7.46 2.89 3.30
Women
Pay 6.60 6.92 6.63 0.15 3.03
Job security 7.28 7.32 8.31 6.39 9.96
Work itself 8.01 7.30 7.69 2.92 4.47
Hours worked 7.28 7.24 7.36 0.51 1.25
Flexibility available to balance work 7.47 7.97 7.38 0.60 6.33
and non-work commitments
Overall job satisfaction 7.90 7.68 7.72 1.59 0.52
Notes: 1. The data have been weighted.
2. The t-statistic will differ depending on whether variances are assumed to be equal or not. Levene’s test for equality of variances is used to determine which t-statistic is appropriate.
for the lower levels of satisfaction with job security and the type of work undertaken.
We next examined whether these relationships were dependent on the number of hours worked. This is potentially an important influence given that standard economic theory leads us to expect the utility obtained from work to decline with hours worked and given employment status is highly correlated with hours of work. In Table 4, therefore, we again report mean job satisfaction scores cross-classified by employment contract status and sex, but in this case we also distinguish between those whose main job involved full-time hours (defined here as usually working 35 hours per week or more) and those whose main job involved part-time hours.
Looking first at men, the figures presented in Table 4 suggest two immediate conclusions. First, the higher levels of job satisfaction among employees on fixed-term contracts observed in Table 3 continue to remain even after distinguishing full-time employees from part-time employees. Second, the relatively high levels of job dissatisfaction among male employees in casual jobs are contained to those working full-time jobs. Indeed, men in part-time casual jobs have average levels of overall job satisfaction that are not much below that of men in full-time permanent jobs. The differential between full-time employees in casual and permanent positions is quite marked, with casuals scoring significantly lower on all measured job domains except pay. The differential with respect to job security, which is over two points on the scale, is especially large.
Among women, on the other hand, distinguishing between those in full-time jobs and those in part-time jobs only makes a small difference with, as hypo-thesised, the gap between casuals and permanent employees widening. These differences, however, are still quite small, but do achieve weak significance (at the 10 per cent level) when considering part-time employees.
The final step in this analysis was to determine whether these observed differ-ences are robust to the inclusion of other variables that might impact on job satisfaction, especially if correlated with employment status. For example, it has been well established that young workers tend to be more positive than older workers when reporting job satisfaction (Clark et al. 1996). We also know, however, that young workers are highly concentrated in casual employment. Consequently, if the independent effects of age were held constant, even larger differentials between the satisfaction of employees in casual jobs and those in non-casual jobs might emerge.
286
T
HE
J
OURNAL
OF
I
NDUSTRIAL
R
ELA
TIONS
September
2004
Table 4 Job satisfaction by employment contract status, sex and usual hours worked in main job: Employees, excluding owner managers
Sex/type of job satisfaction Mean scores (0–10 scale) t-statistic on difference between: Fixed-term Casual Permanent/ Fixed-term and Casual and
contract ongoing permanent permanent
Men (full-time)
Pay 6.98 6.57 6.81 1.30 1.65
Job security 7.33 5.76 7.93 3.76 11.02
Work itself 7.92 6.93 7.58 3.14 4.65
Hours worked 7.02 6.81 7.10 0.59 2.05
Flexibility available to balance 7.15 6.53 7.13 0.14 3.14
work and non-work commitments
Overall job satisfaction 7.73 6.84 7.48 2.32 4.75
Men (part-time)
Pay 6.92 6.68 6.36 1.14 1.36
Job security 6.55 7.38 7.84 2.36 2.05
Work itself 7.98 7.08 7.22 1.69 0.62
Hours worked 7.23 6.87 7.13 0.22 1.08
Flexibility available to balance work 8.11 7.95 7.51 1.64 1.99
and non-work commitments
Overall job satisfaction 7.99 7.38 7.07 2.20 1.55
Women (full-time)
Pay 6.57 6.85 6.59 0.09 1.22
Job security 7.38 6.35 8.32 4.87 6.92
Work itself 7.93 7.11 7.71 1.66 2.95
Hours worked 6.88 7.24 7.09 1.16 0.72
Flexibility available to balance work 6.96 7.26 7.08 0.60 0.78
and non-work commitments
N
ON
-ST
ANDARD
E
MPLOYMENT
AND
J
OB
S
A
TISF
ACTION
287
Sex/type of job satisfaction Mean scores (0–10 scale) t-statistic on difference between: Fixed-term Casual Permanent/ Fixed-term and Casual and
contract ongoing permanent permanent
Women (part-time)
Pay 6.66 6.93 6.71 0.21 1.62
Job security 7.10 7.48 8.28 4.10 6.46
Work itself 8.15 7.32 7.65 2.59 2.70
Hours worked 7.96 7.24 7.97 0.05 5.75
Flexibility available to balance 8.33 8.10 8.06 1.17 0.27
work and non-work commitments
Overall job satisfaction 8.18 7.71 7.90 1.64 1.76
Notes:See Table 3.
For reasons of brevity, we only report results for the overall job satisfaction measure. Apart from the pragmatic consideration of length, this again can be defended on the grounds that since we do not know what weight to attach to each of the five aspect-specific job domains, analysis of the domain measures is inherently of less interest.7
We report the results of estimating two specifications. In the first, dummy variables for each of three employment contract types – fixed-term contract, casual and other arrangement – are entered, with on-going or permanent employees acting as the control group and usual hours of work is as entered in its natural log form. In the second specification, we follow VandenHeuvel and Wooden (2000) and interact employment contract status with hours of work.
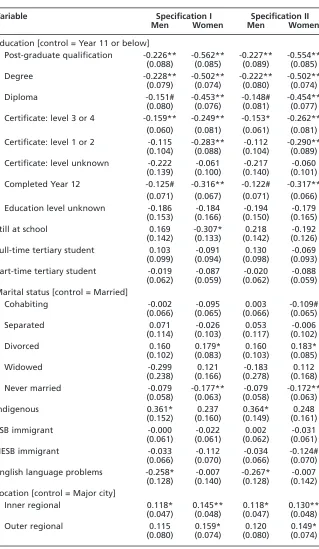
The initial list of variables was based in large part on the variables included in Clark (1996). Thus we included variables for age (specified as a quadratic), health, educational attainment, marital status, ethnic background (represented here by variables identifying indigenous origin, region of birth and English language ability), location, occupation, trade union membership, firm size, industry and sector (i.e. private or public). Most of these variables are relatively straightforward and require little by way of explanation.8The one possible exception here is health which, as in Clark (1996), is a self-reported measure scored on a 5-point scale ranging from poor to excellent.9
We then experimented with a number of additional variables, which led to the subsequent inclusion of variables measuring whether employed through a labour-hire firm or temporary employment agency, shift work arrangements, whether the employee has a formal arrangement with an employer to undertake paid work from home and supervisory status. The indirect sourcing of labour requirements through intermediaries adds another dimension to employment arrangements which is often assumed to be detrimental in its impact on workers (see Watson et al.2003: 74–77). If so, we would expect agency workers to report levels of job satisfaction that are less than other comparable workers. Shift working is also an employment arrangement which is often assumed to be associated with lower levels of job satisfaction given it often requires working at times which conflict with family and leisure pursuits and can impact adversely on health through its disruptive influence on sleeping patterns and physiological rhythms (see Folkard & Monk 1985). Opportunities to work from home, on the other hand, might be expected to enhance job satisfaction given it provides workers with greater ability to combine work with family responsibilities and commitments. Finally, supervisors have jobs which typically involve both greater levels of autonomy and responsibility and thus the expected relationship with job satisfaction is uncertain. Nevertheless, a positive association would be expected if there is competition for supervisory positions.
respondents. As argued by Clark (1997), subjective reports of job satisfaction are likely to be coloured by expectations. Specifically, Clark argued that those who expect less from their jobs would, for any given job, be more satisfied. This argument could easily be applied with respect to non-standard employment. If such employment has traditionally been linked to relatively lowly-paid, unskilled jobs, then it seems reasonable to believe that workers who accept such jobs will not have high expectations of those jobs. It is hoped that the inclusion of the variable measuring the subjective importance of employment will control for this effect.
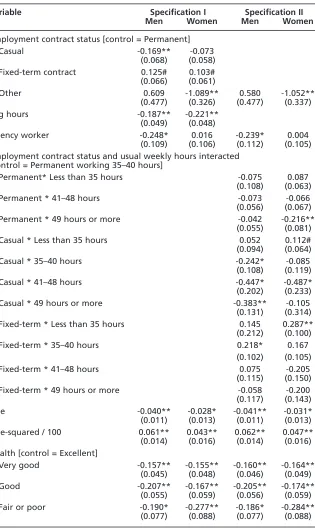
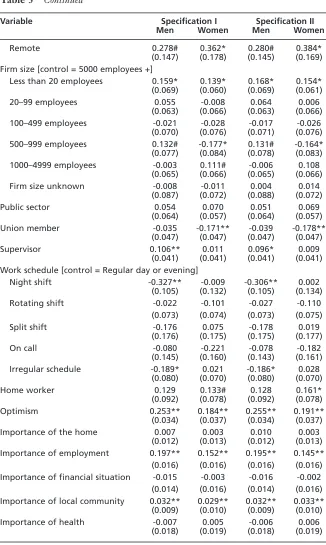
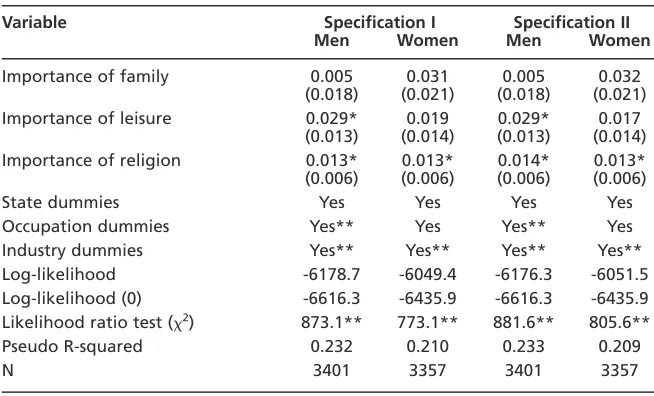
The results of the ordered probit estimation are reported in Table 5. The first point to note is that the estimation of separate equations for men and women is justified, with the satisfaction levels of men and women responding differently to some influences, including not only employment status but also education, marital status, supervisory status, union membership and shift work. Moreover, a formal test for the equality of coefficients leads us to reject the restrictions imposed by pooling the data.
Second, the estimated coefficients are mostly sensible and in line with both expectations and previous research, though high standard errors often mean coefficients are not statistically significant. Thus, as in the work of Clark (1996, 1997), job satisfaction declines with the number of hours worked, exhibits a U-shaped relationship with age, with workers in their early 30s being the least satisfied, and is much higher for those workers who report being in excellent health (the control group), have relatively low levels of education and are employed in small firms. We also find, as Clark (1997) did, that associations between marital status and job satisfaction were only significant for women. Further, and again as in Clark (1997), the negative relationship with union membership is only significant for women.
The relationships with union membership are of interest in their own right. Given unions enhance wages and working conditions for their members, positive relationships might be expected. Negative relationships, however, are more common in previous research, especially if wage effects are separately controlled for, and are usually explained as the outcome of either voice effects (e.g. Freeman 1980) or selection effects wherein workers in the most hazardous and least desirable jobs are attracted to join unions (Borjas 1979). The insignificant relationship for men found here might suggest that these negative effects are offset by the positive impact of unions on wages and conditions. It thus follows that the negative effect for women might reflect the lesser effectiveness of unions in representing women.
290 TH E JO U R N A L O F IN D U S T R I A L RE L AT I O N S September 2004
Table 5 Ordered probit estimates: dependent variable = overall job satisfaction (robust standard errors in brackets)
Variable Specification I Specification II
Men Women Men Women
Employment contract status [control = Permanent]
Casual -0.169** -0.073
(0.068) (0.058)
Fixed-term contract 0.125# 0.103#
(0.066) (0.061)
Other 0.609 -1.089** 0.580 -1.052**
(0.477) (0.326) (0.477) (0.337)
Log hours -0.187** -0.221**
(0.049) (0.048)
Agency worker -0.248* 0.016 -0.239* 0.004
(0.109) (0.106) (0.112) (0.105)
Employment contract status and usual weekly hours interacted [control = Permanent working 35–40 hours]
Permanent* Less than 35 hours -0.075 0.087
(0.108) (0.063)
Permanent * 41–48 hours -0.073 -0.066
(0.056) (0.067)
Permanent * 49 hours or more -0.042 -0.216**
(0.055) (0.081)
Casual * Less than 35 hours 0.052 0.112#
(0.094) (0.064)
Casual * 35–40 hours -0.242* -0.085
(0.108) (0.119)
Casual * 41–48 hours -0.447* -0.487*
(0.202) (0.233)
Casual * 49 hours or more -0.383** -0.105
(0.131) (0.314)
Fixed-term * Less than 35 hours 0.145 0.287**
(0.212) (0.100)
Fixed-term * 35–40 hours 0.218* 0.167
(0.102) (0.105)
Fixed-term * 41–48 hours 0.075 -0.205
(0.115) (0.150)
Fixed-term * 49 hours or more -0.058 -0.200
(0.117) (0.143)
Age -0.040** -0.028* -0.041** -0.031*
(0.011) (0.013) (0.011) (0.013)
Age-squared / 100 0.061** 0.043** 0.062** 0.047**
(0.014) (0.016) (0.014) (0.016)
Health [control = Excellent]
Very good -0.157** -0.155** -0.160** -0.164**
(0.045) (0.048) (0.046) (0.049)
Good -0.207** -0.167** -0.205** -0.174**
(0.055) (0.059) (0.056) (0.059)
Fair or poor -0.190* -0.277** -0.186* -0.284**
Table 5 Continued
Variable Specification I Specification II
Men Women Men Women
Education [control = Year 11 or below]
Post-graduate qualification -0.226** -0.562** -0.227** -0.554**
(0.088) (0.085) (0.089) (0.085)
Degree -0.228** -0.502** -0.222** -0.502**
(0.079) (0.074) (0.080) (0.074)
Diploma -0.151# -0.453** -0.148# -0.454**
(0.080) (0.076) (0.081) (0.077)
Certificate: level 3 or 4 -0.159** -0.249** -0.153* -0.262**
(0.060) (0.081) (0.061) (0.081)
Certificate: level 1 or 2 -0.115 -0.283** -0.112 -0.290**
(0.104) (0.088) (0.104) (0.089)
Certificate: level unknown -0.222 -0.061 -0.217 -0.060
(0.139) (0.100) (0.140) (0.101)
Completed Year 12 -0.125# -0.316** -0.122# -0.317**
(0.071) (0.067) (0.071) (0.066)
Education level unknown -0.186 -0.184 -0.194 -0.179
(0.153) (0.166) (0.150) (0.165)
Still at school 0.169 -0.307* 0.218 -0.192
(0.142) (0.133) (0.142) (0.126)
Full-time tertiary student 0.103 -0.091 0.130 -0.069
(0.099) (0.094) (0.098) (0.093)
Part-time tertiary student -0.019 -0.087 -0.020 -0.088
(0.062) (0.059) (0.062) (0.059)
Marital status [control = Married]
Cohabiting -0.002 -0.095 0.003 -0.109#
(0.066) (0.065) (0.066) (0.065)
Separated 0.071 -0.026 0.053 -0.006
(0.114) (0.103) (0.117) (0.102)
Divorced 0.160 0.179* 0.160 0.183*
(0.102) (0.083) (0.103) (0.085)
Widowed -0.299 0.121 -0.183 0.112
(0.238) (0.166) (0.278) (0.168)
Never married -0.079 -0.177** -0.079 -0.172**
(0.058) (0.063) (0.058) (0.063)
Indigenous 0.361* 0.237 0.364* 0.248
(0.152) (0.160) (0.149) (0.161)
ESB immigrant -0.000 -0.022 0.002 -0.031
(0.061) (0.061) (0.062) (0.061)
NESB immigrant -0.033 -0.112 -0.034 -0.124#
(0.066) (0.070) (0.066) (0.070)
English language problems -0.258* -0.007 -0.267* -0.007
(0.128) (0.140) (0.128) (0.142)
Location [control = Major city]
Inner regional 0.118* 0.145** 0.118* 0.130**
(0.047) (0.048) (0.047) (0.048)
Outer regional 0.115 0.159* 0.120 0.149*
292 TH E JO U R N A L O F IN D U S T R I A L RE L AT I O N S September 2004
Table 5 Continued
Variable Specification I Specification II
Men Women Men Women
Remote 0.278# 0.362* 0.280# 0.384*
(0.147) (0.178) (0.145) (0.169)
Firm size [control = 5000 employees +]
Less than 20 employees 0.159* 0.139* 0.168* 0.154*
(0.069) (0.060) (0.069) (0.061)
20–99 employees 0.055 -0.008 0.064 0.006
(0.063) (0.066) (0.063) (0.066)
100–499 employees -0.021 -0.028 -0.017 -0.026
(0.070) (0.076) (0.071) (0.076)
500–999 employees 0.132# -0.177* 0.131# -0.164*
(0.077) (0.084) (0.078) (0.083)
1000–4999 employees -0.003 0.111# -0.006 0.108
(0.065) (0.066) (0.065) (0.066)
Firm size unknown -0.008 -0.011 0.004 0.014
(0.087) (0.072) (0.088) (0.072)
Public sector 0.054 0.070 0.051 0.069
(0.064) (0.057) (0.064) (0.057)
Union member -0.035 -0.171** -0.039 -0.178**
(0.047) (0.047) (0.047) (0.047)
Supervisor 0.106** 0.011 0.096* 0.009
(0.041) (0.041) (0.041) (0.041)
Work schedule [control = Regular day or evening]
Night shift -0.327** -0.009 -0.306** 0.002
(0.105) (0.132) (0.105) (0.134)
Rotating shift -0.022 -0.101 -0.027 -0.110
(0.073) (0.074) (0.073) (0.075)
Split shift -0.176 0.075 -0.178 0.019
(0.176) (0.175) (0.175) (0.177)
On call -0.080 -0.221 -0.078 -0.182
(0.145) (0.160) (0.143) (0.161)
Irregular schedule -0.189* 0.021 -0.186* 0.028
(0.080) (0.070) (0.080) (0.070)
Home worker 0.129 0.133# 0.128 0.161*
(0.092) (0.078) (0.092) (0.078)
Optimism 0.253** 0.184** 0.255** 0.191**
(0.034) (0.037) (0.034) (0.037)
Importance of the home 0.007 0.003 0.010 0.003
(0.012) (0.013) (0.012) (0.013)
Importance of employment 0.197** 0.152** 0.195** 0.145**
(0.016) (0.016) (0.016) (0.016)
Importance of financial situation -0.015 -0.003 -0.016 -0.002
(0.014) (0.016) (0.014) (0.016)
Importance of local community 0.032** 0.029** 0.032** 0.033**
(0.009) (0.010) (0.009) (0.010)
Importance of health -0.007 0.005 -0.006 0.006
negative coefficient on casual employment is not significant and there is no relationship at all with agency employment.
Specification I, however, assumes that the effects of employment contract status are independent of the effects of working hours. In specification II we relax this assumption and allow for the impact of employment status on job satisfaction to vary with hours worked. These results indicate that the negative associations between casual employment and job satisfaction are entirely restricted to those working 35 hours or more. Casual employees working part-time hours (less than 35 hours) are no less satisfied than permanent employees, including those working both part-time hours and standard hours (35–40 hours per week). Casual employees working full-time hours, especially men, however, report much lower levels of job satisfaction.
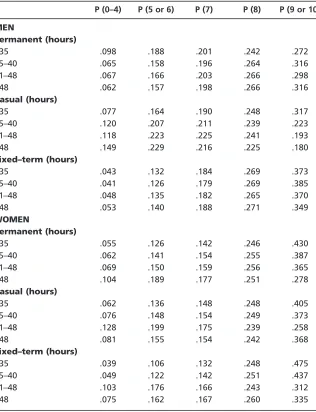
A guide to the magnitude of these effects is presented in Table 6. This table uses the results from specification II to calculate the predicted probabilities of an identical man and woman reporting different scores on the overall job satisfaction scale. The probabilities are calculated at the mean values of all other explanatory variables. Thus a male working standard hours on a permanent or ongoing basis has a 6.5 per cent probability of reporting 4 or less on the 0–10 job satisfaction scale and a 31.6 per cent chance of reporting 9 or 10. By comparison, a man working similar hours but on a casual basis has almost twice Table 5 Continued
Variable Specification I Specification II
Men Women Men Women
Importance of family 0.005 0.031 0.005 0.032
(0.018) (0.021) (0.018) (0.021)
Importance of leisure 0.029* 0.019 0.029* 0.017
(0.013) (0.014) (0.013) (0.014)
Importance of religion 0.013* 0.013* 0.014* 0.013*
(0.006) (0.006) (0.006) (0.006)
State dummies Yes Yes Yes Yes
Occupation dummies Yes** Yes Yes** Yes
Industry dummies Yes** Yes** Yes** Yes**
Log-likelihood -6178.7 -6049.4 -6176.3 -6051.5
Log-likelihood (0) -6616.3 -6435.9 -6616.3 -6435.9
Likelihood ratio test (2) 873.1** 773.1** 881.6** 805.6**
Pseudo R-squared 0.232 0.210 0.233 0.209
N 3401 3357 3401 3357
Notes:1. **, * and # indicate statistical significance at the 1, 5 and 10 per cent levels, respectively, in a two-tailed test.
2. Estimated but not reported are the 10 ancillary or threshold parameters.
the likelihood of being highly dissatisfied (i.e. reporting less than 5 on the scale) and is only 70 per cent as likely to report very high satisfaction levels (9 or 10). A similar worker on a fixed-term contract, on the other hand, has only a 4 per cent probability of being highly dissatisfied and a 38.5 per cent probability of being highly satisfied.
CONCLUSION
Non-traditional forms of employment are pervasive in Australia. According to the data used in this analysis, almost one-quarter of Australian employees 294 TH E JO U R N A L O F IN D U S T R I A L RE L AT I O N S September 2004
Table 6 Predicted probabilities of overall job satisfaction scores
P (0–4) P (5 or 6) P (7) P (8) P (9 or 10)
MEN
Permanent (hours)
<35 .098 .188 .201 .242 .272
35–40 .065 .158 .196 .264 .316
41–48 .067 .166 .203 .266 .298
>48 .062 .157 .198 .266 .316
Casual (hours)
<35 .077 .164 .190 .248 .317
35–40 .120 .207 .211 .239 .223
41–48 .118 .223 .225 .241 .193
>48 .149 .229 .216 .225 .180
Fixed–term (hours)
<35 .043 .132 .184 .269 .373
35–40 .041 .126 .179 .269 .385
41–48 .048 .135 .182 .265 .370
>48 .053 .140 .188 .271 .349
WOMEN
Permanent (hours)
<35 .055 .126 .142 .246 .430
35–40 .062 .141 .154 .255 .387
41–48 .069 .150 .159 .256 .365
>48 .104 .189 .177 .251 .278
Casual (hours)
<35 .062 .136 .148 .248 .405
35–40 .076 .148 .154 .249 .373
41–48 .128 .199 .175 .239 .258
>48 .081 .155 .154 .242 .368
Fixed–term (hours)
<35 .039 .106 .132 .248 .475
35–40 .049 .122 .142 .251 .437
41–48 .103 .176 .166 .243 .312
(leaving aside owner-managers) are employed on a casual basis and a further 9 per cent are employed on fixed-term contracts. Moreover, it is very clear that the incidence of these types of employment has increased in recent decades (though the growth in the casual employment share at least, does appear to have slowed noticeably in recent years).
Such trends are widely perceived as undesirable, especially given the greater insecurity and uncertainty that is typically presumed to be inherent in casual and other forms of non-standard employment. But does casual employment and other types of non-standard employment necessarily involve inferior types of employ-ment? In this analysis of self-reported data on job satisfaction it was found that workers do not necessarily see non-standard employment as undesirable. First, it is very clear that workers on fixed-term contracts are more satisfied with their jobs than other workers, both casual and permanent, and this finding is not affected by the inclusion of controls for personal and other job characteristics. Second, the lower levels of job satisfaction among casual employees are restricted to those working full-time and even then the size of the effect is only marked among men. This is of obvious importance given the overwhelming majority of casual jobs involve part-time hours and are held by women. Indeed, just 4 per cent of all employees (excluding owner-managers) are men working full-time hours on a casual basis in their main job.
In conclusion, the evidence presented in this analysis suggests that it is extremely misleading to characterise non-standard jobs as sub-standard jobs. It thus follows that initiatives intended to inhibit the diversity of employment options that are available to employers will often not result in changes in working arrangements that will be unambiguously preferred by employees. Furthermore, it can be expected that many workers will not convert to permanent employment status if this were offered. Indeed, the HILDA Survey data indicate that many part-time casual employees (55%) already believe they could convert to permanent part-time work if they wish, but clearly have chosen not to do so.
ENDNOTES
1. The growth in the rate of casualisation, however, has clearly slowed in recent years, with the casual employment share only one percentage point higher in 2002 compared with 1996 and virtually unchanged since 1998.
2. These data were still far from ideal for examining casual employment. First, the study excluded workplaces from the agricultural sector and workplaces with 20 or more employees, ensuring that workplaces with a relatively high incidence of casual employment were under-represented. Second, within these workplaces, casual employees were far less likely to be respondents to the employee survey, giving rise to concerns about the representativeness of the sub-sample of casual employees.
3. In general, all households within a dwelling were included in the sample. However, where there were four or more households occupying one dwelling, all households had to be enumerated and a random sample of three households obtained (based on a predetermined pattern). 4. Of this group, 13 159 (94%) returned the self-completion questionnaire.
5. The exact wording of the question was as follows: ‘Looking at showcard E25, which of these categories bestdescribes your current contract of employment?’ Four response options were then provided; the three listed here together with an ‘other’ category to catch arrangements which were more difficult to classify (e.g. persons working on probation or on a commission basis).
‘I now have some questions about how satisfied or dissatisfied you are with different aspects of your job. I am going to read out a list of different aspects of your job and, using the scale on showcard E36, I want you to pick a number between 0 and 10 to indicate how satisfied or dissatisfied you are with the following aspects of your job. The more satisfied you are, the higher the number you should pick. The less satisfied you are, the lower the number.’ Each of the six domains were then read out. The question sequence then concluded with: ‘All things considered, how satisfied are you with your job?’ Responses to the latter provide the measure of overall job satisfaction used here.
7. For the record, the inter-item correlations between overall job satisfaction and the five domain-specific measures are relatively modest, ranging from just 0.38 for job security up to 0.67 for the work itself. The correlation between the overall job satisfaction measure and an additive scale that combines all five domain measures, however, is much larger: 0.73.
8. For those who are interested in the details of the items that underlie these variables, all questionnaires used in the HILDA Survey can be downloaded from the HILDA Survey website (at www.melbourneinstitute.com/hilda/sinstruments.html). There is also a code book (Freidin et al.2002) that can be downloaded from this site.
9. While highly subjective, research has found this variable to be a very good predictor of mortality (e.g., McCallum et al.1994).
REFERENCES
Allan, C (1998) Stabilising the non-standard workforce: Managing labour utilisation in private hospitals. Labour and Industry8(3), 61–76.
Australian Bureau of Statistics [ABS] (2001) ABS Views on Remoteness: Information Paper. ABS cat. No. 1244.0. Canberra: ABS.
Baker M, Wooden M (1992) Training in the Australian labour market: Evidence from the How Workers Get Their Training Survey. Australian Bulletin of Labour18(1), 25–45.
Booth A, Francesconi M, Frank J (2002) Temporary jobs: Stepping stones or dead ends? The Economic Journal112(480), F189–F213.
Borjas GJ (1979) Job satisfaction, wages and unions. Journal of Human Resources14(1), 21–40. Brooks A (1985) Aspects of casual and part-time employment. The Journal of Industrial Relations
27(2), 158–171.
Burgess J (1996) Workforce casualisation in Australia. International Employment Relations Review
2(1), 33–53.
Campbell I (1996a) Casual employment, labour regulation and Australian trade unions. The Journal of Industrial Relations38(4), 571–599.
Campbell I (1996b) The growth of casual employment in Australia: Towards an explanation. In: Teicher, J, ed., Non-standard Employment in Australia and New Zealand, pp. 43–107. NKCIR Monograph no. 9. Melbourne: National Key Centre in Industrial Relations, Monash University.
Campbell I, Burgess J (2001) A new estimate of casual employment? Australian Bulletin of Labour
27(2), 85–108.
Clark AE (1996) Job satisfaction in Britain. British Journal of Industrial Relations34(2), 189–217. Clark AE (1997) Job satisfaction and gender: Why are women so happy at work? Labour Economics
4(4), 341–372.
Clark AE, Oswald, A and Warr, PB (1996) Is job satisfaction u-shaped in age? Journal of Occupational and Organizational Psychology 69(1), 57–81.
Considine G, Callus R (2002) The Quality of Work Life of Australian Employees – The Development of an Index. ACIRRT Working Paper 73. Sydney: Australian Centre for Industrial Relations Research and Training, University of Sydney.
Dawkins P, Norris K (1999) Casual employment in Australia. Australian Bulletin of Labour16(2), 156–173.
Diener E, Suh EM, Lucas RE, Smith HL (1999) Subjective well-being: Three decades of progress.
Psychological Bulletin125(2), 276–302.
Folkard S, Monk TH (eds) (1985) Hours of Work: Temporal Factors in Work-Scheduling. Chichester: John Wiley & Sons.
Freeman RB (1980) The exit-voice tradeoff in the labour market: Unionism, job tenure, quits and separations. Quarterly Journal of Economics94(2), 643–674.
Freidin S, Watson N, Wooden M (2002) HILDA Survey Coding Framework: Confidentialised Data.
HILDA Project Technical Paper Series no. 2/02. Melbourne: Melbourne Institute of Applied Economic and Social Research, University of Melbourne.
Hall R, Harley B (2000) The location and characteristics of fixed-term and casual female workers in Australia: Analysis of AWIRS95. Australian Bulletin of Labour26(1), 18–37.
Hall R, Harley B, Whitehouse G (1998) Contingent work and gender in Australia: Evidence from the 1995 Australian Workplace Industrial Relations Survey. Economic and Labour Relations Review
9(1), 55–81.
Junor A (1998) Permanent part-time work: New family-friendly standard or high intensity cheap skills?Labour and Industry8(3), 77–95.
Lewis H (1990) Part-time Work: Trends and Issues. Canberra: Australian Government Publishing Service.
McCallum J, Shadbolt B, Wang D (1994) Self-rated health and survival: A 7-year follow-up study of Australian elderly. American Journal of Public Health84(7), 1100–1105.
Miller PW (1994) Gender discrimination in training: An Australian perspective. British Journal of Industrial Relations32(4), 539–564.
Murtough G, Waite M (2000) The Growth of Non-traditional Employment: Are Jobs Becoming More Precarious? Productivity Commission Staff Research Paper. Canberra: AusInfo.
Organisation for Economic Cooperation and Development [OECD] (2002) Taking the measure of temporary employment. In: OECD, Employment Outlook, July 2002, pp. 127–185. Paris: OECD.
Owens R (2001) The ‘long-term or permanent casual’ – an oxymoron or a ‘well enough under-stood Australianism’ in the law? Australian Bulletin of Labour27(2), 118–136.
Probert B (1995) Part-time Work and Managerial Strategy: Flexibility in the New Industrial Relations Framework. Canberra: Australian Government Publishing Service.
Romeyn J (1992) Flexible Working Time: Part-time and Casual Employment. Industrial Relations Research Monograph no. 1. Canberra: Department of Industrial Relations.
Smith M, Ewer P (1999) Choice and Coercion: Women’s Experiences of Casual Work. Sydney: Evatt Foundation.
VandenHeuvel A, Wooden M (2000) Diversity in employment arrangements. In: Mangan J ed.
Understanding and Reducing Unemployment: National and State Perspectives, pp. 69–83. Brisbane: Office of Economic and Statistical Research, Queensland Treasury.
Walsh J, Deery S (1997) Understanding the Peripheral Workforce: An Examination of Employee Diversity in the Service Sector. Department of Management and Industrial Relations Working Paper no. 112. Melbourne: University of Melbourne.
Waite M, Will L (2002) Fixed-term Employees in Australia: Incidence and Characteristics. Productivity Commission Staff Research Paper. Canberra: AusInfo.
Watson I, Buchanan J, Campbell I, Briggs C (2003) Fragmented Futures: New Challenges in Working Life. Sydney: The Federation Press.
Watson N, Wooden M (2002) The Household, Income and Labour Dynamics in Australia (HILDA) Survey: Wave 1 Survey Methodology. HILDA Project Technical Paper Series no. 1/02. Melbourne: Melbourne Institute of Applied Economic and Social Research, University of Melbourne.
Weller S, Cussen J, Webber M (1999) Casual employment and employer strategy. Labour and Industry10(1), 15–34.
Whitehouse G, Boreham P, Lafferty G (1997) From casual to permanent part-time? Non-standard employment in retail and hospitality. Labour and Industry8(2), 33–48.
Wooden M (1996) The Training Experiences of Part-time and Casual Youth Workers: Evidence from the 1993 Survey of Training and Education.National Institute of Labour Studies Working Paper Series no. 138. Adelaide: Flinders University.
Wooden M (2001a) Are non-standard jobs sub-standard jobs? Australian Social Monitor3(3), 65–70. Wooden M (2001b) How temporary are Australia’s casual jobs? Work, Employment and Society 16(4),
875–883.
Wooden M, Freidin S, Watson N (2002) The Household, Income and Labour Dynamics in Australia (HILDA) Survey: Wave 1. Australian Economic Review35(3), 339–348.