13th Universiti Malaysia Terengganu International Annual Symposium on Sustainability Science and Management (UMTAS 2016)
© 2016 All right reserved. No part of this publication may be reproduced or transmitted in any form or by any means, electronic or mechanical including photocopy, recording or any information storage and retrieval system, without permission in writing from Ketua Penerbit UMT, Universiti Malaysia Terengganu, 21030 Kuala Terengganu, Terengganu, Malaysia.
Hak Cipta Terpelihara © 2016. Tidak dibenarkan mengeluar ulang mana-mana bahagian artikel, ilustrasi dan isi kandungan buku ini dalam apa juga bentuk dan dengan apa cara sekalipun sama ada secara elektronik, fotokopi, mekanik, rakaman, atau cara lain sebelum mendapat izin bertulis daripada Ketua Penerbit UMT, Universiti Malaysia Terengganu, 21030 Kuala Terengganu, Terengganu, Malaysia.
Published in Malaysia by/ Diterbitkan oleh Penerbit UMT
Universiti Malaysia Terengganu (UMT) 21030 Kuala Terengganu,
Terengganu.
http://www.umt.edu.my/penerbitumt E-mail: [email protected]
Perpustakaan Negara Malaysia Cataloguing-in-Publication Data
13th Universiti Malaysia Terengganu International Annual Symposium on Sustainability Science and Management (2016: Kuala Terengganu)
13th Universiti Malaysia Terengganu International Annual Symposium on Sustainability Science and Management: Science and Technology for Sustainable Livelihood: 13 – 15 December 2016, Primula Beach Hotel/ organized by: Kenyir Research Institute.
64
Rosman Iteng, Hj. Mohd Akhir Hj. Ahmad, Mohd Kamarul Irwan Abdul Rahim
Jessica Ong Hai Liaw, Ahmad Azan Ridzuan, Haslinda Abdullah, Noor Azmi Mohd Zainol, Wong Wai Loong
Mohd Norhasni Mohd Asaad, Rohaizah Saad, Mohd Akhir Hj Ahmad
DO ISO 900X SERIES REALLY MAKE A DIFFERENCE IN FINANCIAL PERFORMANCE? A Case Study of
Manufacturing Companies Listed in the Indonesia Stock Exchange
THE IMPACT OF FOOD AVAILABILITY ON FOOD SECURITY IN DEVELOPING COUNTRIES HYDROLYSATE FROM WASTE OF SHORTFIN SCAD (Decapterus macrosoma) macrosoma) SKIN USING ALCALASETM EXTRACTION
HI Rasli, NM Sarbon
UMTAS
UMTAS 2016-317
DO ISO 900X SERIES REALLY MAKE A DIFFERENCE IN FINANCIAL
PERFORMANCE?
A CASE STUDY OF MANUFACTURING COMPANIES
LISTED IN THE INDONESIA STOCK EXCHANGE
DWI KARTIKASARI*, ADI IRAWAN
Department of Business and Management, Politeknik Negeri Batam, INDONESIA
*Corresponding author: [email protected]
Abstract: The purpose of this research is to compare the financial performance of manufacturing companies with ISO 900X series and those without, and to state whether the difference between them is significant. Out of 145 manufacturing companies listed in the Indonesia Stock Exchange in 2014, 116 of them are ISO 900X series certified. Because of data availability constraints, the author processes only 120 companies where 95 of them are ISO 900X series certified and 25 companies are not certified. Data are obtained from the financial statements of 120 companies that are considered complete, while the ISO certification status data are obtained from the company's website and other information available on the internet. The author uses a comprehensive set of financial performance indicators consisting of 12 ratios including the current ratios and quick ratios representing the liquidity ratios; receivable turnover, inventory turnover and the turnover ratio of total assets representing the activity ratios; total debt to equity ratio and total debt to total assets representing the liability ratios; net profit margin, return to total assets and return on equity representing the profitability ratios, and price to earnings ratios and dividend yield ratios representing the market ratios. The author found that the data were not normally distributed, thus she uses Mann-Whitney Test to support her conclusions that the difference between companies with and without ISO 900X series is not statistically significant.
Keywords: ISO 900X series, financial, performance, comparison, difference
Introduction
The current business competition is very keen, both nationally and internationally. Companies have been trying to win the competition in various ways including improving the quality of products and or services. They aim to retain existing customers and lure new customers by offering quality products and or services. A quality management system is implemented in order to reduce the number of defective products and thus reduce production costs. In the end, the companies that implement quality management system hope to increase their profits and improve their competitiveness.
system of a company meets the standards of ISO. The ISO certificate does not guarantee a process or a product at maximum quality level to customers, but merely gives confidence to customers that the company is consistent with its quality procedures (Brown and Wiele, 1996). Many companies strive to obtain the ISO certificate in order to improve their efficiency in producing quality products and or services, reduce their production costs and make their selling prices more competitive, increase their market shares, and increase their stock prices. The fact that some major purchasers including government agencies require their suppliers to hold ISO 900X series drives the national adoption of ISO 900X series in Indonesia.
Researches on quality management system in the form of market-based researches as well as fundamental-based researches have been carried out. LRQA (Lloyd's Register Quality Assurance) in Wibawa (2002) through descriptive surveys showed that companies with ISO 900X series certificates outperformed the industry average. He also concluded that the market reacted positively to the announcement of the certification of ISO 900X series during the period before the crisis, but the market reacted negatively to the announcement of ISO 900X series during the period of monetary crisis in Indonesia. Further research carried out by Wibawa (2005) claimed that there were differences in quality management practices between ISO 900X certified companies with those that were not certified, but for two other variables, namely business strategy and performance reporting standards, the differences were not significant.
Investors might think that a company is more interested in obtaining a certification rather than improving the quality itself, or they might estimate that in the long term a company cannot cope with the additional costs to renew certification despite its saving on production costs and its increase in sales. If any of these hypotheses happens, then it is likely that an ISO certified company has a worse stock performance than it had before it obtained the ISO certificate. Therefore, to assess the effectiveness of the ISO certificate, the author uses a comprehensive set of financial performance ratios derived from the company's financial statements. In this article, the current ratios and quick ratios are used to represent the liquidity ratios; receivable turnover, inventory turnover and the turnover ratio of total assets are to represent the activity ratios; total debt to equity ratio and total debt to total assets are to represent the liability ratios; net profit margin, return to total assets and return on equity are to represent the profitability ratios, and price to earning ratios and dividend yield ratios are to represent the market ratios. The author hope that a more updated data and a more extensive financial ratios used in this article might make this article contribute more to academic literature in this field.
Literature Review
Financial Performance
The company's goal of standardizing quality using ISO 900x certifications is to improve customer satisfaction, thus improving the profitability and performance of the company. By analyzing the financial ratios related to the financial performance, the company can determine whether the goal is reached or not. Hence, these ratios reflect the benefit obtained by the company after certification. The financial indicators used in previous studies related to ISO 900x implementation as follow:
1. Return on Assets (ROA) used by Setijawan (2012)
2. Return on Assets (ROA), Return on Sales (ROS), Costs of Goods Sold (COGS), sales ratio, sales growth, and total asset turnover (TATO) used by Corbett, Sancho, and Kirsch (2004).
4. ROS, Economic value added (EVA), and free cash flow (FCF) used by Naser, et. al (2004) in Malaysia.
In fact, a very large number of ratios are used for the purpose of determining the financial position of a concern for different purposes (Periasamy, 2010). There are five types of financial ratios that are often used (Hanafi, 2008):
a) Liquidity ratios: the ratios that measure the ability of the company to meet short-term obligations.
b) Activity ratios: the ratios that measure a company's ability to use its assets efficiently. c) Liability ratios: the ratios that measure the ability of the company to meet the total
obligation.
d) Profitability ratios: the ratios that measure a company's ability to produce profit.
e) Market ratios: the ratios that measure the market performance relative to book value, earnings and dividend.
As far as the author search, she does not find any paper covers all types of financial ratios. Thus, in this study, she uses all of them consiting of 12 ratios as follow:
1. Current ratios (CR) and quick ratios (QR) representing the liquidity ratios;
2. Receivable turnover (RTO), inventory turnover (ITO) and the turnover ratio of total assets (TATO) representing the activity ratios;
3. Total debt to equity ratio (TDER) and total debt to total assets ratio (TDAR) representing the liability ratios;
4. Net profit margin (NPM), return to total assets (ROA) and return on equity (ROE) representing the profitability ratios; and
5. Price to earning ratios (PER) and dividend yield (DY) ratios representing the market ratios.
ISO 900x Series
ISO 900x series is issued by the International Organization for Standardization (ISO) based in Geneva, Switzerland. ISO 9000 standards become mandatory for many manufacturers to be able to compete in international markets, by demonstrating the consistency of product quality. Indonesia has became one of the countries that adopt ISO 9000 fully making Indonesian National Standard (SNI 19-9000), to boost the Indonesian manufacturing companies to produce in ways that are better, effective, and productive. ISO 900x series and ISO 1400x series is the most recognized ISO standards. ISO 9000 standards mainly describe the fundamentals, principles and terminology of quality management system. While ISO 9001 shows the
company’s ability to provide products that meet consumers’ demand and its compliance with
the rules.
Methodology
within a company to have measurable goals and to contribute in advancing the company, including the company's financial performance, thus the hypotheses are:
Ho: there is no difference in financial performance between companies with ISO series certificates and those without.
Ha: there is significant difference in financial performance between companies with ISO series certificates and those without.
The author implements quantitative comparative analysis with statistical software to compare the conditions and means of two sample groups. Two independent groups in this article are ISO certified companies and non-ISO certified companies. T-test is normally used when data are interval or ratio and data are normal distribution. Table 1 below shows the significance or p-value of tests of normality. Group 1 represents companies with ISO series certificates, while group 2 represents companies without ISO series certificates. Because there are more than 50 samples in group 1, or 95 data to be exact, the author uses Kolmogorov-Smirnov (Lilliefors Significance Correction). While she uses Shapiro-Wilk for group 2, because the number of samples in group 2 is less than 50. The author uses 50 cases as the cutting point (Shapiro & Wilk, 1965; Shapiro, Wilk, and Chen, 1968).
Table 1: Tests of Normality
Ratios CR QR TATO ITO RTO TDER TDAR NPM ROA ROE PER DY
Group 1 .000 .000 .000 .000 .000 .000 .000 .000 .000 .000 .000 .000 2 .000 .000 .591* .000 .006 .000 .000 .127* .001 .000 .000 .000
Note: * Normal distribution at 5% significance level. CR = Current Ratio, QR = Quick Ratio, TATO = Total Assets Turn Over, ITO = Inventory Turn Over, RTO = Receivable Turn Over, TDER = Total Debt to Equity Ratio, TDAR = Total Debt to Assets Ratio, NPM = Net Profit Margin, ROA = Return on Assets, ROE = Return on Equity, PER = Price Earning Ratio, and DY = Dividend Yield.
Table 1 shows that almost all groups do not come from a normal distribution because their p-values or significance are less than 0.05. Only 2 groups that come from Group 2 of TATO and NPM that have normal distribution data. But still, because of the comparison group of Group 1 do not come from a normal distribution, thus normality issues persist. Hence, the author uses Mann-Whitney test to determine whether there are significant differences between the two groups. Mann-Whitney test is categorized as nonparametric test which is beneficial when the sample size is small, that is why nonparametric methods are used extensively to analyze data in the field of social sciences (Supranto, 2002). The Mann-Whitney test is also called U-test, while the procedure to implement Mann-Whitney test are (Supranto, 2002):
1. State the hypotheses and the significance level of α;
2. Rank the data regardless of sample category; 3. Calculate statistical value of u, with the formula
u = n1 x n2 + [n1 (n1 + 1) / 2] - r1, or u = n1 x n2 + [n2 (n2 + 1) / 2] - r2; and
4. Determine to accept or reject the null hypothesis when calculated u is higher or lower than value of u obtained from table.
Table 2 and table 3 are presented below to know the characteristics of financial performance of companies with ISO and those without ISO.
Table 2: Descriptive Statistics for Companies with ISO
Item CR QR TATO ITO RTO TDER TDAR NPM ROA ROE PER DY
Mean 7.14 5.45 1.08 5.91 1.04 0.85 0.53 0.06 0.05 0.13 19.44 0.07
Standard Error 4.88 3.91 0.07 0.78 0.02 0.22 0.04 0.03 0.01 0.03 10.18 0.05
Median 1.61 0.95 0.96 4.54 1.04 0.79 0.48 0.03 0.02 0.07 11.55 -
Mode #N/A #N/A #N/A #N/A #N/A #N/A #N/A #N/A #N/A #N/A - -
Standard Deviation 47.52 38.14 0.66 7.58 0.21 2.17 0.42 0.29 0.14 0.31 99.18 0.50
Sample Variance 2.257.91 1.454.52 0.44 57.46 0.04 4.70 0.17 0.09 0.02 0.09 9.837.41 0.25
Kurtosis 94.63 94.58 12.95 53.28 6.46 9.51 14.14 73.79 32.60 11.35 79.05 89.01
Skewness 9.72 9.72 2.72 6.59 1.24 (1.69) 3.17 8.00 4.63 3.06 8.47 9.32
Range 464.71 372.74 5.00 73.16 1.59 16.28 2.82 3.21 1.34 2.10 1.062.83 4.80
Minimum 0.28 0.13 0.03 (3.79) 0.39 (8.59) 0.04 (0.50) (0.22) (0.47) (128.62) -
Maximum 464.98 372.87 5.02 69.37 1.98 7.69 2.86 2.70 1.12 1.63 934.21 4.80
Sum 678.75 517.43 102.72 561.84 98.57 81.03 50.10 5.29 4.89 12.09 1.846.49 7.03
Count 95 95 95 95 95 95 95 95 95 95 95 95
Note: CR = Current Ratio, QR = Quick Ratio, TATO = Total Assets Turn Over, ITO = Inventory Turn Over, RTO = Receivable Turn Over, TDER = Total Debt to Equity Ratio, TDAR = Total Debt to Assets Ratio, NPM = Net Profit Margin, ROA = Return on Assets, ROE = Return on Equity, PER = Price Earning Ratio, and DY = Dividend Yield.
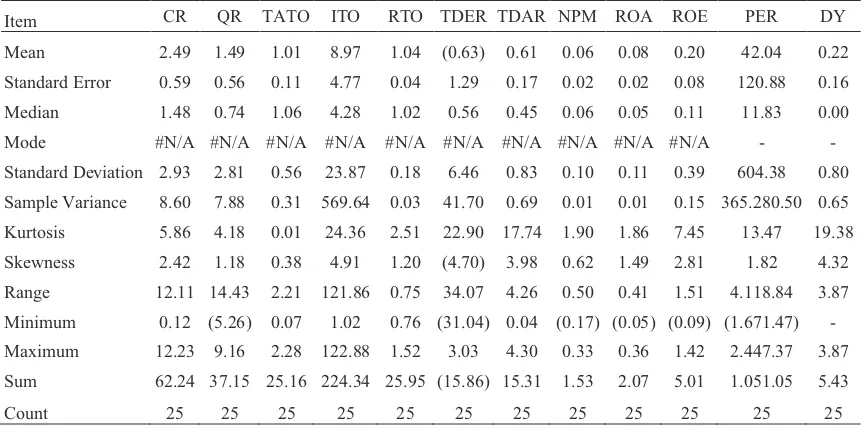
Table 3: Descriptive Statistics for Companies without ISO
Item CR QR TATO ITO RTO TDER TDAR NPM ROA ROE PER DY
Mean 2.49 1.49 1.01 8.97 1.04 (0.63) 0.61 0.06 0.08 0.20 42.04 0.22
Standard Error 0.59 0.56 0.11 4.77 0.04 1.29 0.17 0.02 0.02 0.08 120.88 0.16
Median 1.48 0.74 1.06 4.28 1.02 0.56 0.45 0.06 0.05 0.11 11.83 0.00
Mode #N/A #N/A #N/A #N/A #N/A #N/A #N/A #N/A #N/A #N/A - -
Standard Deviation 2.93 2.81 0.56 23.87 0.18 6.46 0.83 0.10 0.11 0.39 604.38 0.80
Sample Variance 8.60 7.88 0.31 569.64 0.03 41.70 0.69 0.01 0.01 0.15 365.280.50 0.65
Kurtosis 5.86 4.18 0.01 24.36 2.51 22.90 17.74 1.90 1.86 7.45 13.47 19.38
Skewness 2.42 1.18 0.38 4.91 1.20 (4.70) 3.98 0.62 1.49 2.81 1.82 4.32
Range 12.11 14.43 2.21 121.86 0.75 34.07 4.26 0.50 0.41 1.51 4.118.84 3.87
Minimum 0.12 (5.26) 0.07 1.02 0.76 (31.04) 0.04 (0.17) (0.05) (0.09) (1.671.47) -
Maximum 12.23 9.16 2.28 122.88 1.52 3.03 4.30 0.33 0.36 1.42 2.447.37 3.87
Sum 62.24 37.15 25.16 224.34 25.95 (15.86) 15.31 1.53 2.07 5.01 1.051.05 5.43
Count 25 25 25 25 25 25 25 25 25 25 25 25
of companies without ISO at 0.06 (or 0.06125 to be precise). Similarly, the average receivable turn over (RTO) of companies with ISO is 1.04 (or 1.03756 to be exact), very close to that of companies without ISO at 1.04 (or 1.03797 to be precise). To determine whether the differences in financial ratios between companies with ISO and those without ISO are significant, the author bases the final say on the Mann-Whitney test results as follow:
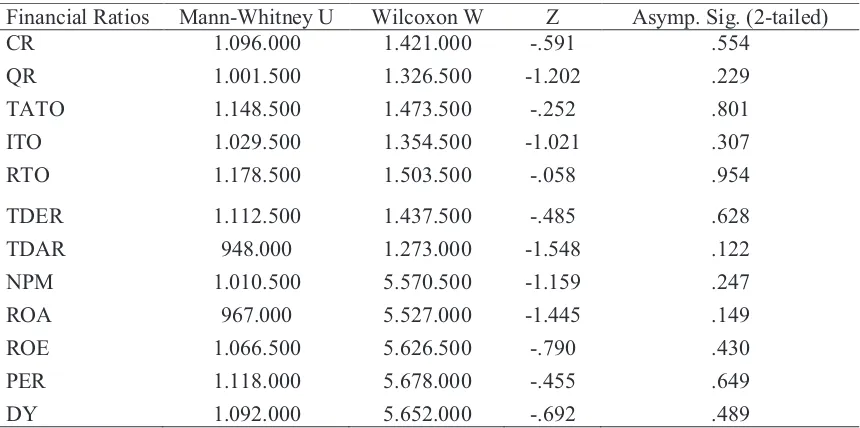
Table 4: Mann-Whitney Test Results
Financial Ratios Mann-Whitney U Wilcoxon W Z Asymp. Sig. (2-tailed)
CR 1.096.000 1.421.000 -.591 .554
QR 1.001.500 1.326.500 -1.202 .229
TATO 1.148.500 1.473.500 -.252 .801
ITO 1.029.500 1.354.500 -1.021 .307
RTO 1.178.500 1.503.500 -.058 .954
TDER 1.112.500 1.437.500 -.485 .628
TDAR 948.000 1.273.000 -1.548 .122
NPM 1.010.500 5.570.500 -1.159 .247
ROA 967.000 5.527.000 -1.445 .149
ROE 1.066.500 5.626.500 -.790 .430
PER 1.118.000 5.678.000 -.455 .649
DY 1.092.000 5.652.000 -.692 .489
Note: CR = Current Ratio, QR = Quick Ratio, TATO = Total Assets Turn Over, ITO = Inventory Turn Over, RTO = Receivable Turn Over, TDER = Total Debt to Equity Ratio, TDAR = Total Debt to Assets Ratio, NPM = Net Profit Margin, ROA = Return on Assets, ROE = Return on Equity, PER = Price Earning Ratio, and DY = Dividend Yield.
Table 4 shows that none of financial ratios have the Sig. (2-tailed) value less than 0.05, thus Ho is accepted. It means that financial ratios of companies with ISO 900x series and those without are not significantly different meaning that ISO 900x series does not make a difference in financial performance of manufacturing companies listed in the Indonesia Stock Exchange. The result of this research lends support to the finding of Setijawan (2012) who claims that the association between ISO 9000 and financial performance especially ROA is not statistically significant. The result of this research is also consistent with that of Sari (2009) who states that the difference of ROE between companies with ISO and those without ISO is not significant, but she also notes that the difference of TDER and ROA between companies with ISO and those without ISO is statistically significant. The difference between this study and that of Sari (2009). In other country like Malaysia, the finding in this research contradicts that of Naser, et. al (2004) who finds that accredited Malaysian companies outperforms the non-accredited ones, although they use completely different financial ratios than the author uses namely return on sales, EVA, and free cash flow. In India, Gupta (2000) argues that statistically significant differences do exist between ISO and non-ISO organizations under all the four categories specifically in training, using quality in the strategic planning, product design and team building alhough his research excludes financial performance.
The author finds that the difference of all financial ratios between companies with ISO 900x series and companies without ISO 900x series are not statistically significant. This could mean that ISO 900x series does not make a difference in the financial performance of public manufacturing companies in Indonesia. Further research is needed to determine the direct effect ISO 900x series with larger set of sample in the same or different industry with longer and latest observation period.
References
Brown, A., and Wiele, T. V. D. (1996). A Typology of Approach to ISO Certification and TQM. Australian Journal of Management. 21 (1): 60-65.
Corbett, C.J., Sancho, M.J.M, and Kirsch, D.A. (2005). The Financial Impact of ISO 9000 Certification in the United State: An Emperical Analysis. Management Science. 51 (7) : 1046-1059.
Gupta, A. (2000). Quality Management Practices of ISO vs non-ISO Companies: a Case of Indian industry. Industrial Management & Data Systems. 100 (9) : 451 – 455.
Hanafi, M. (2008). Manajemen Keuangan. Yogyakarta: BPFE.
Naser, K., Karbhari, Y., and Mokhtar, M. Z. (2004). Impact of ISO 9000 Registration on Company Performance. Managerial Auditing Journal. 19 (4): 509 – 516.
Periasamy, P. (2010). A Textbook of Financial Cost and Management Accounting. Mumbai: Himalaya Publishing House.
Sari, A. R. (2009). Analisis Kinerja Keuangan dan Kinerja Saham Perusahaan Bersertifikat ISO. Skripsi. Surakarta: Universitas Sebelas Maret.
Setijawan, I. (2012). ISO 9000 Cercification and the Firm Financial Performances. Fokus Ekonomi. 7 (2) : 29 – 44.
Shapiro, S. S., and Wilk, M. B. (1965). An analysis of variance test for normality (complete samples). Biometrika. 52 (3/4): 591–611.
Shapiro, S. S., Wilk, M. B., and Chen, H. J. (1968). A comparative study of various tests for normality. Journal of the American Statistical Association. 63 (324): 1343–1372. Supranto, J. ( 2002 ). Statistik Teori dan Aplikasi. Jakarta: Erlangga.
Wibawa, A. (2002). Reaksi Pasar Terhadap Pengumuman Sertifikasi ISO 9000. Jurnal Akuntansi & Bisnis. 2 (2) : 141-157.
Wibawa, A. (2005). Analisis Praktik Manajemen Kualitas, Strategi Bisnis dan Pelaporan Kinerja Pada Perusahaan Bersertifikat ISO 9000 dan perusahaan Non-ISO 9000.