The impact of total productive maintenance practices on
manufacturing performance
Kathleen E. McKone
a,∗, Roger G. Schroeder
b, Kristy O. Cua
baBabson College, Babson Park, MA 02457, USA
bDepartment of Operations and Management Science, Carlson School of Management,
University of Minnesota, 321 19th Avenue South, Minneapolis, MN 55455, USA
Received 2 March 1999; accepted 26 October 1999
Abstract
In this paper we investigate the relationship between Total Productive Maintenance (TPM) and manufacturing performance (MP) through Structural Equation Modeling (SEM). We find that TPM has a positive and significant relationship with low cost (as measured by higher inventory turns), high levels of quality (as measured by higher levels of conformance to specifications), and strong delivery performance (as measured by higher percentage of on-time deliveries and by faster speeds of delivery). We also find that the relationship between TPM and MP can be explained by both direct and indirect relationships. In particular, there is a significant and positive indirect relationship between TPM and MP through Just-In-Time (JIT) practices. © 2001 Elsevier Science B.V. All rights reserved.
Keywords:Maintenance and reliability; Empirical research; Statistical analysis
1. Introduction
The purpose of this paper is to present an empiri-cal analysis of Total Productive Maintenance (TPM). While Just-In-Time (JIT), Total Quality Management (TQM) and Employee Involvement (EI) have been recognized as strong contributors to manufacturing performance (MP) both in the practitioner literature (Schonberger, 1986, Miller and Schenk, 1997) and the academic literature (Cleveland et al., 1989; Flynn et al., 1995; Jarrell and Easton, 1997; Sakakibara et al., 1997), there has been limited recognition (Maier et al., 1998) of the role that maintenance plays in improving
∗Corresponding author. Tel.:+1-781-239-4245;
fax:+1-781-239-5272.
E-mail address:[email protected] (K.E. McKone).
MP. However, TPM can be thought of as integral to a World Class Manufacturing Strategy that also involves JIT, TQM, and EI. In particular, Schon-berger (1986) argues that JIT, TQM, EI, and TPM are critical components of World Class Manufactur-ing. Therefore, it is hypothesized that companies that implement TPM will not only be able to enhance their maintenance practices but also improve their MP.
This paper focuses on the relationship between TPM and MP. We propose a conceptual framework to ex-amine the nature of this relationship. Since TPM, JIT, and TQM are critical to a world class manufacturing strategy, we believe that it is necessary to consider JIT and TQM when assessing TPM. Therefore, our frame-work considers both direct and indirect relationships (through JIT and TQM) between TPM and MP. After 0272-6963/01/$ – see front matter © 2001 Elsevier Science B.V. All rights reserved.
proposing our framework, we then test it using survey data collected from 117 plants across three industries and four countries.
The remainder of this paper is organized as follows. In Section 2 of the paper, we define our model and our hypotheses. In Section 3, we describe our data. In Sec-tion 4, we discuss the measurement of our model vari-ables. In Section 5, we present our analysis approach. Then, in Section 6, we present and discuss the results from our study. Finally, we present our conclusions.
2. Framework definition
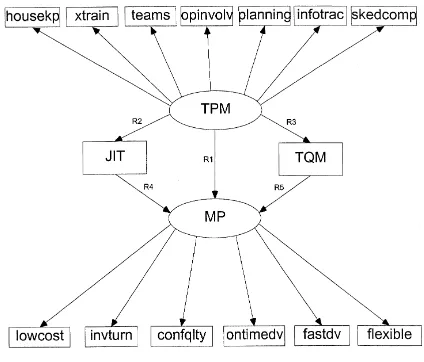
In this section, we define the components of our framework (shown in Fig. 1) relating TPM and MP. After discussing the components of the framework, we present the theory that supports this framework and discuss the hypothesized relationships that will be analyzed in this paper.
2.1. TPM elements
Seiichi Nakajima, vice-chairman of the Japanese In-stitute of Plant Engineers (JIPE), the predecessor of the Japan Institute of Plant Maintenance (JIPM), pro-moted TPM throughout Japan and has become known as the father of TPM. In 1971, TPM was defined by JIPE as follows:
Fig. 1. Framework.
TPM is designed to maximize equipment effec-tiveness (improving overall efficiency) by estab-lishing a comprehensive productive-maintenance system covering the entire life of the equipment, spanning all equipment-related fields (planning, use, maintenance, etc.) and, with the partici-pation of all employees from top management down to shop-floor workers, to promote produc-tive maintenance through motivation management or voluntary small-group activities. (Tsuchiya, 1992, p. 4)
TPM provides a comprehensive company-wide ap-proach to maintenance management, which can be divided into long-term and short-term elements. In the long-term, efforts focus on new equipment design and elimination of sources of lost equipment time and typically require the involvement of many areas of the organization. In this paper, we focus on the short-term maintenance efforts that are normally found at the plant level of the organization. In the short-term, TPM activities include an autonomous mainte-nance program for the production department and a planned maintenance program for the maintenance department.
Throughout this paper, we measure TPM as in McKone et al. (1999). We consider seven elements of TPM in the paper: four elements of autonomous maintenance — housekeeping on the production line, cross-training of operators to perform main-tenance tasks, teams of production and mainte-nance personnel, and operator involvement in the maintenance delivery system; and three elements of planned maintenance — disciplined planning of maintenance tasks, information tracking of equip-ment and process condition and plans, andschedule
complianceto the maintenance plan. These seven
el-ements will be discussed in more detail in Section 4, when we discuss the measurement of our framework variables.
2.2. MP dimensions
and Roth, 1994). We consider the four basic dimen-sions because the plant is most concerned with these measures. In our study, we have two components of cost–cost as a percentage of sales and inventory turns, two components of delivery–percentage of on-time de-liveries and speed of delivery, and one component each for quality and flexibility.
Use of the four basic dimensions to measure MP can be traced back to Skinner (1969) who launched the current interest in manufacturing strategy and MP measurement with his now classic article. Skin-ner has been followed by many others who have also advocated the four basic dimensions, includ-ing Schroeder (1993) and Ward et al. (1995). These authors have sometimes referred to the four di-mensions as competitive priorities or manufactur-ing capabilities, but we refer to them here as MP dimensions.
2.3. JIT and TQM elements
In this paper, we consider comprehensive measures of the level of JIT and TQM implementation. We capture multiple aspects of JIT development: ven-dor relations, customer relations, and several aspects of JIT production — the management of materials, scheduling of resources where and when needed, and setup reduction (Sakakibara et al., 1993, 1997). We also consider several aspects of TQM development: supplier management, customer involvement, the in-ternal system for quality, and top management lead-ership for quality (Flynn et al., 1994, 1996). These are indicators of the level of implementation of JIT and TQM.
2.4. Hypotheses
2.4.1. TPM positively influences MP
We first hypothesize that TPM implementation has a positive influence on MP. This hypothesis is based on the experiences of numerous companies as well as the theory discussed in the technology and strategy literature.
The benefits from implementing TPM have been well documented at numerous plants. Constance Dyer, Director of Research and TPM Product Development, Productivity Inc., says that companies that adopt TPM
are seeing 50% reductions in breakdown labor rates, 70% reductions in lost production, 50–90% reductions in setups, 25–40% increases in capacity, 50% increases in labor productivity, and 60% reductions in costs per maintenance unit (Koelsch, 1993). Many companies, such as Steelcase (Koelsch, 1993), Tennessee East-man (Garwood, 1990), Nissan (Suzuki, 1992), Nip-pondenso (Teresko, 1992), and Michigan Automotive Compressor (MACI, 1995) have told similar success stories. All claim that TPM had a significant impact on their maintenance effectiveness and their MP.
The academic literature also supports the idea that TPM, which enhances the technology base of the plant, can lead to improved MP. Adler and Shenhar (1990) indicate that companies that develop their tech-nological base are able to capitalize on technology’s ability to make a positive contribution to perfor-mance. TPM can improve the technological base of a company by enhancing equipment technology and improving the skill of employees (improving two of Adler and Shenhar’s dimensions of technology — the technology and organizational assets). Therefore, by improving the technology of the plant, TPM should help improve MP.
Our first hypothesis considers the relationship R1 in Fig. 1 and is referred to as
H1. TPM has a positive and direct relationship with
MP.
2.4.2. TPM indirectly affects MP through JIT and TQM
JIT, TQM, EI, and TPM programs have often been referred to as components of “World-Class Manufacturing” (Schonberger, 1986, 1990; Stein-bacher and SteinStein-bacher, 1993). The relationship be-tween JIT, TQM, and MP has been supported in academic research (Flynn et al., 1995, 1996). McK-one et al. (1999) showed that the implementation level of TPM was closely linked to the implemen-tation level of JIT, TQM, and EI. Companies with higher implementation levels of JIT, TQM, and EI also had higher implementation levels of TPM. A more general study by Tunälv (1992) showed empir-ically that business units with a manufacturing strat-egy placed significantly more emphasis on product-and process-related programs (such as JIT, quality management practices, and preventive maintenance) than those without a strategy. These same business units were also more successful in their financial performance.
In this study, we have not included EI as a sepa-rate component in our framework since it pervades all the other World Class Manufacturing compo-nents — TPM, JIT, and TQM — and, therefore, is implicitly included in our framework. Moreover, we cannot comprehensively capture the implementation of EI as a separate component of World Class Man-ufacturing due to limitations of the database that we are using. Therefore, the following discussion con-siders the relationships between JIT, TQM, TPM, and MP.
Hayes and Wheelwright (1984) emphasized the need to match the facilities and technology choice with business manufacturing programs and people. A manufacturing program is successful only when it improves MP and is aligned with the business strategy. Similarly, the system frameworks of various authors (Gerwin, 1976; Galbraith, 1977; Van de Ven and Ferry, 1980) all hypothesized that consistency among organizational design characteristics leads to higher performance. These studies suggest that we should not consider the impact of TPM on MP
without considering the other relevant organizational characteristics.
TPM, when part of a world class manufacturing strategy that incorporates JIT and TQM, should lead to improved MP. The importance of the relationship be-tween JIT and TPM is clear. JIT’s emphasis on waste reduction creates an environment where inventory is reduced, production processes are interdependent, and the plant operation is susceptible to breakdowns of any process. TPM provides dependable equip-ment, reduces the number of production disturbances, and increases plant capacity by providing effective equipment maintenance. A study by Sakakibara et al. (1997) showed that there was not a significant rela-tionship between the use of JIT practices and MP; however, the combination of JIT management and infrastructure practices were related to MP. Similarly, we believe that TPM practices indirectly influence MP by supporting JIT practices.
The relationship between TPM and TQM is also im-portant. TQM aims to reduce variation in the product and eliminate defects. A strong maintenance program is needed to provide reliable equipment maintenance and reduce equipment process variation. Flynn et al. (1995) found that quality practices focusing solely on quality improvement might not be a sufficient means for a plant to attain and sustain its competitive posi-tion. It is likely that the use of TPM to improve equip-ment performance and increase the skills of workers could be an additional factor in supporting TQM and explaining competitive advantage. Therefore, we be-lieve that TPM indirectly improves MP by supporting TQM efforts.
In this paper, we consider the indirect effect of TPM on MP through JIT and TQM. Barley (1990) indicates that technologies change organizational and occupa-tional structures by transforming patterns of action and interaction and that roles and social networks are held to mediate technology effects. Similarly, organi-zational practices, such as JIT and TQM, may support TPM (a program focused on improving the technol-ogy base) and its effect on MP.
H2a. JIT accounts for a significant portion of the positive relationship between TPM and MP.
H2b. TQM accounts for a significant portion of the
positive relationship between TPM and MP.
It is important to mention that our framework, as presented in Fig. 1, is one possible set of relationships. Clearly, the framework explores both the direct and indirect links between TPM and MP. While other re-lationships are possible (e.g., TQM influences JIT or TPM), this paper concentrates on TPM and its rela-tionship with MP.
3. Description of data
The data used for empirical analysis of the frame-work were collected as part of the World Class Man-ufacturing (WCM) Study (Flynn et al., 1994) being conducted by a team of researchers at several universi-ties in the US, Europe, and Asia. The WCM database used for our research was assembled in 1997 from three different regions of the world and three different industries using a common set of questionnaires. The database addresses TPM, JIT, and TQM and includes 117 different manufacturing plants.
The WCM database contains data from plants in the US, Italy, Germany, and Japan. These four countries partially represent the three major regions of the in-dustrialized world: North America, Europe, and Asia. In each country, plants were selected from three tries: electronics, machinery, and automobile indus-tries. A stratified design was used to randomly select an approximately equal number of plants in each coun-try and each induscoun-try. For this study, we did not in-vestigate cross-country or cross-industry differences. We utilized the worldwide dataset in order to test our hypotheses with a wide variety of plants.
The selected plants were contacted by a member of the WCM research team to participate in the study. Two-thirds of the plants contacted decided to join the study. This relatively high response rate was assured by contacting the plants personally and by promising that they would receive a plant profile for comparison with other plants.
The data were collected in each plant using ques-tionnaires that were completed by 11 managers and
12 production workers. This battery of questionnaires allowed for multiple respondents for each question, thereby providing greater reliability of the data. In addition, it allowed respondents to address their par-ticular area of expertise. For example, certain people responded to the TPM questions and others responded to the MP questions. Also, we used two types of questions: objective and perceptual. The objective questions were answered by one respondent in each plant and addressed topics which can be measured on an objective basis such as: “what percentage of the maintenance in the plant is performed by the work-ers rather than by a separate maintenance crew?”. The perceptual questions were arranged in multi-item scales to ensure accurate representation of the con-structs of interest. Each scale consisted of several questions pertaining to the same construct; the an-swers to the questions were averaged to arrive at a scale score. By using different types of measures and various respondents, we eliminated potential prob-lems with common method or common respondent bias.
In the next section, the constructs of interest con-cerning TPM, JIT, TQM, and MP are described. These constructs are measured by a combination of percep-tual scales and objective measures from the WCM database.
4. Measurement of variables
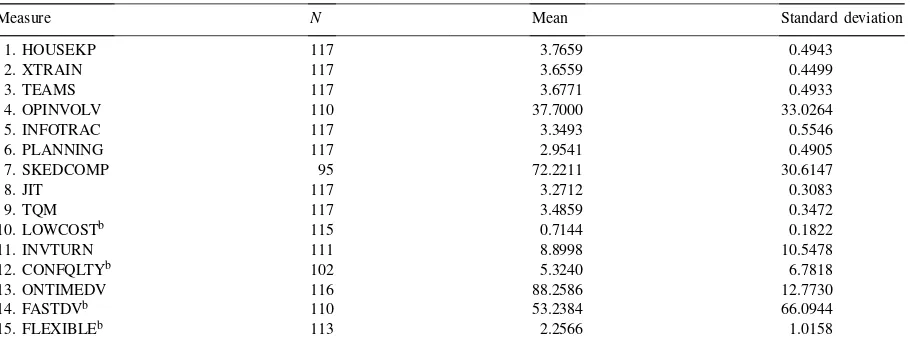
As shown in Fig. 1, we selected seven TPM mea-sures, one measure each for JIT and TQM, and six MP measures from the WCM database which are briefly discussed in this section. In our database 41 cases had a single missing value, 7 cases had two missing val-ues, and 3 cases had three missing values out of 15 measures. Table 1 provides summary statistics of the 15 raw observed measures.
Table 1
Summary statistics of observed measuresa
Measure N Mean Standard deviation
1. HOUSEKP 117 3.7659 0.4943
2. XTRAIN 117 3.6559 0.4499
3. TEAMS 117 3.6771 0.4933
4. OPINVOLV 110 37.7000 33.0264
5. INFOTRAC 117 3.3493 0.5546
6. PLANNING 117 2.9541 0.4905
7. SKEDCOMP 95 72.2211 30.6147
8. JIT 117 3.2712 0.3083
9. TQM 117 3.4859 0.3472
10. LOWCOSTb 115 0.7144 0.1822
11. INVTURN 111 8.8998 10.5478
12. CONFQLTYb 102 5.3240 6.7818
13. ONTIMEDV 116 88.2586 12.7730
14. FASTDVb 110 53.2384 66.0944
15. FLEXIBLEb 113 2.2566 1.0158
aThe summary statistics were calculated using the responses to the items in the survey that have not been statistically adjusted. bIndicates that a low value of the measure reflects good performance.
level of program implementation or good perfor-mance. A correlation matrix and the variances of the 15 statistically adjusted measures are shown in Table 2.
We also performed Box’s M test to determine if the combination of data from three industries and four countries is suitable for structural equa-tion modeling (SEM). The tests performed on the statistically adjusted data provide no evidence to conclude that there is significant difference among the covariance matrices of the measures across the three industries and the four countries. Based on this analysis, we concluded that the use of our statisti-cally adjusted dataset was sufficient for our analysis approach.
4.1. Measurement of TPM
For this study, we have selected questions from the WCM database that fit well with our literature review on TPM and concentrate on the daily main-tenance efforts that could be normally found at the plant-level of the organization. These short-term TPM efforts include both autonomous and planned main-tenance activities. We have chosen to concentrate on short-term daily efforts for three reasons: (1) typi-cally TPM efforts begin with these in-plant
main-tenance efforts; (2) this is a plant-level study and cannot assess the organization-wide maintenance ef-forts; and (3) this is not a longitudinal study and can-not evaluate the long-term efforts well. See Appendix A for details of the questions used for our analy-sis. Rather than simply measuring the existence of a TPM program, our questions assess the level of TPM implementation.
The autonomous maintenance variables in-clude three perceptual measures for housekeeping,
cross-training, and teams, and an objective measure
for operator involvement. For housekeeping, we
pro-duction and maintenance teams. Finally, foroperator
involvement, we used an objective measure of the
percentage of operators who are directly involved in the maintenance delivery process. This measure pro-vides another indicator of the implementation level of autonomous maintenance.
While both the operators and maintenance per-sonnel are involved in the planning and execution of maintenance within a TPM program, the main-tenance personnel are ultimately held accountable for long term maintenance planning and the state of readiness of the equipment. With the data that was available, we considered three measures of planned maintenance: two perceptual measures fordisciplined
planning andinformation tracking, and an objective
measure forschedule compliance. Adisciplined plan-ningapproach typically dedicates time for scheduled maintenance activities, assigns tasks to specific peo-ple and inspects for good quality workmanship. We considered four questions that address the planning of the maintenance department. An information system that tracks past and current equipment performance is also important to a successful maintenance depart-ment. We assessed theinformation tracking systems that are relevant to equipment performance through five questions. Finally, compliance to a planned main-tenance schedule is a measure of the successful appli-cation of the maintenance tools and execution of the plans. We used a self-reported schedule compliance
measure as another indicator of planned maintenance implementation.
4.2. Measurement of MP
In this study, we are measuring MP at the plant level. Since the plant does not control sales or costs outside the plant, overall financial measures of plant performance are not appropriate. Rather, the basic di-mensions of plant performance which are controlled by the plant are used: cost, quality, delivery, and flexi-bility (Skinner, 1969; Schroeder, 1993; Ward et al., 1995). We discuss our measurement of each of the four dimensions of plant performance in this section. Appendix B has the details of our survey questions on MP.
Cost is interpreted to mean not only the tradi-tional accounting cost of manufacturing, but also the economic costs associated with inventories. For
manufacturing cost, we measured the manufactur-ing cost of goods sold as a percentage of sales. We measured inventory costs as the inventory turnover ratio. A high turnover ratio indicates a low cost po-sition. Both of these ratios are dimensionless and are not subject to currency differences between countries.
Quality from a manufacturing point of view is measured as the percentage of good products that are produced (conformance to specifications) or if the quality is good enough defects can be measured in ppm (parts per million). Of course, quality can also be measured by customer satisfaction, which is in-fluenced not only by the lack of defects but also by product designs and after-sales service. Since product design and service are cross-functional responsibili-ties, we do not include customer satisfaction here as a MP measurement and only consider conformance quality.
Delivery performance includes two different mea-sures: the percentage of orders delivered on time (or filled from stock) and the manufacturing lead-time from when an order is placed until it is delivered. These measures are indicative of a plant’s ability to deliver quickly and as promised.
Finally, flexibility can be measured in a number of different ways. We have chosen to use one measure: the length of time that it takes to change the master production schedule. Most plants have a frozen pro-duction horizon inside of which they do not take addi-tional orders or make changes to existing orders. This production horizon measures a plant’s capability to make changes and, of course, a shorter horizon offers more flexibility.
4.3. Measurement of JIT and TQM
C for details of the survey questions used for our measures.
To measure the implementation of JIT, we cons-idered various JIT practices and developed a linear combination of five scales used in Sakakibara et al. (1993, 1997). Our measurement captures JIT deliv-ery by suppliers, JIT link with customers, pull sys-tem support, repetitive nature of the master production schedule, and setup reduction efforts within the plant. This is a comprehensive measurement of JIT involv-ing five different scales that measure different aspects of JIT.
To measure the implementation level of TQM, we considered customer involvement, rewards for quality, supplier quality management, and top management leadership for quality. Previous studies have found that these aspects of TQM adequately represent a broad-based view of the construct (Flynn et al., 1994, 1996).
4.4. Validity and reliability of scale measures
Our research used data from the WCM Study and many of the constructs have been used and tested in previous studies (Sakakibara et al., 1993, 1997; Flynn et al., 1994, 1996; McKone et al., 1999). In addi-tion, the items used for each construct fit well with the concepts of TPM, JIT, and TQM discussed in the framework and existing literature and therefore have a high degree of content validity. Although it may be difficult to completely separate the concepts of TPM, JIT, and TQM, the measures used for these con-structs are not identical. The discriminant validity of the factors for TPM, JIT, and TQM were tested us-ing confirmatory factor analysis approach (Bagozzi, 1980; Burnkrant and Page, 1982). In the tests, mod-els of separate but correlated factors were compared to models in which the pair of factors was hypothe-sized to have a unity correlation or to be unidimen-sional. The difference between the two models was evaluated using a change inχ2 test with one degree of freedom. In the comparisons of the TPM–JIT mod-els and the TPM–TQM modmod-els, theχ2difference val-ues were significant, indicating that TPM is indeed a separate scale and is only correlated with JIT and TQM.
We used Cronbach’s coefficient α to evaluate the reliability of the scales at the plant-level. Theαscores
for each scale ranged from 0.77 to 0.90. Since allα scores were considerably higher than the 0.70 accept-able level advocated by Nunnally (1978), all scales exhibit a high degree of reliability.
5. Method of analysis
Our analysis focused on understanding the nature of the relationship between TPM and MP. Through SEM using AMOS 3.61 (Arbuckle, 1997), we tested our specified framework (refer to Fig. 1 for a diagram of the model and the testable paths). We evaluated our measurement model and considered the relation-ship between observed TPM measures and a latent TPM construct, and between plant performance mea-sures and a latent MP construct. We also tested our specified hypotheses between the latent TPM and MP constructs and the observed JIT and TQM mea-sures. The results of the SEM analysis allowed us to describe the correlation between variables, to un-derstand which TPM variables best explain the TPM construct, to understand the nature (direct and indi-rect) of the relationship between TPM and MP, and to understand which MP measures best explain the MP construct (the variables that are highly influenced by TPM).
We took a hierarchical (staged) approach to test-ing hypothetical models that describe the relationship between both observed and unobserved measures for TPM, JIT, TQM, and MP. This staged approach, sim-ilar to hierarchical regression, allows us to determine if the addition of new set of relationships adds signi-ficantly to our explanation of the variation in the data. Therefore, we can test H2a and H2b by evaluating the difference in model fit when the indirect relationships are added to the model.
For each of our models, maximum likelihood estimation was used, the procedure converged for estimation, the model was identified, and all residual variances were positive. At each step of the model testing process, we compared the fit of the mod-els. For model evaluation, we used several standard model evaluation criteria. (1) The Degrees of Free-dom (DF) represents the difference between the number of independent statistics and the model pa-rameters fitted. (2) The Likelihood Ratio Test (LRT) statistic is minimized and is usually interpreted as a χ2 variate. (3) The Likelihood Ratio Test to De-grees of Freedom (LRT/DF) Ratio is a relative χ2 measure for model fit. A value of less than 5 for this ratio indicates acceptable fit (Wheaton et al., 1977; Marsh and Hocevar, 1985). (4) The Goodness of Fit Index (GFI) rescales the fit of the observa-tions and the expectaobserva-tions between 0 and 1, where 1 represents a perfect fit. (5) Bollen’s (1989) Incre-mental Fit Index (IFI) basically represents the point at which the model being evaluated falls on a scale running from the null model (where all correlations are zero) to a perfect fit, where a perfect fit would equal 1. This index is adjusted for the DF of the model. (6) The Root Mean Square Residual (RMR) index represents the average size of the residual correlations. (7) The Root Mean Square Error of Approximation (RMSEA) is a measure of the pop-ulation discrepancy that is adjusted for the DF for testing the model. A value of 0.08 or less for RMSEA would indicate a reasonable error of approximation (Browne and Cudeck, 1993).
There is one common problem encountered in test-ing all model hypotheses in SEM. The LRT can be interpreted as aχ2variate for testing the null hypothe-ses of zero residual correlations; however, theχ2 vari-ate is sensitive to sample size (Cochran, 1952; Bentler and Bonnet, 1980). For example, an insignificantχ2 value does not always indicate a poor model fit and does not suggest that a model is not meaningful (Hay-duk, 1996). Instead, we need to look at other model fit statistics and also compare the difference in fit be-tween models. By comparing the difference in LRT statistics (dLRT) with the associated difference in de-grees of freedom (dDF), we can test whether a model improves the fit over another nested model (Ander-son and Gerbing, 1988; Mulaik et al., 1989; McArdle and Prescott, 1992). In this way, we are able to
sep-arate a good-fitting model from a poor-fitting model and can determine if one model provides a signifi-cantly better fit than another model. To test our hy-potheses, we need to determine if the addition of a new relationship to our model helps to improve the explanation of the variation in the data. Therefore, comparing the difference in LRT statistics (dLRT) with the associated dDF is important to testing our hypotheses.
6. Results and discussion
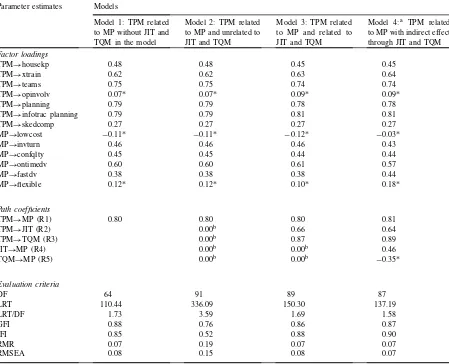
Through SEM, we tested our hypothesized relation-ships between TPM and MP. Each stage of our ana-lysis resulted in a new model, the results of which are shown in Table 3. Models 2, 3, and 4 are a nested se-quence of models that allow us to provide information about distinct aspects of the structural equation model embedded within the sequence. By using the dLRT statistics, we are able to isolate where fit and lack of fit arise in the model in the nested sequence and can test hypotheses H2a and H2b. In this section, we will review our analysis results and discuss the meaning of the results. First, we discuss our test for hypothesis H1 and then proceed to discuss tests for both hypotheses H2a and H2b.
The first step in our analysis was to test hypothe-sis H1, the direct relationship between TPM and MP. We considered a model without JIT and TQM mea-sures (Model 1 in Table 3) and found that TPM has a positive and significant relationship with MP. The model showed that a 0.80 coefficient explained the relationship between the latent TPM and MP con-structs. The fit of the model without JIT and TQM was good, with LRT/DF=1.73, GFI=0.88, IFI=0.85, RMR=0.07, and RMSEA=0.08.1 As a result, we cannot reject hypothesis H1 that TPM has a positive relationship with MP.
Our results show that the TPM construct primarily consists of six measures: three autonomous mainte-nance measures–housekeeping (item loading=0.48), cross-training (0.62), and teams (0.75); and three
1We have considered values of the model fit criteria that are
Table 3 Results of SEM
The parameter estimates are standardized maximum likelihood estimates
Parameter estimates Models
Model 1: TPM related to MP without JIT and TQM in the model
Model 2: TPM related to MP and unrelated to JIT and TQM
Model 3: TPM related to MP and related to JIT and TQM
Model 4:a TPM related
to MP with indirect effect through JIT and TQM
Factor loadings
TPM→housekp 0.48 0.48 0.45 0.45
TPM→xtrain 0.62 0.62 0.63 0.64
TPM→teams 0.75 0.75 0.74 0.74
TPM→opinvolv 0.07* 0.07* 0.09* 0.09*
TPM→planning 0.79 0.79 0.78 0.78
TPM→infotrac planning 0.79 0.79 0.81 0.81
TPM→skedcomp 0.27 0.27 0.27 0.27
MP→lowcost −0.11* −0.11* −0.12* −0.03*
MP→invturn 0.46 0.46 0.46 0.43
MP→confqlty 0.45 0.45 0.44 0.44
MP→ontimedv 0.60 0.60 0.61 0.57
MP→fastdv 0.38 0.38 0.38 0.44
MP→flexible 0.12* 0.12* 0.10* 0.18*
Path coefficients
TPM→MP (R1) 0.80 0.80 0.80 0.81
TPM→JIT (R2) 0.00b 0.66 0.64
TPM→TQM (R3) 0.00b 0.87 0.89
JIT→MP (R4) 0.00b 0.00b 0.46
TQM→MP (R5) 0.00b 0.00b −0.35*
Evaluation criteria
DF 64 91 89 87
LRT 110.44 336.09 150.30 137.19
LRT/DF 1.73 3.59 1.69 1.58
GFI 0.88 0.76 0.86 0.87
IFI 0.85 0.52 0.88 0.90
RMR 0.07 0.19 0.07 0.07
RMSEA 0.08 0.15 0.08 0.07
aIndicates that the model is the best fitting model. bIndicates a fixed parameter.
∗Indicates a free parameter that is not significantly different from zero (t<2.0).
planned maintenance measures–information track-ing (0.79), disciplined planntrack-ing (0.79), and schedule compliance (0.27). One of the autonomous main-tenance measures — operator involvement — does not have a significant relationship with our TPM construct. In addition, schedule compliance, while significant, is poorly explained by our TPM con-struct (squared multiple correlation of 0.07). Both of these measures are objective measures, measured
on different scales than the other TPM measures. These objective measures also have more miss-ing values. It is possible that these measures have measurement error or do not accurately represent the nature or level of TPM implementation at the plant.
stable whether or not they were excluded from the model. Furthermore, the exclusion of the low load-ing measures from the models led to poorer overall model fit. Our MP construct consists of four statisti-cally significant measures of performance. High MP is consistent with low cost (as measured by higher inventory turns [item loading=0.46]), high quality levels (as measured by higher levels of conformance to specifications [0.45]), and strong delivery perfor-mance (as measured by a higher percentage of on-time deliveries [0.60] and by faster speeds of delivery [0.38]). Therefore, our TPM construct influences our MP construct and is associated with low cost inven-tory positions, high internal quality, and responsive delivery.
However, our MP construct, and therefore our TPM construct, has no significant relationship with low cost (as measured by manufacturing cost as a percentage of sales) or flexibility (as measured by the time horizon of the fixed production schedule). The non-significant relationship with low cost may be explained by the following: (1) maintenance is a small portion of to-tal costs, and therefore, a change in maintenance costs has a non-significant impact on our cost measure; (2) manufacturing costs are calculated in different ways depending upon the company; therefore, it is diffi-cult to compare the results between companies; or (3) TPM allows for effective use of the budgeted mainte-nance expenses and is able to improve inventory turns, quality, and delivery while maintaining stable produc-tion costs. The non-significant relaproduc-tionship with flex-ibility could be a result of our measure of flexflex-ibility. It is difficult to change the planning horizon without process, equipment, and planning system modifica-tions. Another possible explanation is that the trans-formation of our flexibility measure, while helpful in satisfying condition for normality, may not rep-resent the non-linear relationship between TPM and flexibility.
Nevertheless, it is interesting to notice the multi-dimensionality of our MP construct. TPM does not impact only one dimension of MP but im-pacts several dimensions of performance. The idea of compatibility of manufacturing dimensions had been discussed in recent literature. Ferdows and De Meyer (1990) proposed a “sandcone” model which represents a sequential approach to achieving com-patibility among the four dimensions. Also, Hayes
and Pisano (1996) and Menda and Dilts (1997) ad-vocate compatibility of manufacturing dimensions and the absence of trade-offs. While maintenance has traditionally been seen as a means of con-trolling cost, our results show that TPM simulta-neously impacts components of cost, quality, and delivery.
Next, we tested hypotheses H2a and H2b. To test these hypotheses, we explored a series of nested mod-els that included our TPM and MP constructs as well as our JIT and TQM measures. The results of these models are shown in Table 3. First, we tested the di-rect relationship between TPM and MP, when JIT and TQM are unrelated to TPM and MP (Model 2). For this model, all relationships in Fig. 1, except R1, are set equal to zero. The fit of Model 2 is significantly better than a model where the relationship between TPM and MP is also set to zero (dLRT=39.13 on dDF=1). However, overall this model has a rela-tively poor fit (LRT/DF=3.59, GFI=0.76, IFI=0.52, RMR=0.19, and RMSEA=0.15). The poor fit is due to the fact that we consider there to be no re-lationship between JIT and TQM and any other la-tent or manifest variable in the model. It is likely that JIT, TQM, TPM, and MP are related in some manner.
Next, we considered several models where the relationships between TPM and JIT and TPM and TQM are tested. Model 3 permits TPM to influence MP as well as the level of JIT and TQM imple-mentation, allowing R1, R2, and R3 from Fig. 1 to be non-zero while R4 and R5 are set equal to zero. When the fit of Model 3 is compared to the fit of Model 2, there is a significant improvement in fit (dLRT=185.79 on dDF=2). This suggests that when a plant has multiple manufacturing practices, they cannot be considered to be independent; rather, they can be considered to be mutually supportive of each other. In this case, TPM has a significant and positive influence on both JIT and TQM implementation, in-dicating a reliable association of TPM with JIT and TQM and supporting our hypothesized relationships. This result is also consistent with McKone et al. (1999) where higher levels of TPM implementation were associated with higher levels of JIT and TQM implementation.
with MP (R1, R2, R3, R4, and R5 are all al-lowed to be non-zero). This model has a good fit (LRT/DF=1.58, GFI=0.87, IFI=0.90, RMR=0.07, and RMSEA=0.07) and also improves the fit over pre-vious models. When compared to Model 2, where only direct relationships between TPM and MP are con-sidered, Model 4 significantly improves the fit of the model (dLRT=198.90 on dDF=4). This suggests that
Fig. 2. Best fitting model — Model 4. A value along an arrow is a standardized factor loading or path coefficient. A value above an endogenous variable indicates the squared multiple correlation (SMC) between that variable and the variables (other than residual variables) directly affecting it. The “*” indicates a free parameter that is not significantly different from zero (t<2.0).
Our final model, Model 4, is the best fitting model and is pictured in Fig. 2. It is important to notice that the relationship between TQM and MP, R5 in Fig. 1, is non-significant. This leads us to reject hypothesis H2b. There are three possible explanations for this re-sult. (1) Our definition of TPM included some mea-sures that could be included in TQM. In fact, the variance of our TQM measure is mostly explained (0.78 is the squared multiple correlation, shown in Fig. 2) by our TPM construct. This suggests that TPM and TQM are interrelated. (2) TQM represents an in-tegrated theory of management philosophy (Powell, 1995) rather than a clearly defined technology or set of techniques. It is feasible that TQM could invoke a goal of improving quality without dictating a well-defined routine for accomplishing it (Westphal et al., 1997). Campbell (1994, p. 7) mentions that when TQM ac-quires institutional status, quality practices may be evaluated by a “logic of social appropriateness” rather than a “logic of instrumentality”. (3) Loose coupling may occur between TQM practices designed for cus-tomer demands and the activities on the plant floor designed for plant performance. TQM is found to have a stronger impact on customer satisfaction than plant performance (Choi and Eboch, 1998). Perhaps TQM, as measured in this study, considers the so-cially accepted aspects of the program rather than the instrumental aspects of the program that would di-rectly improve MP. This helps explain why TQM, as measured in this paper, does not contribute to MP and why TPM does provide such a large explana-tion of MP. Our TPM construct has a clearly defined set of methods for improving performance while our TQM measure considers only general management approaches.
While TQM does not provide a significant expla-nation of the positive relationship between TPM and MP, the relationship between TPM and MP through JIT is significant and positive (R2 and R4 in Fig. 1). Therefore, we cannot reject hypothesis H2a. Our re-sults support our theory that TPM helps improve the equipment performance which in turn supports JIT’s efforts to reduce inventory, shorten lead-times, and eliminate other wastes. The impact of TPM should not be considered in isolation but must be considered with respect to the other manufacturing practices. These re-sults augment those of Sakakibara et al. (1997), who showed that a combination of JIT management and
infrastructure practices were related to MP. Our re-sults suggest that JIT practices need to be supported by TPM efforts and that together JIT and TPM can improve MP.
7. Conclusions
The results of the analyses indicate that TPM, as measured for this paper, has a strong positive impact on multiple dimensions of MP. While TPM directly impacts MP, there is also a strong indirect relationship between TPM and MP through JIT. Our results are important for two reasons. (1) Maintenance programs have long been used as a means to control manufac-turing costs. Our results show that TPM does more than control costs, it can improve dimensions of cost, quality, and delivery. TPM can be a strong contrib-utor to the strength of the organization and has the ability to improve MP. (2) World Class Manufactur-ing programs, such as JIT, TQM, and TPM, should not be evaluated in isolation. They are closely related and in combination can help foster better MP. Future research should further consider the relationships be-tween these practices and their combined impact on performance.
We plan to continue our research in this area to fur-ther explain the relationship between manufacturing practices and MP. In particular, we plan to identify the common infrastructural and unique practices of TQM, JIT, and TPM, and test their interrelationships and im-pact on MP. Also, we would like to investigate the nature of the relationships in different contextual situ-ations (for example, cross-country and cross-industry differences), combining the work from McKone et al. (1999) and this paper. In addition, we would like to consider the life cycle of the practices and evaluate the impact of the development time on MP. Hopefully, this type of research will support and encourage suc-cessful implementation of TQM, JIT, and TPM.
Appendix A. Measurement of TPM implementation
Concept Factor Measure
Autonomous maintenance
House-keeping, α=0.85632
Our plant emphasizes putting all tools and fixtures in their place. We take pride in keeping our plant neat and clean.
Our plant is kept clean at all times.
I often have trouble finding the tools I need.3 Our plant is disorganized and dirty.3
Cross-training, α=0.80052
Employees receive training to perform multiple tasks.
Employees at this plant learn how to perform a variety of tasks/jobs.
The longer an employee has been at this plant, the more tasks or jobs they learn to perform.
Employees are cross-trained at this plant so that they can fill in for others if necessary.
At this plant, employees only learn how to do one job/task.3 Teams,α=0.88122 During problem solving sessions, we make an effort to get all team
members’ opinions and ideas before making a decision. Our plant forms teams to solve problems.
In the past 3 years, many problems have been solved through small group sessions.
Problem solving teams have helped improve manufacturing pro-cesses at this plant.
Employee teams are encouraged to try to solve their problems as much as possible.
Operator involvement What percent of the maintenance on the machines involved in the production of this product is performed by the workers, rather than by a separate maintenance crew?4
Planned Maintenance
Disciplined planning, α=0.76662
We dedicate a portion of every day solely to maintenance. We emphasize good maintenance as a strategy for achieving qual-ity and schedule compliance.
We have a separate shift, or part of a shift, reserved each day for maintenance activities.
Our maintenance department focuses on assisting machine opera-tors perform their own preventive maintenance.
Information tracking, α=0.81322
Charts plotting the frequency of machine breakdowns are posted on the shop floor.
Information on productivity is readily available to employees. A large percent of the equipment or processes on the shop floor are currently under statistical quality control.
We use charts to determine whether our manufacturing processes are in control.
We monitor our processes using statistical process control.
2
αrefers to Cronbach’s alpha, used to measure the reliability of the scale.
3Indicates that the variable is reversed scored.
4Response is in terms of percentage. All other responses are in the scale score format with 1 being strongly disagree and 5 being
Schedule compliance What percent of the time is the maintenance schedule (for equip-ment used to produce this product) followed?4
Appendix B. Measurement of MP
Concept Meaning Measure
Low cost (LOWCOST)5 Manufacturing cost of goods sold as a percentage of sales.
Manufacturing costs
Sales value of production Inventory turnover (INVTURN) Manufacturing cost of
goods sold as a percentage of average inventory.
Manufacturing costs
Value of average annual finished goods inventory
Value of average annual work-in-process inventory
Value of average annual raw materials inventory
Quality (CONFQLTY)5 Conformance to specifications. What is the percentage of internal scrap and rework?
On-time delivery (ONTIMEDV) Ability to deliver as promised. What percentage of the orders are shipped on time?
Fast delivery (FASTDV)5 Ability to deliver quickly. What is the average lead-time from the receipt of an order until it is shipped (in days)?
Flexibility (FLEXIBLE)5 Flexibility to change mas-ter production schedule.
What is the time horizon for the fixed production schedule?
(1) 1 day, (2) 1 week, (3) 1 month, (4) 3 months or more
Appendix C. Measurement of JIT and TQM Implementation
Concept Factor Measure
JIT,α=0.90456 JIT delivery by suppliers Our suppliers deliver to us on a JIT basis. We receive daily shipments from most suppliers. Our suppliers are certified, or qualified, for quality. We have long-term arrangements with our suppliers. Our suppliers deliver to us on short notice.
We can depend upon on-time delivery from our suppliers.
Our suppliers are linked with us by a pull system. JIT link with customers Our customers receive JIT deliveries from us.
5Indicates that the variable is adjusted so that a high value reflects good performance. 6
Most of our customers receive frequent shipments from us.
We are expected to supply on short notice to our cus-tomers.
We always deliver on time to our customers.
We can adapt our production schedule to sudden pro-duction stoppages by our customers.
Our customers have a pull type link with us.
Pull system support We use a back-flushing system, where components are subtracted from inventory every time a product is made. We have laid out the shop floor so that process and machines are in close proximity to each other.
Direct Labor is authorized to stop production for quality problems.
We use a pull system for production control. The control of production is in the hands of the workers.
Generally, workers on the production floor have the au-thority to decide how to handle production problems. We have low work-in-process inventory on the shop floor.
When we have a problem on the production floor, we can identify its location easily.
Repetitive nature of master schedule
Our master schedule repeats the same mix of products from hour to hour and day to day.
The master schedule is level-loaded in our plant from day to day.
We make every model every day.
A fixed sequence of items is repeated throughout our master schedule.
We are able to use a mixed model schedule because our lot sizes are small.
Within our schedule, the mix of items is designed to be similar to the forecasted demand mix.
Setup reduction We are aggressively working to lower setup times in our plant.
We have converted most of the setup time to external time while the machine is running.
We have low setup times of equipment in our plant. Our crews practice setups to reduce the time required. Our workers are trained to reduce set-up time.
Management emphasizes importance of set-up time re-duction.
TQMα=0.89346 Customer involvement We frequently are in close contact with our customers. Our customers seldom visit our plant.7
————
Our customers give us feedback on quality and delivery performance.
Our customers are actively involved in the product design process.
We strive to be highly responsive to our customers’ needs. We regularly survey our customers’ requirements.
Rewards for quality Workers are rewarded for quality improvement. Supervisors are rewarded for quality improvement. If I improve quality, management will reward me. We pay a group incentive for quality improvement ideas. Our plant has an annual bonus system based on
plant productivity.
Non-financial incentives, such as jackets, coffee cups, etc., are used to reward quality improvement.
Supplier quality We strive to establish long-term relationships with suppliers. management Our suppliers are actively involved in our new product
de-velopment process.
Quality is our number one criterion in selecting suppliers. We rely on a small number of high quality suppliers. We use mostly suppliers which we have certified.
We maintain close communication with suppliers about quality considerations and design changes.
Top management All major department heads within our plant accept their responsibility for quality.
leadership for quality
Plant management provides personal leadership for quality products and quality improvement.
The top priority in evaluating plant management is quality performance.
All major department heads within our plant work towards encouraging JIT production.
Our top management strongly encourages employee involve-ment in the production process.
Plant management creates and communicates a vision fo-cused on quality improvements.
Plant management is personally involved in quality improve-ment projects.
References
Adler, P.S., Shenhar, A., 1990. Adapting your technological base: the organizational challenge. Sloan Management Review, 25–36, Fall
Anderson, J.C., Gerbing, D.W., 1988. Structural equation modeling in practice: a review and recommended two-step approach. Psychological Bulletin 103, 411–423.
Arbuckle, J.L., Amos Users’ Guide Version 3.6, Small Waters, Chicago, IL
Bagozzi, R.P., 1980. Causal Models in Marketing. Wiley, New York, NY.
Barley, S.R., 1990. The alignment of technology and structure through roles and networks. Administrative Science Quarterly 35, 61–103.
Bollen, K.A., 1989. A new incremental fit index for general structural equation models. Sociological Methods and Research 17, 303–316.
Burnkrant, R.E., Page, T.J., 1982. An examination of the convergent, discriminant and predictive validity of Fishbein’s behavioral intention model. Journal of Marketing Research 19, 550–561.
Campbell, J.L., 1994. Recent trends in institutional analysis: bringing culture back into political economy. Working Paper, Department of Sociology, Harvard University.
Choi, T.Y., Eboch, K., 1998. The TQM paradox: relations among TQM practices, plant performance, and customer satisfaction. Journal of Operations Management 17, 59–75.
Cleveland, G., Schroeder, R.G., Anderson, J.C., 1989. A theory of production competence. Decision Sciences 20, 643–655. Cochran, W.G., 1952. Theχ2 test of goodness of fit. Annals of
Mathematical Statistics 23, 315–345.
Ferdows, K., DeMeyer, A., 1990. Lasting improvements in manufacturing performance: in search of a new theory. Journal of Operations Management 9 (2), 168–184.
Flynn, B.B., Schroeder, R.G., Sakakibara, S., 1994. A framework for quality management research and an associated measurement instrument. Journal of Operations Management 11 (4), 339–366.
Flynn, B.B., Schroeder, R.G., Sakakibara, S., 1995. The impact of quality management practices on performance and competitive advantage. Decision Sciences 26 (5), 659–691.
Flynn, B.B., Schroeder, R.G., Sakakibara, S., 1996. The relationship between quality management practices and performance: synthesis of finding from the World Class Manufacturing Project. In: Fedor, D., Gosh, S., (Eds.), Advances in the Management of Organizational Quality Vol. 1 JAI Press, Greenwich, CT, pp. 141–186.
Galbraith, J.R., 1977. Organizational Design. Addison-Wesley, Reading, MA.
Garwood, W.R., 1990. World class or second class. Vital Speeches of the Day October 1.
Gerwin, D., 1976. A systems framework for organizational structural design. In: Kilman, R.H., Pondy, L.R., Slevin, D.P. (Eds.), The Management of Organization Design. North Holland, New York, pp. 89–102.
Hayduk, L.A., Lisrel: Issues, Debates and Strategies. Johns Hopkins, Baltimore.
Hayes, R., Pisano, G., 1996. Manufacturing strategy: at the intersection of two paradigm shifts. Production and Operations Management 5 (1), 25–41.
Hayes, R., Wheelwright, S.C., Clark, K.B., 1988. Dynamic Manufacturing. Free Press, New York.
Jarrell, S., Easton, G., 1997. An exploratory empirical investigation of the effects of total quality management on corporate performance. In: Lederer, P., Karmarkar, W. (Eds.), The Practice of Quality Management. Kluwer Academic Publishers, Norwell, MA, Chap. 2.
Koelsch, J.R., 1993. A dose of TPM: downtime needn’t be a bitter pill. Manufacturing Engineering, 63–66, April.
MACI, 1995. Four phase approach to planned maintenance. In: Proceedings of the Sixth Annual Total Productive Maintenance Conference and Exposition. Productivity Inc., Norwalk, CT, pp. 204–243.
Maier, F.H., Milling, P.M., Hasenpusch, J., 1998. Implementation and outcomes of total productive maintenance. In: Coughlan,
P., Dromgoole, T., Peppard, J. (Eds.), Operations Management: Future Issues and Competitive Responses, Papers from the 5th International Conferences of the European Operations Management Association, University of Dublin, Trinity College, Dublin 2, Ireland. 304–309.
Mardia, K.V., 1970. Measures of multivariate skewness and kurtosis with applications. Biometrika 57, 519–530.
Mardia, K.V., 1974. Applications of some measures of multivariate skewness and kurtosis in testing normality and robustness studies. Sankhya, Ser. B 36, 115–128.
Mardia, K.V., 1985. Mardia’s test of multinormality. In: Kotz, S., Johnson, N.L., (Eds.), Encyclopedia of Statistical Sciences Vol. 5 Wiley, New York, pp. 217–221.
Marsh, H.W., Hocevar, D., 1985. Application of confirmatory factor analysis to the study of self-concept: first and higher-order factor models and their invariance across groups. Psychological Bulletin 97, 562–582.
McArdle, J.J., Prescott, C.A., 1992. Age-based construct validation using structural equation modeling. Experimental Aging Research 18 (3), 87–115.
McKone, K.E., Schroeder, R.G., Cua, K.O., 1999. Total productive maintenance: a contextual view. Journal of Operations Management 17 (2), 123–144.
Menda, R., Dilts, D., 1997. The manufacturing strategy formulation process: linking multifunctional viewpoints. Journal of Operations Management 15 (4), 223–241.
Miller, J., Roth, A., 1994. A taxonomy of manufacturing strategies. Management Science 40 (3), 285–304.
Miller, W.B., Schenk, V.L., 1997. All I Need to Know About Manufacturing I Learned at Joe’s Garage: World Class Manufacturing Made Simple. Bayrock Press, USA.
Mulaik, S.A., James, L.R., Van Alstine, J., Bennett, N., Lind, S., Stilwell, C.D., 1989. Evaluation of goodness-of-fit indices for structural equation models. Psychological Bulletin 105 (3), 430–445.
Nakajima, S., 1988. Introduction to TPM. Productivity Press, Cambridge, MA.
Nunnally, J., 1978. Psychometric Theory. 2nd edn. McGraw-Hill, New York.
Powell, T.C., 1995. Total quality management as competitive advantage: a review and empirical study. Strategic Management Journal 16, 15–37.
Sakakibara, S., Flynn, B.B., Schroeder, R.G., 1993. A framework and measurement instrument for just-in-time manufacturing. Production and Operations Management 2 (3), 177–194. Sakakibara, S., Flynn, B.B., Schroeder, R.G., Morris, W.T., 1997.
The impact of just-in-time manufacturing and its infrastructure on manufacturing performance. Management Science 43 (9), 1246–1257.
Schonberger, R.J., 1986. World Class Manufacturing: The Lessons of Simplicity Applied. The Free Press, New York.
Schonberger, R.J., 1990. Building a Chain of Customers. The Free Press, New York.
Schroeder, R.G., 1993. Operations Management, Decision Making in the Operations Function. 4th edn. McGraw-Hill, New York. Shirose, K., 1992. TPM for Workshop Leaders, Productivity Press,
Skinner, W., 1969. Manufacturing — missing link in corporate strategy. Harvard Business Review 47 (3), 136–145. Steinbacher, H.R., Steinbacher, N.L., 1993. TPM for America:
What It Is and Why You Need It. Productivity Press, Cambridge, MA.
Suzuki, T., 1993. New Directions for TPM. Productivity Press, Cambridge, MA.
Tajiri, M., Gotoh, F., 1992. TPM Implementation: A Japanese Approach. McGraw-Hill, New York.
Teresko, J., 1992. Time Bomb or Profit Center. Industry Week, 52–57, March 2.
Tsuchiya, S., 1992. Quality Maintenance: Zero Defects Through Equipment Management. Productivity Press, Cambridge, MA. Tunälv, C., 1992. Manufacturing strategy — plans and business performance. International Journal of Operations and Production Management 12 (3), 4–24.
Tyer, M.J., 1991. Managing innovation on the factory floor. Technology Review, 59–65, October.
Tyer, M.J., Hauptman, O., 1992. Effectiveness of organizational responses to technological change in the production process. Organizational Science 3 (3), 301–320.
Van de Ven, A.H., Ferry, D.L., 1980. Measuring and Assessing Organizations. Wiley, New York.
Ward, P.T., Duray, R., Leong, G.K., Sum, C.C., 1995. Business environment, operations strategy and performance: an empirical study of Singapore manufacturers. Journal of Operations Management 13, 99–115.
Wheaton, B., Muthen, B., Alwin, D.F., Summers, G.F., 1977. Assessing reliability and stability in panel models. In: Heise, D.R., (Ed.), Sociological Methodology. Jossey-Bass, San Francisco, pp. 84–136.