(Monte Carlo) Resampling Technique in Validity Testing
and Reliability Testing
Adi Setiawan
Department of Mathematics, Faculty of Science and Mathematics,
Satya Wacana Christian University Jl. Diponegoro 52-60 Salatiga 50711 Indonesia
ABSTRACT
This paper describes the use of resampling technique in validity testing and reliability testing that are widely used in order to make the measurement tool in the field of psychology and education research. Resampling technique is the technique of resampling sample with replacement or without replacement. Resampling technique can be used to determine whether the item is valid or not by using the percentile confidence interval. The same technique can also be used to determine the significance of reliability coefficients in order to obtain a reliable measurement tool. This technique can also be used to obtain a higher reliability coefficient by reducing the sample size or by reducing the number of items used in the calculation. In this paper, the technique/method is described in the mini-data and case studies using real data that has 40 items and 48 respondents.
Keywords
Resampling technique, validity testing, reliability testing, Pearson coefficient of correlation, reliability coefficient.
1.
INTRODUCTION
In the making of measurement tool in the field of psychology and education research, it is often necessary to do validity testing and reliability testing. To test the validity of item usually use critical value 0.3 as a valid item without depend on the number of used respondent [1]. In addition, to test the reliability of measurement tool, it is often used 0.7 as the critical value of significance of reliability coefficient [2]. The critical value is not depend on the size of the sample used in the research. Resampling technique has been discussed and used in several recent papers (e.g, [3]; [4]; [5]). In this paper it will be discussed on how to use the resampling technique with replacement or without replacement to test the validity item and reliability of measurement tool.
2.
LITERATURE REVIEW
In the literature review it is described about how to calculate the Pearson correlation coefficient that is used as a tool to test the validity of the items, reliability coefficient that is used in reliability testing. In addition, it is also explained about resampling technique and examples of how this technique is used on small data (mini data).
Suppose (X1,Y1), (X2,Y2), …., (Xn,Yn) are bivariate random
sample size n that is taken from a certain population. Pearson coefficient of correlation is defined by
Y X
Y X
Y X
Y X
E
, ( )( )
where
X E[X],
Y E[Y], X V(X) and) (Y V
Y
and estimation of Pearson coefficient of correlation based on the sample can be found by [6] :
n
i i
n
i i
n
i
i i
Y
Y
X
X
Y
Y
X
X
r
1
2 1
2 1
)
(
)
(
)
)(
(
where
n
i i
X n X
1
1 and
n
i i
Y n Y
1
1 .
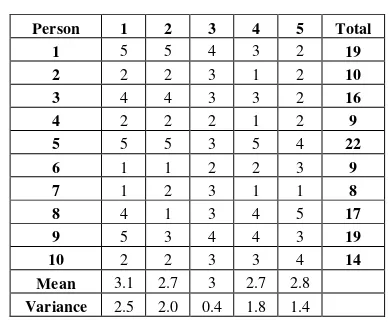
Suppose data of 10 respondents and 5 items that have a score of 1 through 5 are presented in Table 1. Pearson coefficients of correlation for each of the items are 0.95, 0.71, 0.66, 0.93 and 0.51 respectively. Pearson coefficient of correlation is said to be significant with level of significance 5% if it is bigger than 0.632 [7]. Thus, all items except item 5 are said to be significant. In other words item 1, item 2, item 3 and item 4 are valid items, while item 5 is said to be invalid. The valid item means that people who have high total scores will tend to give a high score on the item and people who have low total scores will tend to give a low score.
Table 1. Response of 10 persons on 5 items with score 1 through 5.
Person 1 2 3 4 5 Total 1 5 5 4 3 2 19 2 2 2 3 1 2 10 3 4 4 3 3 2 16 4 2 2 2 1 2 9 5 5 5 3 5 4 22 6 1 1 2 2 3 9 7 1 2 3 1 1 8 8 4 1 3 4 5 17 9 5 3 4 4 3 19 10 2 2 3 3 4 14 Mean 3.1 2.7 3 2.7 2.8
Variance 2.5 2.0 0.4 1.8 1.4
Source : [6] page 89.
X k i i k kr 12
2
1
1
with k specifies the number of items used in the calculations in the analysis,
2i is the variance of the i-th item andX 2
is the total score variance. Reliability coefficient ranges between 0 and 1 [8]. Reliability coefficient is positive and significant means that the measurement tool is reliable otherwise the measurement tool is not reliable. Based on Table 1, shows that all valid items except item 5 and that the reliability coefficient is 0.8484. If it is used all the items in the data it will be obtained the reliability coefficient 0.8080.2.1
Resampling Technique
Resampling technique with replacement can be explained as follows. Suppose a sample with sample size 4 i.e. {1, 2, 3, 4 }. Based on this sample, new sample with sample size n can be made based on the sample size 4 by taking one by one without replacement such that the new samples {2, 4, 1, 1} for sample size n = 4; {1, 2, 2} for sample size n = 3 and {4, 1 } for sample size n = 2 are obtained. If the procedure of the random sampling for the above experiment is repeated, a different result would be obtained randomly.
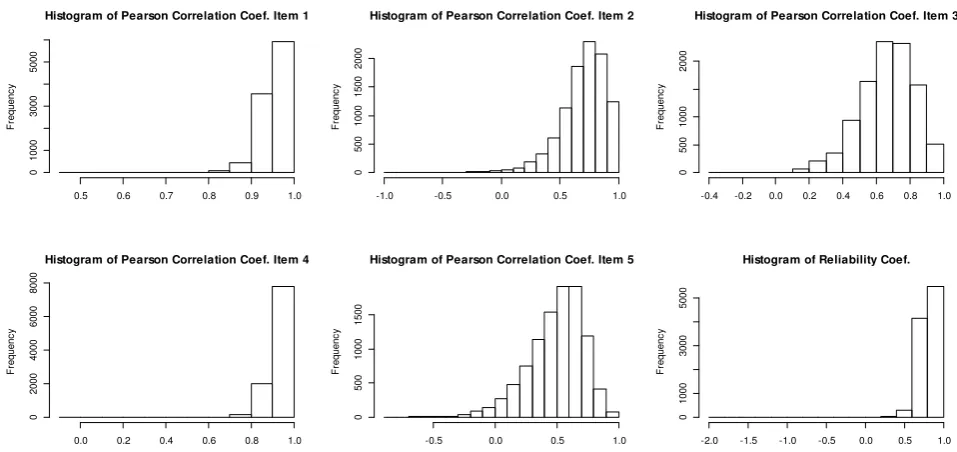
Suppose in Table 1, the sample of the 10 people { 1, 2, 3, 4, 5, 6, 7, 8, 9, 10 } are drawn with replacement such that a new sample size 10 will be obtained i.e. {3, 9, 1, 2, 8, 5, 3, 3, 4, 7 } and Table 2 as the result of replication. Based on Table 2, the coefficient of correlation can be found as follows 0.98, 0.65, 0.58, 0.96 and 0.60 and the reliability coefficient for the replication sample is 0.5857. If the procedure is repeated in a large number of times B then it is obtained a matrix which each column represents the values of the Pearson coefficient of correlation for each item with the total score. Figure 1 presents the coefficient of correlation for each item and reliability coefficient for replicated samples using the described procedure and B = 10,000. Point estimate of the correlation coefficient using the mean (or median) for each of
the items is 0.9504 (0.9560), 0.6856 (0.7157) 0.6598 (0.6771) 0.9263 (0.9363), 0.4897 (0.528) respectively. It is seen that the point estimate using the median tends to be closer to the actual Pearson coefficient of correlation. Furthermore, point estimation of the coefficient of reliability by using the mean (median) is 0.7868 (0.8066).
Table 2. The result of replication based on sample in Table 1.
Person 1 2 3 4 5 Total 3 4 4 3 3 2 16 9 5 3 4 4 3 19 1 5 5 4 3 2 19 2 2 2 3 1 2 10 8 4 1 3 4 5 17 5 5 5 3 5 4 22 3 4 4 3 3 2 16 3 4 4 3 3 2 16 4 2 2 2 1 2 9 7 1 2 3 1 1 8 Mean 3.6 3.2 3.1 2.8 2.5 Variance 1.8 1.8 0.3 1.8 1.3
The 95% percentile confidence interval for the Pearson coefficient of correlation coefficient for each item respectively (0.8971, 0.9871), (0.3153, 0.9369), (0.3634, 0.9048), (0.8434, 0.9842) and (0.0699,0.8038) while the 95% percentile confidence interval for the reliability coefficient is (0.6301, 0.8938). It is seen that the lower limit for the Pearson correlation coefficient 5 items tend to be close to 0 such that item 5 is almost invalid by using this method. These results are in line with the results, if we use the Pearson coefficient of correlation table at a significance level α = 5%. However, using the resampling technique, item 5 is still said to be valid.
Fig 1. Histogram of Pearson coefficient of correlation and reliability coefficient based on new sample by using resampling technique.
Histogram of Pearson Correlation Coef. Item 1
F re q u e n c y
0.5 0.6 0.7 0.8 0.9 1.0
0
1000
3000
5000
Histogram of Pearson Correlation Coef. Item 2
F re q u e n c y
-1.0 -0.5 0.0 0.5 1.0
0
500
1000
1500
2000
Histogram of Pearson Correlation Coef. Item 3
F re q u e n c y
-0.4 -0.2 0.0 0.2 0.4 0.6 0.8 1.0
0
500
1000
2000
Histogram of Pearson Correlation Coef. Item 4
F re q u e n c y
0.0 0.2 0.4 0.6 0.8 1.0
0
2000
4000
6000
8000
Histogram of Pearson Correlation Coef. Item 5
F re q u e n c y
-0.5 0.0 0.5 1.0
0
500
1000
1500
Histogram of Reliability Coef.
F re q u e n c y
-2.0 -1.5 -1.0 -0.5 0.0 0.5 1.0
0
1000
3000
Resampling technique without replacement can also be used to select items that provide reliability coefficients were different from previous reliability coefficient. If it is used 4 items from 5 items in the calculation of the reliability coefficient then there will be 5 possible combinations (i.e. combination of 4 items from 5 items). The order of the items does not give different result of reliability coefficient. That is only determined by the number of items and items which are used in the calculation. For example, if it is used a combination of items { 1, 2, 3, 4 }, { 1, 2, 3, 5}, { 1, 2, 4, 5 }, { 1, 3, 4, 5 } and { 2, 3, 4, 5 } then it is obtained reliability coefficient 0.8484, 0.6730, 0.8010, 0.8031 and 0.6545, respectively. In the same way, the values of the coefficient of reliability for the 3 items from 5 items available are 10 possible values i.e. 0.1694, 0.5747, 0.6067, 0.6130, 0.6926, 0.6947, 0.8040, 0.8195, 0.8283, 0.8626. Furthermore, the reliability coefficient can be determined theoretically for 2 items from 5 items available i.e. -0.3649, 0.0000, 0.4872, 0.5316, 0.5865, 0.6454, 0.6527, 0.8367, 0.8402, 0.8918. There is a negative reliability coefficient is -0.3649 which violates to the assumption that the coefficient of reliability should always lies between 0 and 1. It is obtained if there are only 2 items that are used in the calculation of the coefficient of reliability, i.e. item 2 and item 5 and that is caused by the Pearson coefficient of correlation between the two items is negative (big scores on items 2 tends to related to little score in the item 5 and vice versa) such that it results negative reliability coefficient.
The selection of items also remain to be based on the assumption that the selected items can still measure what is to be measured such that more or less items will also affect the reliability coefficient. Thus, it would be unreliable to use measuring devices with small number of items. The number of items that is used as measurement tool depends on the variable that will be measured.
If the number of items is large and the number of items used in the calculation of the reliability coefficient is relatively small, it is unreasonable to make all possible combinations. If the number of items that will be used in the calculation are known, the simulation method is one method that can be used to select items which will provide reliability coefficients that is near to maximum value. In this case it is used the terminology near to the maximum because there are possible combinations of items that cause maximum reliability coefficients and they are not drawn in the simulation.
Resampling technique without replacement technique can also be used in the selection of respondents that will be used in the calculation of statistics (Pearson coefficient of correlation or the reliability coefficient). Suppose in the example of Table 1 above, if all items are used in the calculation of the reliability coefficient but uses less than 10 respondents. By using respondents m = 9, 8, 7, 6, 5, 4 and 3 respectively, it would be obtained maximum reliability coefficient 0.8561, 0.8821, 0.9030, 0.9142, 0.9231, 0.9276 and 0.9449. That means, the number of respondents can be reduced to obtain higher reliability coefficient. In the same way, by using resampling techniques with replacement can also be used in the statistical calculations by using more than 10 respondents i.e. m = 20, 30, 50, 100, 500, 1000, 10000 respondents in order to obtain maximum reliability coefficient 0.9080, 0.8914, 0.8820, 0.8637, 0.8420, 0.8285, 0.8146 respectively. It is seen that the number of replication sample will tend to give lower reliability coefficient.
3.
RESEARCH METHODOLOGY
The data used is the data obtained from 48 respondents in the measurement scale consists of 40 items [9].
Case 1
Resampling technique with replacement is used for 48 respondents to find the Pearson coefficient of correlation by using all items. Because it is used the resampling technique with replacement, it is possible that respondents are drawn more than 1 time in a sample by using n = 48 respondents . In this case, it is limited to sample size equal to the number of respondents in the previous sample. If the procedure is repeated in a large number of times B it will be determined statistical point estimates for the Pearson correlation coefficient by using the mean or median values of Pearson correlation coefficients were formed. Percentile confidence interval using confidence coefficient ( 1 - α ) × 100% can also be determined based on the values of the Pearson correlation coefficient.
Resampling technique procedure in statistical calculation of the Pearson coefficient of correlation can be described as follows :
1. Suppose X1 , X2 , ... , Xm is n - variate sample with sample size m where m is the number of respondents and n is the number of items in the data.
2. A sample with sample size m is drawn by using resampling techniques with replacement to obtain a new sample X1*, X2 *, ... , Xm*.
3. Based on the new sample, the statistics is calculated Pearson correlation coefficients to obtain T1*, T2*, ... , Tn* for
each item that is the Pearson coefficient of correlation between the scores of each item and the total number of scores for each respondent (in this case there are m respondents).
4. If steps 1 through 3 were repeated in a large number of times B it is obtained the Pearson coefficient of correlation matrix as follows :
T11*, T21*, ... , Tn1*;
T12*, T22*, ... , Tn2*;
... T1B*, T2B*, ... , TnB*.
5. Distribution of the Pearson coefficient of correlation for each item (i.e. n items) can be determine based on statistical values in each column of the matrix in step 4. Point estimation of Pearson coefficient of correlation can be found by calculating the mean or median of each column of the matrix. Furthermore, ( 1 - α ) × 100 % percentile confidence interval can found based on ordered value of each column with order α/2 × 100 % × B (rounding value in nearest integer) for the lower limit and ( 1 - α / 2 ) × 100 % × B (rounding value in nearest integer) for the upper limit.
Case 2
Resampling technique without replacement is used for the 40 items that are available when is drawn k = 39, 38, 35, 30, 25, 20, 10 items from available items. By using items selected for each k items, the reliability coefficient was calculated and when the above procedure is repeated B = 1000, 10000, 50000 and 100000 times the reliability coefficient can then be determined maximum or near- maximum.
Resampling technique procedure in the calculation of the reliability coefficient can be explained as follows :
1. Suppose X1 , X2 , ... , Xk is m - variate sample with sample
2. A sample with sample size k is drawn by using resampling techniques with replacement to obtain a new sample X1*,
X2 *, ... , Xk*.
3. Based on the new sample statistics is calculated reliability coefficients to obtain T*.
4. If steps 1 through 3 were repeated in a large number of times B we will obtain a reliability coefficient vector as follows :
T1*, T2*, .... , TB*.
5. Distribution of reliability coefficient is the vector result in step 4. Furthermore, (1 - α) × 100 % percentile confidence interval of reliability coefficient can found based on ordered value of each column with order α/2 × 100 % × B (rounding value in nearest integer) for the lower limit and (1 - α/2) × 100 % × B (rounding value in nearest integer) for the upper limit.
Case 3
Resampling technique with replacement is used for 40 available items when k = 10, 20, 25, 30, 35, 38, 39, 40, 50, 60, 70, 80, 90, 100, 200 items are drawn. By using selected items for each k the reliability coefficient was calculated. Based on the table obtained in Case 2, it can be chosen which items resulting reliability coefficients more than its maximum value (in this case we only use 2 digits number after the decimal point). Resampling technique procedure used in this case is analogous to Case 2 but in this case it is used resampling technique with replacement.
Case 4
The procedure used in this case is analogous to Case 1. In case 1 it is used only 48 respondents in, if the respondents
used in the calculation of reliability coefficient is m < 48 it is used resampling technique without replacement, if, however, it is used respondents m > 48 then it is used resampling technique with replacement. The assumption used in this case that the items used in calculation are valid.
4.
RESULT AND DISCUSSION
Case 1
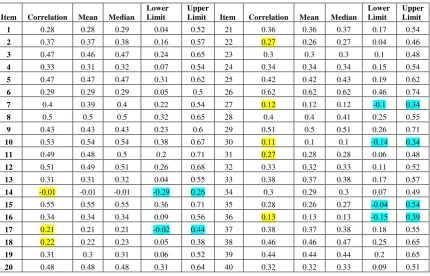
Table 3 presents the coefficient of correlation based on the real data for each item and the mean, median and lower limit and upper limit of the 95 % percentile confidence interval. We can see that the item is valid if the Pearson coefficient of correlation is larger than 0.28 [7]. Thus, item 14, 17, 18, 27, 30, 31 and 36 are not valid. By using a resampling technique can be concluded that the item be valid if the 95 % percentile confidence interval does not contain the point 0 such that items that are not valid by using this method are item 14, 17, 27, 30, 35 and 36. Most of the conclusions obtained are the same as the previous method except items 18, 31 and 35. Items 1 and 35 due to exact on the border. Items 18 and 31, however, have a lower limit that is very close to the point 0 i.e. 0.06. Probably, this is happened due to the value of B used in the procedure is not quite large.
If the valid items are used in the calculation then the reliability coefficient is 0.8358 (if , however, it is used all the items then the reliability coefficient is 0.8203). If it is only used the valid items in the calculation, the 95 % percentile confidence interval for the reliability coefficient is the items are discarded invalid (0.7407, 0.8869) whereas if it is used all the items are (0.7184, 0.8756).
Table 3. Table of Pearson coefficient of correlation based on the real data with mean, median, upper limit and lower limit of Pearson coefficient of correlation value by using resample technique.
Item Correlation Mean Median
Lower Limit
Upper
Limit Item Correlation Mean Median Lower Limit
Upper Limit
1 0.28 0.28 0.29 0.04 0.52 21 0.36 0.36 0.37 0.17 0.54
2 0.37 0.37 0.38 0.16 0.57 22 0.27 0.26 0.27 0.04 0.46
3 0.47 0.46 0.47 0.24 0.65 23 0.3 0.3 0.3 0.1 0.48
4 0.33 0.31 0.32 0.07 0.54 24 0.34 0.34 0.34 0.15 0.54
5 0.47 0.47 0.47 0.31 0.62 25 0.42 0.42 0.43 0.19 0.62
6 0.29 0.29 0.29 0.05 0.5 26 0.62 0.62 0.62 0.46 0.74
7 0.4 0.39 0.4 0.22 0.54 27 0.12 0.12 0.12 -0.1 0.34
8 0.5 0.5 0.5 0.32 0.65 28 0.4 0.4 0.41 0.25 0.55
9 0.43 0.43 0.43 0.23 0.6 29 0.51 0.5 0.51 0.26 0.71
10 0.53 0.54 0.54 0.38 0.67 30 0.11 0.1 0.1 -0.14 0.34
11 0.49 0.48 0.5 0.2 0.71 31 0.27 0.28 0.28 0.06 0.48
12 0.51 0.49 0.51 0.26 0.68 32 0.33 0.32 0.33 0.11 0.52
13 0.31 0.31 0.32 0.04 0.55 33 0.38 0.37 0.38 0.17 0.57
14 -0.01 -0.01 -0.01 -0.29 0.26 34 0.3 0.29 0.3 0.07 0.49
15 0.55 0.55 0.55 0.36 0.71 35 0.28 0.26 0.27 -0.04 0.54
16 0.34 0.34 0.34 0.09 0.56 36 0.13 0.13 0.13 -0.15 0.39
17 0.21 0.21 0.21 -0.02 0.44 37 0.38 0.37 0.38 0.18 0.55
18 0.22 0.22 0.23 0.05 0.38 38 0.46 0.46 0.47 0.25 0.65
19 0.31 0.3 0.31 0.06 0.52 39 0.44 0.44 0.44 0.2 0.65
20 0.48 0.48 0.48 0.31 0.64 40 0.32 0.32 0.33 0.09 0.51
Case 2
Based on available items it will be selected freely k items that vary from 2 to 39 items such that the measurement tool has reliability coefficient maximum or near to maximum. If
replications. However, if it is chosen k = 35 items in the calculation of the reliability coefficient then there will be 658,008 combinations of items such that there is no reason to use the number of replication B = 1000. If, however, it is chosen the number of replication B = 50,000, it will take a long time in the calculation. For the same reason, for moderate k between 2 and 39 items, it will be better chosen B around B = 50,000 or 100,000 such that the reliability coefficient chosen close to the actual maximum value.
Case 3
When 10 items is drawn, it will be found the maximum reliability coefficient close to 0.8528 with the selected items are {7, 7, 7, 9, 13, 17, 20, 20, 31, 31}. In the same way it can be taken as k = 20, 25, 30, 35, 40, 50, 60, 70, 100, 200, 500, 1000 and 10,000 such that it is obtained reliability coefficients 0.8800, 0.8956, 0.9013, 0.9104 , 0.9221, 0.9333, 0.9454, 0.9534, 0.9713, 0.9931, 0.9993 respectively. It is seen that the more the sample size used it will tend to the greater maximum reliability coefficient can be obtained.
Case 4
In this case the procedure is analogous to Case 1. In this case, however, it is used less than 48 or more than 48 respondents. If it is used respondents m = 10, 20, 25, 30, 35, 40, 45, 46, 47 in the calculation of the reliability coefficient and without invalid items ( { 14 , 17, 18, 22, 27, 30, 31, 36 } ) then we can obtain the maximum reliability coefficient 0.9521, 0.9147, 0.9021, 0.8965, 0.8856, 0.8540 and 0.8436 respectively. We see that the reliability coefficient tends to decrease if the number of used respondent m increases. If it is used m = 50, 100, 500, 1000 and 10,000 respondents in the calculation of reliability coefficient and without invalid items { 14, 17, 18, 22, 27, 30, 31, 36 } then it is obtained maximum reliability coefficient 0.9116, 0.8970, 0.8696, 0.8625 and 0.8450. It is seen that the increasing of the number of replication items m tends to decrease the reliability coefficient.
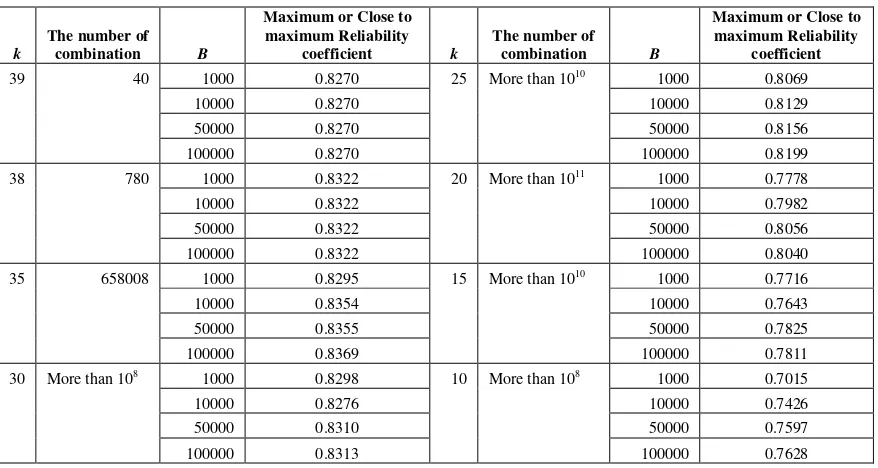
Table 4. Maximum value or close to maximum value of reliability coefficient given the number of items k that is used in the calculation of reliability coefficient and the number of replication B.
k
The number of combination B
Maximum or Close to maximum Reliability
coefficient k
The number of combination B
Maximum or Close to maximum Reliability
coefficient
39 40 1000 0.8270 25 More than 1010 1000 0.8069
10000 0.8270 10000 0.8129
50000 0.8270 50000 0.8156
100000 0.8270 100000 0.8199
38 780 1000 0.8322 20 More than 1011 1000 0.7778
10000 0.8322 10000 0.7982
50000 0.8322 50000 0.8056
100000 0.8322 100000 0.8040
35 658008 1000 0.8295 15 More than 1010 1000 0.7716
10000 0.8354 10000 0.7643
50000 0.8355 50000 0.7825
100000 0.8369 100000 0.7811
30 More than 108 1000 0.8298 10 More than 108 1000 0.7015
10000 0.8276 10000 0.7426
50000 0.8310 50000 0.7597
100000 0.8313 100000 0.7628
5.
CONCLUSION
In this paper it is described how to use a resampling technique with or without replacement in the validity and reliability testing. Resampling technique can be used to determine whether the item is valid or not by using the percentile confidence interval that is depend on the sample size. The same technique can also be used to determine whether reliability coefficients is significant or not. This technique can
also be used to obtain higher reliability coefficient by reducing the sample size or by reducing the number of items used in the calculation. The research can be done also by using other statistic to test the reliability coefficient of measurement toll such as KR-20, KR-21, Spearman-Brown etc. Instead of Pearson coefficient of correlation, it can be used Spearman correlation or Kendall correlation in validity testing.
6.
REFERENCES
[1] Sugiyono, 2012, Metode Penelitian Kuantitatif dan Kualitatif, R & D. Bandung, ALFABETA.
[2] Sudijono, A., 2007, Pengantar Evaluasi Pendidikan. Jakarta: PT. King Grafindo Persada.
[3] Berkowitz, D. & Caner, M. & Fang, Y., 2012. "The validity of instruments revisited," Journal of Econometrics, Elsevier, vol. 166 (2), pages 255-266.
[4] Setiawan, A. , 2012, Resampling Based on Bivariate Kernel Density Estimation, Proceedings of the National Seminar on Mathematics Unnes October 13, 2012. [5] Huo, Ming, Heyvaert, Mieke; Van den Noortgate, Wim;
[6] Croker, L & J. Algina, 2008, Introduction to Classical and Modern Test Theory, Cengage Learning, Mason Ohio.
[7] Crawshaw, J. & J. Chambers, 2001, A Concise Course in Advanced Level Statistics 4th Ed., Publisher: Nelson Thornes Ltd, Delta Place.
[8] De Guijter, D. N., M. & L. J. Th. van der Kamp, 2008, Statistical Test Theory for the Behavioral Sciences, Chapman & Hall/CRC, Boca Raton.