M – 31
CLUSTERING DISTRICTS BASED ON INFLUENCED FACTORS OF CHILD
UNDERNUTRITION (STUNTING)
Nurul Istiqomah*, Hari Wijayanto2, Farit M. Afendi3 Department of Statistics, Institut Pertanian Bogor *Correspondence to: [email protected]
Abstract
One indicator of undernutrition problems is stunting. In Indonesia, the prevalence of stunting of under 5 years children has increased from 35.6% (2010) to 37.2% (2013) and there are differences among provinces. These disparities are likely to be greater when the level is seen in smaller areas such as inter regencies/cities. The purpose of this study. is to group the regencies/cities based on stunting factors. cluster is 2, with cluster quality is fair. The first clusters consist of 223 counties and cities, while the second comprises 272 ones. In addition, there are two outliers, District Ndunga and District Lanny Jaya located in the Province of Papua. The first cluster has average value greater than the national average in the socioeconomics and child diet, in the other hand, the second cluster has average value greater than the national average in mother enviromental and health care, and the outliers has an average above the national average for all variables except on expenditure per capita, the average member of the household, and calorie consumption.
Keywords: clustering, malnutrition, stunting, two step cluster method
INTRODUCTION Background
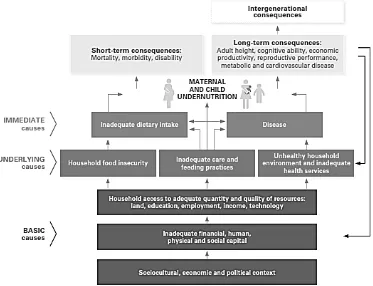
Undernutrition causes some consequences, both short term and long term. In the short term, undernutrition will cause mortality, morbidity and disability. For the long term, it will impact on adult height, cognitive ability, economic productivity, reproductive performance, metabolic and cardiovascular diseases (Unicef, 2013). One measure of undernutrition is stunting. Stunting reflects chronic undernutrition during the most critical periods of growth and development in early life.
Globally, more than one quarter (26 per cent) of children under 5 years were stunted in 2011. But this burden is not evenly distributed around the world. Sub-Saharan Africa and South Asia are home for three fourth of the world’s stunted children. In sub-Saharan Africa, 40 per cent of children under 5 years are stunted; in South Asia, 39 per cent are stunted. In 2011, Indonesia was home to 5 percent of stunted children (Unicef, 2013).
In Indonesia, the prevalence of stunting has increased from 35.6% (2010) to 37.2% (2013) and there are differences between provinces (Kemenkes, 2014). The lowest three stunting prevalence were in Riau Island (26.3%), DI Yogyakarta (27.3%), and Jakarta (27.5%), while the highest were in NTT (51.7%), West Sulawesi (48.0%), and NTB (45.2%).
Based on the stratification, the province in the same strata would apply the same policy without looking at the factors that influence it. Programs to reduce the prevalence of stunting may be more effective if regions are grouped based on similarity of characteristics (factors that affect stunting of children under 5 years).
Formulation of The Problem
The UNICEF conceptual framework defines nutrition and captures the multifactorial causality of undernutrition (Unicef, 1990). Nutritional status is influenced by three broad factors: food, health and care. Optimal nutritional status results when children have access to affordable, diverse nutrient-rich food; appropriate maternal and child care-practices; adequate health services; and a healthy environment including safe water, sanitation and good hygiene practices. These factors directly influence nutrient intake and the presence of disease.
Figure 1. Conceptual Framework Of The Determinants Of Child Undernutrition
Some studies related with risk factors of stunting of children under 5 years has been done in Indonesia both in small and large scale. Sabaruddin (2012) stated that the factors that significantly affect the nutritional status of children under TB / U in Bogor were maternal education, medical history of the child and maternal employment status. The large scale research usually use national data such as survey “Riset Kesehatan Dasar” by the Ministry of Health and other macro data. Aditianti (2010) stated that the significant factors of stunting (p<0,05) were father’s height, mother’s height, age, gender, neighborhood, social and economic status, mother’s education, infectious diseases, personal hygiene, and environmental sanitation. Hayati (2013) showed that the highest risk of stunting found in children 0-23 months who were born with low birth weight, underweight, mothers short (145 cm), low family economic status, the density of protein intake less than 20g / 1000 kcal.
lacteals.Yuliana (2015) stated that the factors determined stunting prevalence disparity are incomplete immunization percentage, malaria prevalence, single mothers percentage, poverty level and Human Development Index. However, grouping regions based on the similarity characteristics of the prevalence of stunting factor has never been done before. Under previous studies, this study seeks to group area (district / city) in Indonesia based on the factors of the prevalence of stunting.
Factors that affect prevalence of stunting has numerical and categorical measurement scale. Two Step Cluster is a common method used in involving variables with mixed measurement scale as well as large amounts of data. This method also assumes independent variables involved (Anonimous, 2001).
Goal And Benefit Of The Research Project
Clustering districts / cities in Indonesia by using TwoStep Cluster in order to obtain the district / city with the same characteristics. The clustering results can be used in determining policy to decrease the prevalence of stunting of children under 5 years.
RESEARCH METHOD
Material / Subject
The data used in this research is secondary data : the data of Health Research (Riskesdas) and Basic Health Center 2013 data from the Ministry of Health and the National Socioeconomic Survey 2013 conducted by the BPS. The unit of analysis in this study are 497 districts / cities throughout Indonesia in 2013.The variables used in this research can be seen in the table below.
Variable(s)
1 Calorie Consumption
2 Longer Breastfeeding
3 Number of Complaints of Diarrhea
4 Per Capita Expenditure
5 The Percentage of Working Mothers
6 Percentage of Educated Mothers <High School
7 The Average Number of Family Members
8 Percentage of Households With Sanitation Is Not Feasible
9 Percentage of Households With Clean Water Source Is Not Feasible
10 The Adequacy of Physician
11 The Adequacy of Health Centers
12 The adequacy of Nutritionists
Inadequate dietary intake
Disease
Household food insecurity
adequate health services Unheal thy househol d envi r onment Inadequate care and feeding practices
Two_Step Cluster
Two step cluster method is a method that is designed to handle a large number of objects, especially on objects that have the problem of continuous and categorical variables, assuming variables involved independent. Clustering procedure with two-step cluster method has two phases namely preclustering stage, final stage (Anonimous, 2001).
The initial phase is done with the sequential approach, is the observed objects one by one based on distance measure is then determined whether the object is included in the clusters that have formed or to be formed new clusters. In this step is implemented with the formation of the cluster features (CF) Tree. Procedures CF Tree is done by selecting a random initial observation that the distance will be measured individually with other observations using a predetermined distance measure. If the magnitude of the distance lies in the reception area (threshold distance), the observations will be a member of the subclusters. If the magnitude of the distance lies outside the reception area, the observations will be entered into clusters that have been established or will be the forerunner of a new leaf entry (Şchiopu, 2010).
In the second step, the results of CF Tree clustered with hierarchical clusters analysis with agglomerative method, is starting with n clusters, each consisting of a single object, then the two closest clusters are merged and re-established a new closeness between clusters. To calculate the number of clusters can be done in two ways, the first count schwarz's Bayesian criterion (BIC) or the Akaike's Information criterion (AIC) for each cluster (Şchiopu, 2010).
Cluster best solution if it has the smallest BIC, but in some cases there is value BIC increased if the number of clusters increases. If there are such cases it is necessary to identify the best solution clusters by BIC change ratio and the ratio of the distance amendment.
( ) = −2 − 1 the estimated variance (dispersion) of the continuous variable k
the estimated variance (dispersion) of the continuous variable k in cluster j the total number of continuous variables
total number of categorical variables
the number of categories for the k-th categorical variable
( ) = ; = −
( ) ≥1.15 →opt imutclust er
lv = (2mvlog n – AICv)/2 dk-1 = distance if k clusters combined with k-1 clusters RESULT
Based on BIC values, it can be concluded that the optimal number of clusters is 2, with cluster quality is fair. The first cluster consist of 223 regions, while the second comprises 272 ones. In addition, there are two outliers, District Ndunga and District Lanny Jaya located in the Province of Papua.
DISCUSSION
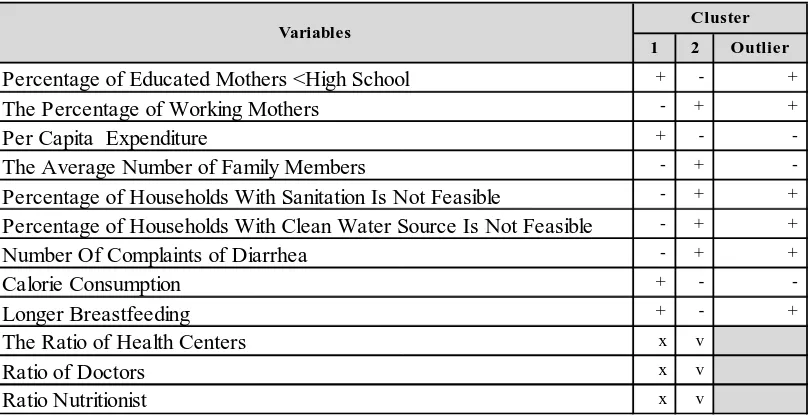
The next step is to calculate the average of numerical variables for observation as a whole and of each group. clusters with average above the overall score are marked (+), while clusters with average below the overall score are marked (-). Cluster 1 is a cluster with (+) in the percentage of educated mothers < high school, per capita expenditure, the number of complaints of diarrhea and the average length of breastfeeding, and (-) at the percentage of working mothers, the average member of the household, the percentage of households with sanitation and clean water source is not feasible, as well as the number of complaints of diarrhea. Meanwhile, cluster 2 is a cluster with (+) at the percentage of working mothers, the average member of the household, the percentage of households with sanitation and clean water source is not feasible, and the number of complaints of diarrhea and (-) at the variable percentage of educated mothers <high school, per capita expenditure, the number of complaints of diarrhea and the average length of breastfeeding. Outlier has an average above the national average for all variables except on expenditure per capita, the average member of the household and calorie consumption.
Based on the characteristics of categorical variables (health centers ratio, the ratio of doctors, nutritionists ratio), it can be said that health care in the first cluster is still need more attention than in cluster 2.
CONCLUSION AND SUGGESTION
From this research on clustering districts / cities in Indonesia by using TwoStep Cluster based on influenced factor of the prevalence of stunting of under 5 years children, it can be concluded and recommended some point as follows:
1. Based on BIC values, it can be concluded optimal clusters number is 2. The first clusters consisting of 223, while the second comprises 272 counties and cities. in addition, there were two outliers, District Ndunga and District Lanny Jaya located in the Province of Papua.
1 2 Outlier
Percentage of Educated Mothers <High School + - +
The Percentage of Working Mothers - + +
Per Capita Expenditure + -
-The Average Number of Family Members - +
-Percentage of Households With Sanitation Is Not Feasible - + +
Percentage of Households With Clean Water Source Is Not Feasible - + +
Number Of Complaints of Diarrhea - + +
-2. To decrease the prevalence of stunting of under 5 years children in cluster 1, socioeconomic factors and child diet must be improved. In cluster 2, mother enviromental and health care are still need attention.
3. Two Step Cluster assuming variables involved are independent. In fact, there are correlation among varibles, so it is necessary to cluster districts / cities in Indonesia using a method that explore correlation between variables.
References
Aditianti. (2010). Faktor Determinan “Stunting” Pada Anak Usia 24 – 59 Bulan Di Indonesia. Institut Pertanian Bogor, Bogor.
Anonimous. (2001). The SPSS TwoStep Cluster Component. A Scalable Component to Segment Your Costumers More Effectifely. White paper-technical report, : SPSS Inc Chicago. Bappenas. (2011). Rencana Aksi Nasional Pangan dan Gizi 2011-2015.
Hayati, A. W. (2013). Faktor-Faktor Risiko Stunting, Pola Konsumsi Pangan, Asupan Energi Dan Zat Gizi Anak 0-23 Bulan. Institut Pertanian Bogor, Bogor.
Kemenkes. (2014). Profil Kesehatan Indonesia (Vol. 2015).
Nadiyah. (2013). Faktor Risiko Stunting Pada Anak Usia 0-23 Bulan Di Provinsi Bali, Jawa Barat Dan Nusa Tenggara Timur. Institut Pertanian Bogor, Bogor.
Sabaruddin, E. E. (2012). Kajian Positive Deviance Masalah Stunting Balita pada Keluarga Miskin di Kota Bogor. Institut Pertanian Bogor, Bogor.
Şchiopu, D. (2010). Applying TwoStep Cluster Analysis for Identifying Bank Customers’ Profile. BULETINUL Universităţii Petrol – Gaze din Ploieşti, 53(3)(Seria Ştiinţe Economice), 66 - 75.
Unicef. (1990). Strategy For Improved Nutrition Of Children And Women In Developing Countries. New York.
Unicef. (2013). Improving Child Nutrition The Achievable Imperative For Global Progress. New York: United Nation.