Volume 101 | Issue 1
Article 2
Winter 2011
Class Matters
Erica J. Hashimoto
Follow this and additional works at:
http://scholarlycommons.law.northwestern.edu/jclc
Part of the
Criminal Law Commons
This Criminal Law is brought to you for free and open access by Northwestern University School of Law Scholarly Commons. It has been accepted for inclusion in Journal of Criminal Law and Criminology by an authorized administrator of Northwestern University School of Law Scholarly Commons.
Recommended Citation
31
CLASS MATTERS
ERICA J. HASHIMOTO
∗Poor people constitute one of the most overrepresented categories of people in the criminal justice system. Why is that so? Unfortunately, we simply do not know, in large part because we have virtually no information that could provide an answer. As a result of that informational vacuum, policymakers either have ignored issues related to economic class, instead focusing on issues like drug addiction and mental illness as to which there are more data, or have developed fragmented policies that touch on economic status issues only tangentially. The bottom line is that without better data on the profile of poor defendants, coherent policy to address issues related to economic status simply will not be enacted. Because we lack data on economic status, we also cannot ascertain whether the system enforces criminal laws equally or whether it targets poor people. The inability to prove (or disprove) class discrimination prevents policymakers from enacting any solutions and leads to mistrust in the system.
This Article highlights the potential beneficial uses of general data on criminal defendants and data on economic status of criminal defendants in particular. It goes on to document the data we currently have on income levels of criminal defendants, and the shortcomings both in our analysis of that data and in our data collection. Finally, the Article provides a roadmap for how states and the federal government should collect and analyze data on the economic status of criminal defendants.
I.INTRODUCTION
The United States spends nearly two hundred billion dollars each year to combat crime.1
∗Associate Professor, University of Georgia School of Law. I appreciate the very
helpful comments of my colleagues Dan Coenen, Lori Ringhand, and Andrea Dennis. All errors, of course, are my own.
Both because of the amount of money involved and
1
See KRISTEN A. HUGHES, BUREAU OF JUSTICE STATISTICS BULLETIN: JUSTICE
EXPENDITURE AND EMPLOYMENT IN THE UNITED STATES, 2003, at 1 (2006), available at
because of the importance of this issue, policymakers should rest their decisions on accurate data so that there is some assurance that the vast criminal justice budget is being effectively spent. In too many instances, however, legislators develop policy and laws with little or no information. Part of the reason that policymakers do not consider data may be that data are unavailable. In particular, demographic information on defendants in the system (with the possible exception of information regarding race and gender) is almost nonexistent. Indeed, one of the most potentially significant factors—the economic status of the defendant—has been almost completely ignored.
The data we do have show that poor people become defendants in criminal cases at a much higher rate than do non-poor people. Without collecting more data on those defendants—their criminal histories, the crimes with which they are charged, the outcomes of their cases, their sentences, and the extent of their overrepresentation in the system—we can neither generate interest from policymakers in the problems presented by the sheer volume of poor people in the system nor begin to identify causes and solutions for this overrepresentation.
Some might argue that collecting more data is not necessary because everyone knows that the criminal justice system prosecutes more indigent than non-indigent persons. Without data, however, we do not, and cannot, know the extent of this disparity and the issue lacks resonance. In this context, data represent the most powerful, descriptive tool. In addition, without data, we cannot determine the causes of overrepresentation, so we cannot develop effective solutions. A very simple (and admittedly over-simplified) example makes the point. If, for instance, the data reveal that poor defendants commit all types of offenses at a uniformly higher rate than non-poor defendants, that information may suggest that poor defendants commit crimes for reasons other than economic need. If that is the case, any programs targeted at reducing offense rates of poor people need to recognize that the motivation for the criminal behavior may not be economic need and may need to incorporate a model of promoting not only job placement but also community investment and engagement.2
In addition to its importance in developing rational criminal justice policy, information collection plays a critical role in ensuring even-handed
On the other hand, if the differential in offense rates between poor and non-poor defendants does vary depending on the economic nature of the crime, the message may be that job programs constitute the best tool for countering criminal activity.
2As discussed below, a therapeutic jurisprudence program might be warranted in such a
administration of our laws. Again, an example illustrates the point. If the percentage of poor people who are prosecuted for a particular crime—for instance, drug possession3—is much greater than the percentage of poor people who commit the offense, this fact may lead to questions about our enforcement efforts. Do police target poor people or neighborhoods where poor people live? Are prosecutors more likely to charge poor people for drug offenses than wealthy people? The answers to these questions may well be no, but we cannot know if that is the case unless we collect data.4
The Article proceeds in three parts. Citing examples, Part II describes the benefits of collecting and analyzing data on defendants in the criminal justice system—namely, that data further the development of more rational criminal justice policy and provide a means of assuring equal enforcement of the laws. Part III describes the data on economic status that states and the federal government now collect and the deficiencies in the available data. It also sets forth the argument that analysis of these data is necessary both to develop effective criminal justice policy and to ensure that the law does not discriminate against poor people. Finally, Part IV proposes new methods of analysis for the existing data and advocates the collection of more detailed data, particularly at the state level.
II.THE IMPORTANCE OF KEEPING DATA ON CRIMINAL DEFENDANTS
There are two principal reasons we should collect data about defendants in the criminal justice system. First, data should (although they often do not) inform policy decisions regarding the definitions of crimes, the development of programs, and the enactment of sentencing provisions. After all, regardless of the goals policymakers have for the criminal justice system—whether crime prevention or retribution or both—they need information in order to assess whether the money is being spent in the most cost-effective way to further those goals. If we do not know who is being prosecuted for crimes, legislators and those working in the criminal justice system cannot make informed decisions. Second, we cannot have any assurance that laws are being enforced uniformly—and not on the basis of unconstitutional or arbitrary factors such as race or gender—unless we know who is being prosecuted, convicted and punished, and for what.
3I use drug possession for this example because we have fairly detailed statistics on the
demographic profile of drug users. See infra Part III.B.
4As discussed below, I recognize that even if the data established unequal enforcement,
there may not be a legal remedy for that inequality. Even without a constitutional remedy, however, those data still could lead to changes in the enforcement mechanisms. See infra
A. DATA AS A MEANS OF ACHIEVING RATIONAL CRIMINAL JUSTICE POLICY
Over the last twenty or thirty years, political considerations generated by highly publicized cases have significantly affected criminal justice policy.5 Indeed, many pieces of legislation creating new crimes and setting sentences both for new crimes and for existing crimes have been driven by media coverage of the most high profile cases. Political considerations generated by media coverage of atypical high-profile cases, however, provide a poor basis for shaping the criminal justice system. To illustrate the importance of considering data rather than passing legislation based on media frenzy, consider Congress’s enactment of legislation that created the one-hundred-to-one sentencing differential for powder cocaine and crack cocaine offenses under the federal Anti-Drug Abuse Act of 1986.6 The Act set mandatory minimum penalties for defendants convicted of trafficking “kingpin” quantities of drugs: one thousand grams of heroin or five thousand grams of cocaine powder would lead to a ten year mandatory minimum sentence.7 With respect to crack cocaine,8 Congress established the “kingpin” level for the mandatory minimum ten-year sentence at fifty grams, one-hundredth of the amount that would trigger the same mandatory minimum penalty for powder cocaine.9
5See,e.g., B
UREAU OF JUSTICE ASSISTANCE,U.S.DEP’T OF JUSTICE,APOLICYMAKER’S
GUIDE TO HATE CRIMES 5 (1997) (“In the area of criminal justice, it is political reality that
public policy sometimes is driven more by emotions and perceptions—sometimes misperceptions—than hard empirical data.”); Stephanos Bibas, Transparency and Participation in Criminal Procedure, 81 N.Y.U.L.REV. 911, 925–26 (2006) (noting that the public’s view of the criminal justice system is formed on the basis of sensational news accounts of atypical cases); Darryl K. Brown, Cost-Benefit Analysis in Criminal Law, 92 CALIF.L.REV. 323, 330 (2004) (“American legislators are particularly responsive to public concerns about crime . . . . The political responsiveness of American criminal justice makes the input of expertise from social scientists, Sentencing Commission staff, and other academics or policy analysts less influential.”); Steven L. Chanenson, Sentencing and Data: The Not-So-Odd Couple, 16 FED. SENT’G REP. 1, 1 (2003) (“On the legislative level, Congress is infamous for taking dramatic actions concerning sentencing on the spur of the moment based more on incendiary rhetoric than reason.”) (footnote omitted); William J. Stuntz, Plea Bargaining and Criminal Law’s Disappearing Shadow, 117 HARV. L. REV. 2548, 2558 (2004) (“Every generation has its high-profile crime stories and media frenzies, which leave behind a trail of new criminal prohibitions.”).
6Anti-Drug Abuse Act of 1986, Pub. L. No. 99-570, 100 Stat. 3207. 7
See David A. Sklansky, Cocaine, Race, and Equal Protection, 47 STAN.L.REV. 1283, 1287 (1995).
8Crack cocaine is made by boiling powder cocaine (cocaine hydrochloride) with baking
soda. Crack generally is smoked, while powder is sniffed. Id. at 1290–91.
9
Much has been written about the reasons Congress settled on the 100:1 ratio for powder and crack cocaine.10 From those reports, it is clear that Congress set that ratio without considering any data on either the relative harmfulness of the drugs at issue11 or the amounts of these drugs that “kingpins” ordinarily would traffic.12 The Act itself was passed in record time,13 without committee hearings to debate the issues in the bill.14 Instead of focusing on the science of crack cocaine and data on its usage, debate centered on congressional concerns about the “crack epidemic” in urban areas that had been the subject of numerous media stories,15 including a high-profile Newsweek article.16 Much attention also focused on the recent death of basketball star Len Bias, a University of Maryland standout who died of a cocaine overdose the night after he was drafted by the Boston Celtics.17
10 See, e.g., Marc Mauer, Racial Impact Statements as a Means of Reducing
Unwarranted Sentencing Disparities, 5 OHIO ST.J.CRIM.L. 19, 20–21 (2007); Sklansky, supra note 7, at 1290–97.
11 See Eric E. Sterling, The Sentencing Boomerang: Drug Prohibition Politics and
Reform, 40 VILL.L.REV. 383, 409 (1995) (noting that the Subcommittee on Crime “did not determine the relative harmfulness of different drugs”).
12 As Professor Sklansky observes, there really is no such thing as a “kingpin” crack
trafficker because “[a]s Congress appears to have recognized, large-volume drug traffickers generally do not deal in crack; they deal in its precursor, powder cocaine. Defendants caught trafficking in crack thus are almost always the street-level retailers of the cocaine trade, not the wholesalers.” Sklansky, supra note 7, at 1288 (citation omitted).
13
See U.S. SENTENCING COMM’N, REPORT TO CONGRESS: COCAINE AND FEDERAL
SENTENCING POLICY 117 (1995), available at http://www.ussc.gov/Legislative_and_ Public_Affairs/Congressional_Testimony_and_Reports/Drug_Topics/199502_RtC_Cocaine _Sentencing_Policy/chap5-8.pdf [hereinafter USSC REPORT] (“Apparently because of the heightened concern [over crack], Congress dispensed with much of the typical deliberative legislative process, including committee hearings.”).
14 See Sterling, supra note 11, at 408–09 (noting that the House Judiciary Subcommittee
on Crime completed all of its work on the bill in just five weeks, and that much of the usual procedure was “circumvented” for this bill).
15
See USSCREPORT,supra note 13, at 122(“Some assertions made in these [media] reports were not supported by data at the time and in retrospect were simply incorrect. One report in 1986, for example, labeled crack cocaine as ‘America’s drug of choice.’ . . . The first statistics on crack cocaine use compiled by NIDA subsequent to the report showed that snorting powder cocaine was still the preferred method of ingestion by 95 percent of cocaine users.”) (internal citations omitted).
16
See Sklansky, supra note 7, at 1294.
17 See,e.g., USSCR
Congress’s failure to consider any scientific or usage data before passing the Anti-Drug Abuse Act of 1986, and in particular before adopting the 100:1 ratio, has had negative consequences for federal drug policy. First, the Act has been used primarily to prosecute minor street-level retail sellers of crack cocaine, rather than wholesale sellers of drugs, completely undermining the purpose of the Act.18 To put it another way, the resources that Congress intended to allocate to combat large-scale drug traffickers instead were diverted to prosecuting and incarcerating street-level dealers. Second, as discussed below, the focus on prosecuting street-level retailers of crack cocaine, combined with the severe penalties for those convicted under the Act, has led to the mass incarceration of young, African-American men.19
The history of the Anti-Drug Abuse Act of 1986 illustrates the dangers of making criminal law policy in the absence of sound data. Fortunately, there are also numerous examples of legislators and policymakers collecting and using data to develop criminal justice policy. Sentencing guidelines legislation provides one example,20
1. Sentencing Guidelines
and the developments of drug courts and of mental health courts provide two more. The data used in formulating these programs are far from perfect and certainly have been subject to criticism. Nonetheless, these reforms demonstrate the benefits both of considering data in the development of criminal justice policy and of creating mechanisms to collect data in order to assess the effectiveness of those policies over time.
Through the late 1970s and 1980s, a number of states developed sentencing guidelines that were designed to curb sentencing discretion of judges. Although the development of guidelines varied across jurisdictions, data played a critical role both in the initial creation of guidelines systems and in monitoring their impact. Concerns about lack of sentencing uniformity and problems with prison overcrowding spurred sentencing
18 See USSCREPORT, supra note 13, at 158 (reporting that 59.6% of crack cocaine
defendants in federal prisons were street-level retailers).
19
See infra Part II.B.
20 See,e.g., Chanenson, supra note 5, at 12 (“[T]he necessity of sentencing data should
reform.21 Believing that finding solutions to both of these problems required collection and consideration of information related to sentencing practices, drafters of guidelines in at least some states used data to set initial guidelines ranges. Perhaps more importantly, sentencing commissions collected extensive data on the implementation of the guidelines in order to ensure that they were meeting their statutory goals.22
Minnesota, the first state to develop sentencing guidelines, provides a telling example. In 1978, the state legislature established the Minnesota Sentencing Guidelines Commission and directed the commission to develop sentencing guidelines.23 The legislature instructed the commission, when developing and amending the guidelines, to consider “capacity constraint”—the relationship between the severity of prison sentences and the space available to house prisoners—among other factors.24 Focusing on the capacity constraint goal, the commission developed a detailed computer model to project expected prison populations that would result from different variations of proposed guidelines.25 The commission also began collecting data almost immediately after its formation and has continued to collect data on sentencing in Minnesota ever since.26 Relying on this information, Minnesota authorities have crafted changes to the guidelines over time, including amendments that reduced the durations of prison sentences for some offenses because the data showed that Minnesota was approaching its prison capacity.27
The data collected by the commission, along with the legislature’s directives concerning relevant factors for sentencing, have resulted in a much more coherent overall sentencing policy than had previously existed.28
21 See,e.g., Richard S. Frase, Sentencing Guidelines in Minnesota, 1978–2003, 32 C RIME
&JUST. 131, 132 (2005) (noting Minnesota’s legislative goals of reducing “disparity in the treatment of similarly situated offenders” and “coordinat[ing] sentencing policy with available correctional resources, especially prison and jail capacities”).
In particular, because of the commission’s focus on considering
22 See Chanenson, supra note 5, at 1 (“Legislatures and sentencing commissions can and
do use data to craft and improve sentencing policy on a systemic level.”).
23 See DALE G. PARENT, STRUCTURING CRIMINAL SENTENCES: THE EVOLUTION OF
MINNESOTA’S SENTENCING GUIDELINES 28 (1988).
24
Id. at 51.
25 See Frase, supra note 21, at 147.
26 See Richard S. Frase, Implementing Commission-Based Sentencing Guidelines: The
Lessons of the First Ten Years in Minnesota, 2 CORNELL J.L.&PUB.POL’Y 279, 279 n.2 (1992) (observing that the Minnesota commission has “routinely collected a large amount of data on all felony sentences” giving rise to a “rich source of data and commentary”).
27
See id. at 286.
28 Minnesota’s policy decisions have been the subject of at least some criticism, but
capacity constraints in developing and modifying the guidelines, Minnesota, at least through the 1980s, managed to reserve its prison space for the most serious offenders thereby avoiding the prison overcrowding problems that plagued the rest of the country.29 In 1979, the nationwide incarceration rate for state prisoners was 126 per 100,000 people.30 By 1990, the nationwide rate had more than doubled to 272 per 100,000 people,31 and prison systems throughout the country were struggling with prison overcrowding issues. In large part because of the effect of the guidelines, the incarceration rate in Minnesota during that same period did not rise nearly as significantly. In 1979, the year before the Minnesota guidelines went into effect, the incarceration rate in Minnesota was 51 per 100,000 people, and by 1990, it had risen only to 72 per 100,000 people.32
Since 1990, incarceration rates in Minnesota have increased much more significantly, but primarily as a result of factors beyond the commission’s control. Two factors have radically affected incarceration rates in Minnesota.
Perhaps most importantly, because Minnesota had carefully considered how the limited prison resources should be allocated, it did not run out of space as other state prison systems did.
33
First, the number of defendants prosecuted and sentenced has increased significantly, at least in part due to the increased number of defendants sentenced for drug crimes.34 Second, the Minnesota legislature, like Congress and state legislatures across the country, has increased the number of crimes that carry with them mandatory minimum sentences.35
29
See Frase, supra note
Thus, as one commentator notes, although sentencing policy “under the guidelines has become much more data driven, comprehensive, and consistent . . . it has only been partially insulated from political
26, at 334 (concluding that because of the sentencing guidelines, Minnesota through the 1980s “manag[ed] to avoid the serious problems of prison and jail overcrowding (and court intervention) which have become the norm in most states”).
30 See P
AIGE M. HARRISON, BUREAU OF JUSTICE STATISTICS, U.S. DEP’T OF JUSTICE, INCARCERATION RATES FOR PRISONERS UNDER STATE OR FEDERAL JURISDICTION, PER 100,000 RESIDENTS (2000), available at http://bjs.ojp.usdoj.gov/index.cfm?ty=pbdetail&iid=2040.
31 Id. 32 Id.
33 The Minnesota guidelines, like the sentencing guidelines in many states, also have
been affected by the Supreme Court’s decision in Blakely v. Washington, 542 U.S. 296 (2003), holding that Washington’s sentencing guideline system was unconstitutional because it required the court to sentence the defendant for conduct not proven to a jury. The effects of Blakely on incarceration rates, however, are not yet clear.
34
See Frase, supra note 21, at 136 (noting that in the period from 1981 through 2002, the total number of felons sentenced for drug crimes per year more than quadrupled, resulting in a doubling of the total number of felons sentenced per year).
35
pressure.”36
2. Drug Courts
Data have not completed solved the problem of politics and sentencing policy in Minnesota, but the experience with the guidelines suggests that data in the hands of policymakers—here the sentencing commission—can lead to much more coherent and effective criminal justice policy.
Another example of the use of data to influence criminal justice policy has come in the area of drug courts, which provide intensive and court-monitored treatment to defendants whose involvement in the criminal justice system is primarily attributable to their drug addiction.37
The court system in Miami–Dade County created the first drug treatment court in 1989.
Drug courts have developed over the past twenty years primarily through the initiative of local courts, with the help of state and local legislation and assistance from Congress. Reform legislation has been the direct result of data documenting the extent of drug use among those charged with criminal offenses and data evaluating the success of the drug court approach.
38
The effort was motivated both by concerns about prison overcrowding39 spawned by increases in drug-related prosecutions and penalties,40
36 Id. at 137.
and by the concerns of those who worked within the
37 This is a very broad definition, but a more detailed definition is not possible because
there is significant variation among drug court programs. See RYAN S. KING & JILL
PASQUARELLA, DRUG COURTS: A REVIEW OF THE EVIDENCE 2 (2009), available at
http://www.sentencingproject.org/doc/dp_drugcourts.pdf (“Because drug courts are designed and operated at the local level, there are fundamental differences . . . .”). One point of clarification regarding the use of the term “drug court” is, however, in order. This Article uses the term “drug court” to refer to drug treatment courts modeled after the Miami–Dade County drug treatment court described below. The term drug court has also been used to refer to courts that implemented programs to “fast-track” drug possession cases. See Richard C. Boldt, Rehabilitative Punishment and the Drug Treatment Court Movement, 76 WASH.U. L.Q.1205, 1207 (1998). However, this Article uses the term only to include drug treatment courts.
38 John S. Goldkamp, The Drug Court Response: Issues and Implications for Justice
Change, 63 ALB.L.REV. 923, 942 (2000) (“[K]ey Miami justice leaders in 1989, such as Chief Judge Gerald Wetherington, Judge Herbert Klein, Dade County’s State Attorney Janet Reno, Public Defender Bennet Brummer, and Timothy Murray (the Office of Substance and Abuse Control Director), improvised by using drug courts to respond to a crisis in the criminal justice system.”).
39 In 1988, the prison population in two-thirds of the states exceeded their maximum
prison capacity. See BUREAU OF JUSTICE STATISTICS,PRISONERS IN 1988, at 5 (1989). 40 See Craig Haney, The Wages of Prison Overcrowding: Harmful Psychological
Consequences and Dysfunctional Correctional Reactions, 22 WASH.U.J.L.&POL’Y 265,
criminal justice system that prison sentences were not solving the drug problem.41 The original concept was to involve defendants in drug treatment programs with hands-on oversight by judges assigned to their cases as a key part of the resolution of the criminal charges.42 Although the idea of a drug treatment court initially met with “embarrassed silence and out-of-hand dismissal,”43 in the ensuing twenty years, drug courts have become commonplace. In 2009, 2,038 drug courts were operating across the country, in 1,416 of the 3,155 counties in the country.44 Moreover, as of 2007, forty-one states had enacted legislation related to the planning, operation, or funding of drug courts.45
The tremendous growth in the number of drug courts is attributable to two data-driven factors. First, these courts have made a concerted effort, supported by the federal government, to evaluate the effectiveness of the programs they operate—both in terms of reducing recidivism46 and in terms of cutting prison and jail costs47
“unprecedented”); Franklin E. Zimring, Drug Treatment as a Criminal Sanction, 64 U. COLO.L.REV. 809, 809 (1993).
—and at least some of those assessments
41
See Peggy Fulton Hora, William G. Schma & John T.A. Rosenthal, Therapeutic Jurisprudence and the Drug Treatment Court Movement: Revolutionizing the Criminal Justice System’s Response to Drug Abuse and Crime in America, 74 NOTRE DAME L.REV. 439, 448–49 (1999) (“The emergence of [drug courts] reflects the growing recognition on the part of judges, prosecutors, and defense counsel that the traditional criminal justice methods of incarceration, probation, or supervised parole have not stemmed the tide of drug use among criminals and drug-related crimes in America.”).
42 See Goldkamp, supra note 38, at 936. 43
Id. at 927.
44 See D
RUG COURT CLEARINGHOUSE PROJECT, BUREAU OF JUSTICE ASSISTANCE,
SUMMARY OF DRUG COURT ACTIVITY BY STATE AND COUNTY (2009), available at
http://www1.spa.american.edu/justice/documents/2150.pdf.
45
See DRUG COURT CLEARINGHOUSE PROJECT,BUREAU OF JUSTICE ASSISTANCE,DRUG
COURT ACTIVITY UPDATE 114 (2007), available at http://www1.spa.american.edu/justice/ documents/2105.pdf.
46 See D
RUG COURT CLEARINGHOUSE PROJECT, BUREAU OF JUSTICE ASSISTANCE, SUMMARY ASSESSMENT OF THE DRUG COURT EXPERIENCE 2–3 (May 1997), available at
http://www1.spa.american.edu/justice/documents/2079.pdf (reporting that “[m]ost criminal justice system professionals estimate that at least 45% of defendants convicted of drug possession will recidivate with a similar offense within two to three years,” but “[i]n comparison . . . recidivism among all drug court participants has ranged between five percent to twenty-eight percent and less than four percent for graduates [of the drug court program]”). But see Morris B. Hoffman, Commentary: The Drug Court Scandal, 78 N.C.L. REV. 1437, 1479–80 (2000) (arguing that there is no real empirical evidence that drug courts reduce recidivism among all participants).
47 See D
RUG COURT CLEARINGHOUSE PROJECT, BUREAU OF JUSTICE ASSISTANCE, MEMORANDUM RE:COST BENEFITS/COSTS AVOIDED REPORTED BY DRUG COURT PROGRAMS AND DRUG COURT PROGRAM EVALUATION REPORTS 2–3 (Apr. 10, 2009), available at
report positive outcomes. As more and more jurisdictions have struggled both with jail overcrowding and with recidivism, the existence of these reports has made drug courts an increasingly attractive option.
Second, the federal government has funded both implementation of drug courts and assessment of these programs. In 1994, Congress passed legislation providing funding for a new Drug Court Program Office within the Office of Justice Programs at the Department of Justice designed to provide technical assistance to drug court programs, and it also appropriated twelve million dollars to support the development and assessment of those programs.48 By 2002, this program had grown to the point that the Department of Justice awarded ninety-four grants totaling $34.19 million.49 In addition to awarding money, participation by the Department of Justice has been critical to fostering assessment of drug court outcomes. In 1997, the Department sponsored an initiative by the National Association of Drug Court Professionals, which developed a list of the ten necessary elements for a successful drug court program.50 The Department also has sponsored a clearinghouse to maintain all of the data related to drug court programs across the country.51
The widespread implementation of drug courts has not escaped criticism both by academics and by lawyers who represent defendants in the drug court system. In particular, some have argued that drug courts’ claims of success have been somewhat (if not completely) overstated and that there is no empirical evidence that drug courts actually reduce recidivism.52
drug court programs reported in 2001 that the program saved them an average of 10,133 prison/jail days or $667,694).
Part
48 See Goldkamp, supra note 38, at 948. Then-Attorney General Janet Reno, who had
been instrumental in creating the first drug court in Miami–Dade County, played a critical role in the Department of Justice’s support of drug courts.
49 See B
UREAU OF JUSTICE ASSISTANCE, U.S. DEP’T OF JUSTICE, OFFICE OF JUSTICE
PROGRAMS DRUG COURTS GRANTS, FISCAL YEAR 2002, available at
http://www.ojp.usdoj.gov/BJA/grant/DrugCourts/02DCgrants.htm.
50 See Goldkamp, supra note 38, at 936.
51 The clearinghouse is operated by American University’s School of Public Affairs in
conjunction with the Department of Justice’s Bureau of Justice Assistance. SeeDrug Court Clearinghouse/Adult Technical Assistance Project, AM. UNIV. JUST. PROGRAMS OFFICE, http://www1.spa.american.edu/justice/project.php?ID=1 (last visited Nov. 4, 2010).
52
See,e.g., Hoffman, supra note 46, at 1479–80 (“Perhaps the most startling thing about the drug court phenomenon is that drug courts have so quickly become fixtures of our jurisprudence in the absence of satisfying empirical evidence that they actually work.”). Some academics also have criticized the non-adversarial nature of drug court programs, suggesting that the nature of the program can infringe on the defendant’s constitutional rights or force defense counsel to abandon the role of zealous advocate. See,e.g., Tamar M. Meekins, “Specialized Justice”: The Over-Emergence of Specialty Courts and the Threat of a New Criminal Defense Paradigm, 40 SUFFOLK U. L.REV. 1, 3 (2006) (“The standard
of the dispute over the success of drug court programs stems from differences in how to measure success. In particular, in determining whether drug courts reduce recidivism rates, some examine the recidivism rates of drug court graduates,53 while others argue that the relevant group for study is those who participate in the drug court program (which would include drug court dropouts).54 Because the recidivism rates of graduates are so much lower than those of dropouts (indeed, most studies demonstrate that drug courts reduce recidivism of graduates),55
That having been said, the dispute over how to measure the success of the program demonstrates the value of having collected this data. As a result of the data collection, we now know that drug courts have a much greater impact on those who graduate than on those who do not finish, so that programs should focus on ways to lower the dropout rates.
any assessment of the success of the program depends on the group being tracked.
56
Whether or not one concludes that drug courts solve the problems they were intended to address, the fact that we now have data to measure their success and improve their outcomes sets them apart from the vast majority of criminal justice programs.57
3. Mental Health Courts
Mental health courts arose out of the same therapeutic justice movement that created drug courts,58
defender as a zealous advocate fighting against the system.”); Mae C. Quinn, An RSVP to Professor Wexler’s Warm Therapeutic Jurisprudence Invitation to the Criminal Defense Bar: Unable to Join You, Already (Somewhat Similarly) Engaged, 48 B.C.L.REV. 539 (2007). While these arguments have force, for purposes of this Article, I am more concerned with the empirical questions surrounding drug courts than the constitutional questions.
and as was the case with drug courts,
53 See Peggy Fulton Hora & Theodore Stalcup, Drug Treatment Courts in the
Twenty-First Century: The Evolution of the Revolution in Problem-Solving Courts, 42 GA.L.REV. 717, 801–03 (2008) (citing statistics suggesting that nationally, drug court graduates have significantly lower recidivism rates than defendants convicted of drug offenses who have not participated in a drug court program).
54
See Hoffman, supra note 46, at 1483 (“[M]ost evaluators now agree that the most meaningful target group against which the control group must be compared is all drug court defendants, not just drug court graduates.”).
55 K
ING &PASQUARELLA, supra note 37, at 7 (“[D]rug court participants who graduate tend to have much lower recidivism rates than drug court dropouts.”).
56 See id. (“[The fact that dropouts have a higher recidivism rate than graduates] suggests
that drug courts experiencing a less than desired effect on rearrest rates may want to focus on addressing the program design to encourage higher rates of retention.”).
57 See Douglas B. Marlowe, The Verdict on Adult Drug Courts, 51 A
DVOC.:OFFICIAL
PUBLICATION IDAHO ST.B.14, 14 (Sept. 2008) (arguing that “[f]ew, if any, other criminal
justice programs have been put to” the same level of scientific scrutiny as drug courts).
58 Drug courts were the first of the so-called problem-solving courts, and mental health
data have fostered their development. The first mental health court was founded in 1997, nearly a decade after the first drug court, and it was designed to provide treatment and resources for defendants who had become involved in the criminal justice system primarily because of mental illness.59
Like drug courts, mental health courts have multiplied rapidly— although not nearly as rapidly as drug treatment courts
Because of the similarities in design and inception, the path of mental health courts has been remarkably similar to that of drug courts.
60
—and much of the same pattern of growth has marked their evolution. First, although mental health courts use the same general approach to the problem—namely the provision of mental health treatment enforced by the threat of court sanctions—courts have adapted the model depending on the needs of particular jurisdictions.61
Second, the growth of mental health courts has largely been the result of cooperation among localities, states, and the federal government. That cooperation, in turn, was driven by data establishing the scope of the problem of mentally ill defendants in the criminal justice system. In 2000, Congress passed America’s Law Enforcement and Mental Health Project.
This fine-tuning has meant that jurisdictions seeking to develop mental health courts have had to study the mental illness problem in their localities and the varying models to determine which model will work most effectively.
62
The Act authorized ten million dollars per year for fiscal years 2001 through 2004, to support state or local courts in establishing and running mental health courts. The debates over the Act, as well as the findings contained within the Act, were dominated by data on the prevalence of mental illness among defendants in the criminal justice system.63
the crime. See BRUCE J.WINICK &DAVID B.WEXLER,JUDGING IN A THERAPEUTIC KEY: THERAPEUTIC JURISPRUDENCE AND THE COURTS 3–5 (2003).
In introducing the bill in the Senate, for example, Senator Mike DeWine of
59 SeeDevelopments in the Law: The Law of Mental Illness, 121 H
ARV.L.REV. 1114, 1168, 1170 (2008).
60 As of 2009, a dozen years after the first mental health court opened, there were more
than 250 mental health courts in this country. See LAUREN ALMQUIST &ELIZABETH DODD,
MENTAL HEALTH COURTS: A GUIDE TO RESEARCH-INFORMED POLICY AND PRACTICE 2 (2009), available at http://consensusproject.org/jc_publications/mental-health-courts-a-guide-to-research-informed-policy-and-practice/Mental_Health_Court_Research_Guide.pdf.
61 See Stacey M. Faraci, Slip Slidin’ Away? Will Our Nation’s Mental Health Court
Experiment Diminish the Rights of the Mentally Ill?,22 QUINNIPIAC L.REV. 811, 826–32 (2004).
62 See America’s Law Enforcement and Mental Health Project, Pub. L. No. 106-515, 114
Stat. 2399 (2000).
63 Seeid. at § 2 (setting forth findings, including data from a Bureau of Justice Statistics
Ohio highlighted both nationwide statistics establishing that a high percentage of defendants in state prisons and local jails are mentally ill and recidivate at a high level, and statistics from individual states and localities demonstrating high rates of mental illness.64 Similarly, virtually all of the representatives who spoke in support of the bill in the House of Representatives cited data on mentally ill defendants gathered by the Bureau of Justice Statistics and private groups.65
As a result of the funding and assistance provided by states66 and the federal government, since the passage of America’s Law Enforcement and Mental Health Project in 2000,67 mental health courts have expanded steadily. By 2005, there were 125 mental health courts operating in counties across the country, a number of which received funding from the Bureau of Justice Assistance to help cover the start-up costs,68 and between 2004 and 2009, the number of mental health courts doubled to 250.69
Most importantly, the cooperative efforts of federal, state, and local government agencies have led to the development of research on what does and does not work in mental health court operation.70 As with drug courts, mental health courts have raised concerns as to fairness and effectiveness.71
64
See 145 Cong. Rec. S13972-02, S13983 (1999).
65 See 146 Cong. Rec. H10636-01, H10637-39 (2000).
66 In addition to the funding provided by the federal government, some states also have
set up agencies to support the planning and implementation of mental health courts. See
Kirk Kimber, Mental Health Courts—Idaho’s Best Kept Secret, 45 IDAHO L.REV. 249, 253– 54 (2008) (describing the Idaho Drug Court and Mental Health Court Act, which sets forth the legislature’s intent to support drug courts and mental health courts).
67 Additional funding, beyond 2004, was approved with the passage of the Mentally Ill
Offender Treatment and Crime Reduction Act of 2004, Pub. L. No. 108-414, 118 Stat. 2327 (2004). That Act authorized funding of up to $50 million per year for fiscal year 2005 and such sums as may be necessary for fiscal years 2006–09.
68 SeeDevelopments in the Law, supra note 59, at 1170. 69 See A
LMQUIST &DODD, supra note60, at 7–8. Between 2002 and 2003, the Bureau of Justice Assistance provided funding to thirty-seven mental health courts, but between 2006 and 2009, it provided funding for an additional seventy-four mental health courts. See E-mail from Ruby Qazilbash, Senior Policy Advisor for Substance Abuse and Mental Health, Bureau of Justice Assistance, to Professor Erica J. Hashimoto, University of Georgia School of Law (March 15, 2010) (on file with author).
70 See A
LMQUIST &DODD, supra note60, at 21–28 (discussing the state of the research, and suggesting further questions about mental health courts for research and data collection); HENRY J.STEADMAN,BUREAU OF JUSTICE ASSISTANCE,AGUIDE TO COLLECTING MENTAL
HEALTH COURT OUTCOME DATA 3 (2005) (soliciting data from mental health court providers and noting that “[t]he core question in evaluating mental health courts is not, ‘Do mental health courts work?’ but rather, ‘What works, for whom, under what circumstances?’”).
71 Seeid. (noting the concern of some criminal justice and mental health experts that
But the fact that they continue to be the subject of so much study means that it is likely they will develop and address those criticisms over time.72
B. ENSURING FAIR AND EQUITABLE ENFORCEMENT OF CRIMINAL STATUTES
The three examples discussed above demonstrate that data can lead to sound decisions in the enactment, implementation, and evaluation of criminal justice policies. In addition to its importance for the development of rational criminal justice policy, data collection also must be undertaken in order to ensure even-handed enforcement of statutes. Race discrimination provides an illustrative example. Allegations of race discrimination at all levels have dogged the criminal justice system since at least the 1970s.73
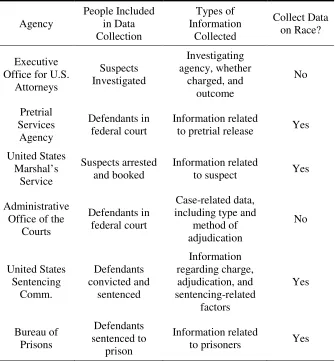
Before turning to the ways in which data can be used to assure equal enforcement, it is helpful to understand the types of data that currently are available. Collecting data on the race of defendants in the criminal justice system is a practice of relatively recent vintage, and although the data remain incomplete, there is much more statistical information on race now than there was twenty years ago. In the federal courts, a variety of agencies—including the Executive Office for U.S. Attorneys in the Department of Justice, the Pretrial Services Agency, the United States Marshals Service, the Administrative Office of the United States Courts, the United States Sentencing Commission, and the Bureau of Prisons—collect But without the collection of data, including data broken down by the race of defendants, one can neither assess whether people of color are being prosecuted and convicted at higher rates than are whites, nor, even if one could show that disproportionate numbers of African Americans were being prosecuted, substantiate claims that race discrimination played a role in the unequal prosecution.
therefore may end up under court supervision longer than they would have been with traditional court adjudication).
72 Id. at 3 (“Mental health courts are better known and more studied than any other
court-based initiative focused on mental health.”).
73 See,e.g., C
ORAMAE RICHEY MANN,UNEQUAL JUSTICE:AQUESTION OF COLOR (1993) (documenting evidence of discrimination on the basis of race and ethnicity in the criminal justice system); Derrick A. Bell, Jr., Racism in American Courts: Cause for Black Disruption or Despair?, 61 CALIF.L.REV. 165 (1973); Angela J. Davis, Prosecution and Race: The Power and Privilege of Discretion, 67 FORDHAM L.REV. 13, 16 (1998) (asserting that “[a]t every step of the criminal process, there is evidence that African Americans are not treated as well as whites—both as victims of crime and as criminal defendants,” and recommending that legislatures require prosecutors to complete “racial impact studies” containing data on the race of the defendant and victim in each case and actions taken at each step in the process); Sheri Lynn Johnson, Black Innocence and the White Jury, 83 MICH. L. REV. 1611 (1985) (documenting evidence that white jurors are more likely to
data on persons prosecuted in the federal criminal justice system. The Bureau of Justice Statistics compiles the data and makes it available through the Federal Justice Statistics Resource Center.74
As set forth in Table 1, data on the race of federal defendants (or suspects) have been collected by the Pretrial Services Agency of the Courts,75 the United States Sentencing Commission,76 the Bureau of Prisons,77 and the United States Marshals Service78 since 1987. Neither the Administrative Office of the Courts79 nor the Executive Office for U.S. Attorneys,80
At a practical level, this means that data related to race and sentencing are available (both from the Sentencing Commission and, if the defendant is
however, collects data of this kind.
74 See About the Federal Justice Statistics Resource Center, B
UREAU OF JUSTICE
STATISTICS, DEP'T OF JUSTICE, http://bjs.ojp.usdoj.gov/fjsrc/index.cfm?p=about_fjsp (last visited Nov. 4, 2010).
75 The U.S. Courts Pretrial Services Act Information System collects and records a
wealth of data on defendants in federal court, including the defendant’s gender, race, age, Hispanic origin, employment status at arrest, education level, criminal history, criminal justice status (i.e., whether the defendant was on parole, probation, or pretrial release at the time of arrest), history of drug abuse, and whether the defendant was released. See BUREAU OF JUSTICE STATISTICS, FEDERAL JUSTICE STATISTICS: 2006 STATISTICAL TABLES tbl.3.2 (2009), available at http://bjs.ojp.usdoj.gov/content/pub/html/fjsst/2006/fjs06st.cfm [hereinafter 2006STATISTICAL TABLES].
76 The U.S. Sentencing Commission collects data on every criminal defendant sentenced
in federal court. Each line of data includes a wealth of information not only about the case, including the charge(s), the method of adjudication, and the sentence imposed, but also about the defendant, including race, gender, age, education level, criminal history, and citizenship.
See U.S.SENTENCING COMM’N,SOURCEBOOK OF FEDERAL SENTENCING STATISTICS tbls.4–9 (2008), available at http://www.ussc.gov/ANNRPT/2008/SBTOC 08.htm.
77 The Bureau of Prisons collects data on all federal defendants who are sentenced to
incarceration and confined within the Bureau of Prisons’ system. Data on inmates includes race, age, gender, citizenship, and whether the inmate is of Hispanic origin. See 2006 STATISTICAL TABLES, supra note 75, at tbl.7.10.
78 The U.S. Marshals Service collects data on all suspects it arrests. The data includes
the gender, race, age, and citizenship of the suspect. See 2006STATISTICAL TABLES, supra
note 75, at tbl.1.3.
79 The Administrative Office of the U.S. Courts keeps data on all criminal defendants
processed through the federal courts. Most of the data are case-related, including the types of charges, the outcome of the case, and the method of adjudication. The database keeps very little data on defendants and does not keep data on the race of defendants. See FED. JUSTICE STATISTICS RES. CTR., BUREAU OF JUSTICE STATISTICS, DATA DICTIONARY FOR
DEFENDANTS IN CRIMINAL CASES TERMINATED, available at http://fjsrc.urban.org/ datadictionary.cfm (describing all of the data variables collected by the Administrative Office of the United States Courts).
80 The Executive Office for the U.S. Attorneys collects data on all suspects investigated
Table 1
sentenced to a term of imprisonment, from the Bureau of Prisons), as are data on race and arrest (from the U.S. Marshals Service), and on race and pretrial release (from the U.S. Courts Pretrial Services System). Because neither the Executive Office for the U.S. Attorneys nor the Administrative Office of the U.S. Courts collects data on race of defendants or suspects investigated,81
81 See Email from Thomas H. Cohen, Statistician, Bureau of Justice Statistics, to
Professor Erica J. Hashimoto, University of Georgia School of Law (Mar. 9, 2010) (on file with author).
a serious gap in the data, because a high percentage of defendants in federal court are convicted either by way of trial or by guilty plea, the Sentencing Commission’s data still provide a relatively complete profile of those persons prosecuted in the federal courts.
In state courts, where the vast majority of criminal defendants are prosecuted, the collection of data on criminal defendants varies widely depending on the jurisdiction. Since 1988, the federal Bureau of Justice Statistics has collected data from pretrial services agencies on a sample of felony defendants in forty of the largest seventy-five counties in the country.82 These data include the types and number of charges, the pretrial release status of the defendant, the criminal history of the defendant, the age, race, and sex of the defendant, the outcome of the case, and the sentence.83
The Bureau of Justice Statistics also collects data on felony sentencing from individual states (or counties if the data are kept by counties) through the National Judicial Reporting Program.
The dataset did not originally include data on the race of the defendant, but this information has been collected since 1990. The primary problem with this dataset is that it collects data only in the most populous counties and only on defendants charged with felonies. Thus, there are no data from smaller jurisdictions or rural areas or for misdemeanor defendants.
84
The database contains extensive information on the criminal history, race, gender, ethnicity, and age of the defendant, along with information about the method of conviction, the type of charges, and the sentence imposed.85
Some individual states, in particular states that have sentencing commissions, collect and make available sentencing data on defendants in their criminal justice systems.86
82 See B
UREAU OF JUSTICE STATISTICS, 1990–2006 Cumulative Codebook, in STATE
COURT PROCESSING STATISTICS, 1990–2006: FELONY DEFENDANTS IN LARGE URBAN
COUNTIES 4 (2007), available at http://www.icpsr.umich.edu/icpsrweb/ICPSR/studies/2038/ documentation.
In most states, the department of corrections also compiles demographic information on inmates in the state
83 See id. 84 See M
ATTHEW R. DUROSE & PATRICK LANGAN, BUREAU OF JUSTICE STATISTICS
BULLETIN: FELONY SENTENCES IN STATE COURTS, 2004 (2007), available at
http://bjs.ojp.usdoj.gov/ content/pub/pdf/fssc04.pdf.
85
See id.
86 See, e.g., T
AMARA FLINCHUM ET AL., N.C. SENTENCING AND POLICY ADVISORY
COMM’N,STRUCTURED SENTENCING STATISTICAL REPORT FOR FELONIES AND MISDEMEANORS
FISCAL YEAR 2007/08, at 9–10 (2009), available at http://www.nccourts.org/ Courts/CRS/Councils/spac/Documents/07-08statisticalreportR.pdf (listing convictions by age, race, and gender of defendant); MINN.SENTENCING GUIDELINES COMM’N,SENTENCING
PRACTICES: ANNUAL SUMMARY STATISTICS FOR FELONY OFFENDERS SENTENCED IN 2009
prison system, at least as to race, age and gender.87 In addition, in Minnesota, court clerks ask criminal defendants to complete a questionnaire requesting information on gender, race, and ethnicity.88 The clerks then forward those forms to statisticians for analysis.89 With the exception of Minnesota, however, states do not appear to be collecting data on criminal defendants except as it relates to sentencing or corrections.90
While the data admittedly remain incomplete, those concerned about issues of racial discrimination in the criminal justice system have used the existing data to assess the extent to which the laws operate impartially. In addition, criminal defendants have used the data to try to prove claims of race discrimination. While equal protection claims have rarely succeeded in courts,91 at the very least the statistics on race do appear to have influenced legislative debates.92
1. The Use of Data to Prove Equal Protection Violations
Criminal defendants’ claims that they have been unconstitutionally singled out for prosecution or punishment have not fared well in the courts. In spite of that fact, collecting data on race remains critically important because, as the Supreme Court’s selective prosecution cases make clear, without data, a defendant cannot prevail on a selective prosecution claim. Thus, while such claims continue to be very difficult to prove even with data, it is possible that more sophisticated data collection may ultimately make the claims more readily provable.93
The Court has recognized that, while the government retains “broad discretion as to whom to prosecute . . . the decision to prosecute may not be deliberately based upon an unjustifiable standard such as race, religion, or
87 See, e.g., G
A.DEP’T OF CORR.,ANNUAL REPORT FY 08, at 17 (2009), available at
http://www.dcor.state.ga.us/Reports/Annual/pdf/FY08_Annual_Report.pdf. Some jurisdictions keep much more detailed information. For instance, in addition to collecting data on gender, race, and sex, the Massachusetts Department of Corrections collects data on the marital status, citizenship, religion, and educational level of inmates. See MASS.DEP’T OF CORR., JANUARY 1, 2009 INMATE STATISTICS tbls.17–22 (2009) available at
http://www.mass.gov/Eeops/docs/doc/research_reports/112009.pdf.
88
See Jon B. Gould, Studying Inequality with One Eye: A New Agenda for Evaluating Disparate Treatment in the Courts, 23 JUST.SYS.J.317, 325 (2002).
89
See id.
90 See id. at 321 (concluding that except the studies relating to sentencing, “[b]y and
large, the courts lack similar analyses of judicial verdicts, whether they are criminal findings of guilt or civil judgments of liability”).
91
Seeinfra Part II.B.1.
92
See infra Part II.B.2.
93 See Gould, supra note 88, at 321 (arguing that courts should collect more data so that
other arbitrary classification.”94 Most scholars date the “selective prosecution” prohibition to 1886, when the Supreme Court held in Yick Wo v. Hopkins,95 that California violated the Equal Protection Clause when it treated people of Chinese descent differently when enforcing an ordinance than it treated white people.96
Nearly a century later, the Court answered that question, holding that a defendant alleging discriminatorily selective prosecution of a facially neutral statute in violation of the Equal Protection Clause must demonstrate both discriminatory effect and discriminatory purpose.
Yick Wo held that the Equal Protection Clause protects against the discriminatory enforcement of a facially neutral statute, while leaving open what a defendant must show in order to prevail on a selective prosecution claim.
97
While the Court has intimated that statistical proof demonstrating a “stark” pattern may be sufficient to establish discriminatory intent,98
94 See Wayte v. United States, 470 U.S. 598, 607–08 (1985) (citations omitted) (internal
quotation marks omitted).
the Court has set a very high threshold for using statistical proof in this way. In McCleskey v. Kemp, for instance, the defendant relied on the Baldus study, a detailed statistical analysis that showed that African Americans who were charged with and convicted of killing white people in Georgia (as McCleskey was) had a statistically significantly higher likelihood of being sentenced to death compared to both white people who killed white people and African
95 Yick Wo v. Hopkins, 118 U.S. 356 (1886). 96
See, e.g., DAVID COLE, NO EQUAL JUSTICE 159 (1999) (“[T]he principle the court established in Yick Wo is straightforward: where the government discriminates based on race in its enforcement of the criminal law, it denies equal protection.”). The petitioner in Yick Wo was convicted of violating a San Francisco ordinance that prohibited operating a laundry in a wooden building without the permission of the Board of Supervisors. Yick Wo, 118 U.S. at 374. The undisputed record established that 200 laundry owners of Chinese descent applied for such permits and all were denied, while eighty-one white laundry owners applied for permits and all but one were granted the permits. Id. At least one scholar has concluded that because Yick Wo “was not fundamentally a criminal case,” i.e., the discrimination was perpetrated by civil authorities—the Board of Supervisors—rather than by prosecutors, it does not recognize the selective prosecution doctrine for which it is so often cited. See
Gabriel J. Chin, Unexplainable on Grounds of Race: Doubts About Yick Wo, 2008 U.ILL.L. REV. 1359, 1363 (2008). Regardless whether the doctrine originated with Yick Wo or in later cases, it indisputably now exists.
97
See Wayte, 470 U.S. at 608–09; Oyler v. Boles, 368 U.S. 448 (1968).
98 See McCleskey v. Kemp, 481 U.S. 279, 293–94 (1987) (citing Yick Wo for the
Americans who killed African Americans.99 The Court concluded that “[b]ecause discretion is essential to the criminal justice process, we would demand exceptionally clear proof before we would infer that the discretion has been abused,” and it therefore held that “the Baldus study is clearly insufficient to support an inference that any of the decisionmakers in McCleskey’s case acted with discriminatory purpose.”100
In the wake of McCleskey, the challenge facing defendants trying to establish selective prosecution claims has only become more difficult. In
United States v. Armstrong, the Court held that defendants in federal court are not entitled to discovery to prove selective prosecution claims unless they first come forward with some evidence that “similarly situated defendants of other races could have been prosecuted, but were not.”101 The decisions in McCleskey and Armstrong highlight the importance of collecting data on the race of defendants because, without such data, a defendant cannot even begin to establish a selective prosecution claim.102 Indeed, even with the data that are now being collected, selective prosecution claims remain virtually (if not completely) impossible to prove.103 Thus, court systems ought to expand the data being collected in order to ensure that the Constitution is being respected.104
99 As the Court described the study, it concluded that
even after taking account of 39 nonracial variables, defendants charged with killing white victims were 4.3 times as likely to receive a death sentence as defendants charged with killing blacks. According to this model, black defendants were 1.1 times as likely to receive a death sentence as other defendants. Thus, the Baldus study indicates that black defendants, such as McCleskey, who kill white victims have the greatest likelihood of receiving the death penalty.
McCleskey, 481 U.S. at 287. The defendant also argued that the study established that the death penalty in Georgia violated the Eighth Amendment. The Supreme Court rejected that argument as well. Id. at 313.
100Id. at 297.
101United States v. Armstrong, 517 U.S. 456, 469 (1996).
102This is particularly so since Armstrong so severely limits the discovery to which
defendants are constitutionally entitled.
103
See COLE, supra note 96, at 159 (concluding that there were “no reported federal or state cases since 1886 that had dismissed a criminal prosecution on the ground that the prosecutor acted for racial reasons”); Chin, supra note 96, at 1361 n.11 (“It is always dangerous to make claims that there are ‘no reported cases’ on a question of law, but my research assistant and I looked, and we, like many other researchers, could find none.”).
104Some argue that court systems are understandably reluctant to keep data on race of
2. Use of Data on Race in the Legislative Process
Although data on race have not yet led to systemic reform through the Equal Protection Clause, they have proven useful in the legislative arena in two ways. First, although many African Americans perceive the criminal justice system as unfair,105
First, as discussed above, the mandatory minimum penalties set forth in the Anti-Drug Abuse Act of 1986 provided for equal penalties for one hundred times the amount of powder cocaine as crack cocaine.
legislators and those who work within the system want to believe that it treats defendants equally, regardless of race. Data suggesting that defendants are being treated differently based on race upset that view, and therefore may lead to change. Second, even if data are not sufficiently “stark” to prove an equal protection violation, data demonstrating disparate impact of laws may still make legislators worry that the law is vulnerable to such challenges. For both of these reasons, data that fall short of proving a selective prosecution claim still may result in legislative action. A couple of examples demonstrate this point.
106
Because the overwhelming majority of defendants convicted of crack cocaine offenses in federal court over the past twenty years have been African-American,107 and because crack cocaine penalties in federal court have greatly exceeded the penalties for powder cocaine offenses, the percentage of African Americans incarcerated in the federal Bureau of Prisons has mushroomed over the past twenty-five years.108
Although the data show that the low quantity threshold for mandatory minimum crack penalties has had a disproportionate impact on African Americans, equal protection challenges to these mandatory minimums
105See Paul Butler, Much Respect: Toward a Hip-Hop Theory of Punishment, 56 S TAN.
L.REV. 983, 998 (2004) (describing hip-hop artists’ view of the criminal justice system as a
means of suppressing those who “rebel[] against the oppressive status quo”).
106Anti-Drug Abuse Act of 1986, Pub. L. No. 99-570, 100 Stat. 3207. 107See U.S.S
ENTENCING COMM’N,REPORT TO THE CONGRESS:COCAINE AND FEDERAL
SENTENCING POLICY 16 tbl.2-1 (2007) (setting out figures establishing that in 1992, 91.4% of
those convicted of crack offenses in federal court were African-American, in 2000, 84.7% were African-American, and in 2006, 81.8% were African-American). In contrast, African Americans constitute a relatively small percentage of those convicted of powder cocaine offenses in federal court. See id. (setting forth data that African Americans constituted between 27% and 30% of those convicted for powder cocaine offenses).
108See Marc Mauer, Racial Impact Statements as a Means of Reducing Unwarranted
“have failed miserably in court.”109 Those same statistics, however, have made headway with policymakers. In 2007, the United States Sentencing Commission reduced the disparity between crack and powder cocaine penalties under the Sentencing Guidelines.110 More recently, Congress has acted to modify the mandatory minimums for crack offenses. On August 3, 2010, President Obama signed into law the Fair Sentencing Act of 2010, which changed the amounts of crack cocaine necessary to trigger five-year mandatory minimum sentences from five grams to twenty-eight grams, and for ten-year sentences from fifty grams to two hundred eighty grams.111
Racially disproportionate sentencing statistics in drug cases also led to reform of sentencing laws in Georgia. In 1987, the Georgia legislature passed a two-strikes provision for drug offenses.
This amendment reduces the disparity between the quantities of powder and crack cocaine necessary to trigger mandatory minimum sentences from 100:1 to 18:1. And this change indisputably was the result of evidence that the crack cocaine sentences were disproportionately affecting low-income minority defendants.
112
Under that provision, a defendant convicted of a “second or subsequent” drug trafficking offense was subject to a mandatory minimum life sentence if the state notified the defendant prior to trial of its intent to seek the enhanced penalty.113 By May 1994, the state Board of Pardon and Parole’s records indicated that 98.4% of the defendants “serving life sentences for drug offenses . . . were African-American, although African-Americans comprise only 27% of the state’s population.”114
In Stephens v. State, an African-American defendant sentenced to life under the repeat offender provision used those statewide statistics, in conjunction with evidence that all of the defendants serving life sentences under that provision in Hall County (where Stephens was convicted) were African-American, to argue that the statute was being enforced in a discriminatory manner in violation of the equal protection guarantees of both the United States Constitution and the Georgia constitution. Over a strong dissent, a majority of the court concluded that Stephens had failed to
109See Sklansky, supra note 7, at 1298. Defendants have challenged the Act itself as a
violation of the Equal Protection Clause, id., and also have brought selective prosecution claims against the government for the enforcement of the statute. See United States v. Armstrong, 517 U.S. 456 (1996).
110
See U.S. SENTENCING COMM’N,AMENDMENTS TO THE SENTENCING GUIDELINES 70 (2007), available at http://www.ussc.gov/2007guid/may2007rf.pdf.
111See Fair Sentencing Act of 2010, Pub. L. No. 111-220, 124 Stat. 2372 (2010). 112See G
A.CODE ANN.§16-13-30(d) (West 2009 & West Supp. 2010) (repealed).
establish an equal protection violation because he had not identified a similarly situated white person in Hall County who could have been prosecuted under the two-strikes law but was not.115 The dissent found Stephens’ statistical showing—establishing that an African-American defendant in Georgia convicted of two or more drug offenses was 2,761% more likely to receive a life sentence than a white defendant in Georgia convicted of two or more drug offenses—sufficiently “stark” to require the government, under a modified Batson framework, to provide a legitimate non-discriminatory reason for its decision to prosecute Stephens under the repeat offender law.116
Although Stephens failed to prevail in court, his case provided the foundation for a change in the repeat offender law. Five months after the case was decided, the Georgia Supreme Court Commission on Racial and Ethnic Bias in the Court System issued a report citing the statistics set forth in Stephens, and calling for a more detailed study broken down by judicial circuit on the use of the repeat offender law.117 Faced with these bleak statistics, and the possibility of future successful equal protection challenges if circuit-specific statistics were kept, the Georgia legislature repealed the mandatory life sentence in two-strikes cases.118
As these examples illustrate, data demonstrating unequal enforcement of the laws, even in the absence of a finding that there has been a constitutional violation, may lead to legislative reform. Thus, data collection remains of critical importance to ensure that laws are enforced fairly.
115Id. 116
Id.at 568–69 (Benham, P.J., dissenting). When the slip opinion in the case was first released, a majority of the Court concluded that the statistics presented by the defense were “so grossly disproportionate . . . as to shock the conscience,” and therefore required the Government to provide a legitimate non-discriminatory reason for its conduct. See Stephens v. State, No. S94A1854, 1995 WL 116292 (Ga. Mar. 17, 1995), withdrawn, 456 S.E.2d 560 (Ga. 1995). The court’s slip opinion caused great consternation and prompted a scathing letter from district attorneys across the state. See James P. Fleissner, Criminal Law and Procedure: A Two-Year Survey, 48 MERCER L.REV.219, 222 (1996). Less than two weeks later, the court vacated the slip opinion and issued a new majority opinion concluding that there was no violation of either the state or the federal Constitution. Justice Thompson, who switched his vote between the two opinions, authored a concurring opinion noting that although there was no constitutional violation, “only a true cynic can look at these statistics and not be impressed that something is amiss.” Stephens, 456 S.E. 2d at 564 (Thompson, J., concurring specially). He therefore urged the Georgia legislature to step in and address the problem. Id. at 565–66.
117See Fleissner, supra note 116, at 230. 118