STATISTIK UNIVERSITAS NEGERI MALANG (UM)
TAHUN 2013-2017
STATISTICS OF STATE UNIVERSITY OF MALANG
YEARS 2013-2017
UNIVERSITAS NEGERI MALANG
STATE UNIVERSITY OF MALANG
DAFTAR ISI / TABLE OF CONTENTS
Halaman
Kata Pengantar
/
Preface
... xiv
Daftar Isi /
Table of Contents
...v
Kesimpulan Umum
/
General Conclusion
... xvi
I. Mahasiswa
/ Students
...1
Grafik I.1 Grafik Perkembangan Jumlah Daya Tampung, Mahasiswa Baru,
Mahasiswa Terdaftar, dan Lulusan
Graph of Trends in Capacity For New Students, Registered Students, and
Graduates
Tahun /
Years
2013-2017 ...3
Tabel I.1 Perkembangan Jumlah Daya Tampung Mahasiswa Baru, Mahasiswa
Terdaftar, Lulusan, dan Produktivitas
Trends in Capacity For New Students, Registered Students, Graduates,
and Productivity
Tahun /
Years
2013-2017 ...4
Grafik I.2 Grafik Perkembangan Jumlah Peminat Universitas Negeri Malang
Menurut Jalur Seleksi
Graph of Trends in Number of State University of Malang’s Applicants
by Lane Admission
Tahun /
Years
2013-2017 ...5
Tabel I.2 Perkembangan Jumlah Peminat Universitas Negeri Malang Jalur
SNMPTN Menurut Fakultas/ Jurusan/ Program Studi dan Jenjang Program
Trends in Number of Applicants For Admission to State University of Malang
by Faculty/ Department/ Program of Study and Level of Program
Through SNMPTN
Tahun /
Years
2013-2017 ...6
iii
Tabel I.4 Perkembangan Jumlah Peminat Universitas Negeri Malang Jalur
Seleksi Mandiri Menurut Fakultas/ Jurusan/Program Studi dan
Jenjang Program Studi
Trends in Number of Applicants For Admission Through Internally-Based
Selection to State University of Malang by Faculty/Department/Program of Study
and Level of Program
Tahun /
Years
2013-2017 ... 12
Tabel I.5 Perkembangan Jumlah Mahasiswa yang Diterima, yang Registrasi,
dan yang Tidak Registrasi Jalur SNMPTN
Trends in Number of Students Admitted Through The State Entrance
Examination, Who Registered and Who Did Not Register
Tahun
/ Years
2013-2017 ... 17
Tabel I.6 Perkembangan Jumlah Mahasiswa yang Diterima, yang Registrasi,
dan yang Tidak Registrasi Jalur SBMPTN
Trends in Number of Students Admitted Through The State Entrance
Examination, Who Registered and Who Did Not Register
Tahun
/ Years
2013-2017 ... 22
Tabel I.7 Perkembangan Jumlah Mahasiswa yang Diterima, yang Registrasi,
dan yang Tidak Registrasi Jalur Seleksi Mandiri
Trends in Number of Students Admitted Through The State Entrance
Examination, Who Registered and Who Did Not Register
Tahun
/Years
2013-2017 ... 27
Tabel I.8 Perkembangan Nilai Ujian Calon Mahasiswa Baru yang Diterima di
Universitas Negeri Malang Jalur SBMPTN
Trends in Admission Test Scores of High School Graduates Accepted
in State University of Malang Through State Admission
Tahun /
Years
2014-2017 ... 32
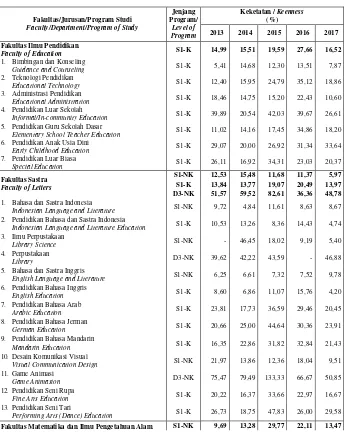
Tabel I.9 Perkembangan Tingkat Keketatan Persaingan Pendaftar Universitas
Negeri Malang Jalur SNMPTN
Trend Degree of Competition Keenes For State Admission Test
At State University of Malang
Tahun /
Years 2013-2017
... 37
Tabel I.10 Perkembangan Tingkat Keketatan Persaingan Pendaftar Universitas
Negeri Malang Jalur SBMPTN
Trend Degree of Competition Keenes For State Admission Test At State
University of Malang
iv
Tabel I.11 Perkembangan Tingkat Keketatan Persaingan Pendaftar Universitas
Negeri Malang Jalur Mandiri
Trend Degree of Competition Keenes For State Admission Test At State
University of Malang
Tahun /
Years
2013-2017 ... 43
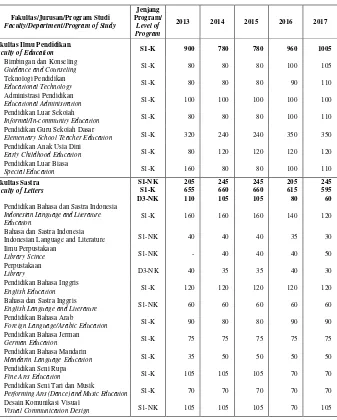
Tabel I.12 Perkembangan Daya Tampung Mahasiswa Baru Menurut
Fakultas/Jurusan/Program Studi
Trends in Capacity For New Students by Faculty/ Department/Program of
Study
Tahun /
Years
2013-2017 ... 47
Tabel I.13 Perkembangan Jumlah Mahasiswa Baru Masukan SMTA dan Non
SMTA Menurut Fakultas dan Jenjang Program
Trends in Number of New Student Intake From Senior High School and
Non-Senior High School by Faculty and Level of Program
Tahun /
Years
2013-2017 ... 51
Tabel I.14 Perkembangan Jumlah Mahasiswa Baru Program Doktor
dan Magister
Trends in Number of New Student Intake of Doctorate Program
and Master's Program
Tahun /
Years
2013-2017 ... 52
Tabel I.15 Perkembangan Jumlah Mahasiswa Baru Masukan Smta Menurut
Fakultas/Jurusan/Program Studi dan Jenjang Program
Trends in Number of New Student Intake From Senior High School by Faculty/
Department/ Program of Study and Level of Program
Tahun /
Years
2013-2017 ... 54
Tabel I.16 Perkembangan Jumlah Mahasiswa Terdaftar Menurut
Fakultas/Program Studi dan Jenjang Program
Trends in Number of Registered Students by Faculty/ Department/ Program of
Study and Level of Program
Tahun /
Years
2013-2017 ... 57
Grafik I.3 Grafik Perkembangan Jumlah Mahasiswa Terdaftar
Graph of Trends in Number of Registered Students
Tahun /
Years
2013-2017 ... 62
Tabel I.17 Perkembangan Jumlah Lulusan Menurut Fakultas/Program Studi
dan Jenjang Program /
Trends in Number of Graduates by Faculty/Program of
Study and Level of Program
v
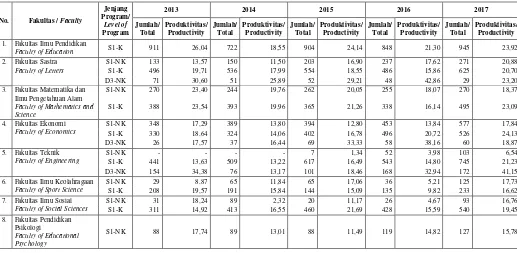
Tabel I.18 Perkembangan Jumlah Lulusan dan Produktivitas
Trends in Number of Graduates and Productivity of State University of Malang
Tahun /
Years
2013-2017 ... 67
Tabel I.19 Perkembangan Jumlah Lulusan dan Rerata IPK Menurut
Fakultas/Program Studi dan Jenjang Program
Trends in Number of Graduates and Grade Point Average by Faculty/Program
of Study, Level of Program,
Tahun /
Years
2013-2017 ... 69
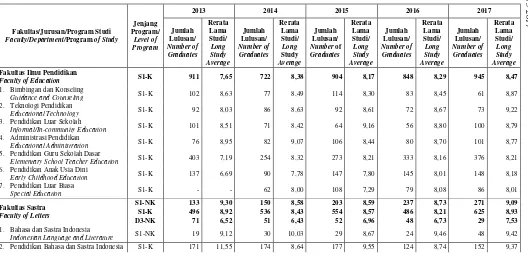
Tabel I.20 Perkembangan Jumlah Lulusan dan Rerata Lama Studi Menurut
Fakultas/Program Studi dan Jenjang Program
Trends in Number of Graduates and Long Study Average by Faculty/Program
of Study, Level of Program
Tahun /
Years
2013-2017 ... 76
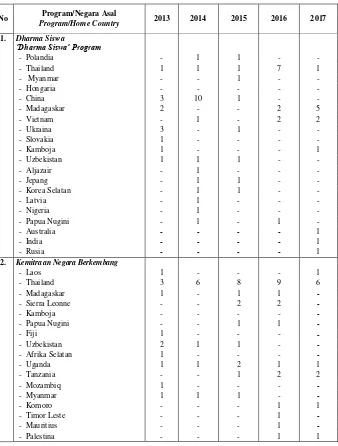
Tabel I.21 Jumlah Mahasiswa Asing Menurut Negara Asal
Trends in Number of Foreign Students by Home Country
Tahun /
Years
2013-2017 ... 83
Tabel I.22 Perkembangan Jumlah Program Studi dan Akreditasi Menurut
Fakultas/Program Studi dan Jenjang Program
Trends in Number of Study Program and Accreditation by Faculty of Study
Program and Level of Program
Tahun /
Years
2013-2017 ... 85
II. Dosen /
Teaching Staff
... 48
Tabel II.1 Perkembangan Jumlah Dosen Menurut Fakultas/Jurusan/Program
Studi dan Pendidikan Tertinggi
Trends in Number of Lecturers by Faculty/Department/Program of Study and
Educational Background
Tahun /
Years
2013-2017 ... 93
Grafik II.1 Grafik Perkembangan Jumlah Dosen Menurut Pendidikan Tertinggi
Graph of Trends in Number of Lecturers by Educational Background
Tahun /
Years
2013-2017 ... 96
Tabel II.2 Perkembangan Jumlah Dosen Menurut Pangkat dan Golongan
Trends in Number of Lecturers by Rank and Category
Tahun /
Years 2013-2017
... 97
Tabel II.3 Perkembangan Jumlah Dosen Menurut Fakultas dan
Jabatan Fungsional
Trends in Number of Lecturers by Faculty and Functional Position
vi
Tabel II.4 Perkembangan Jumlah Dosen Golongan Iv Menurut
Fakultas/Jurusan/Program Studi
Trends in Number of Lecturers of Category IV by Faculty/ Department/
Program of Study
Tahun /
Years 2013-2017
... 100
Tabel II.5 Perkembangan Jumlah Dosen Golongan Iii Menurut
Fakultas/Jurusan/Program Studi
Trends in Number of Lecturers in Category III by Faculty/Department/Program
of Study
Tahun /
Years 2013-2017
... 102
Tabel II.6 Perkembangan Jumlah Dosen yang Bergelar Profesor
menurut Fakultas
Trends in Number of Professors by Faculty
Tahun /
Years 2013-2017
... 104
Tabel II.7 Perkembangan Jumlah Dosen yang Bergelar Doktor Menurut
Fakultas/ Jurusan/ Program Studi
Trends in Number of Lecturers With Doctor's Degrees by Faculty/ Department/
Program of Study
Tahun /
Years 2013-2017
... 105
Tabel II.8 Perkembangan Jumlah Dosen yang Bergelar Master/ Magister
Menurut Fakultas/ Jurusan/ Program Studi
Trends in Number of Lecturers With Master's Degrees by Faculty/ Department/
Program of Study
Tahun /
Years 2013-2017
... 107
Tabel II.9 Perkembangan Jumlah Dosen yang Bergelar Sarjana menurut
Fakultas/ Jurusan/ Program Studi
Trends in Number of Lecturers With 'Sarjana' Degrees by Faculty/ Department/
Program of Study
Tahun /
Years 2013-2017
... 109
Tabel II.10 Perkembangan Jumlah Dosen yang Sedang Tugas Belajar Program
Master/Magister dan Program Doktor Menurut Fakultas/Jurusan/Program Studi
Trends in Number of Lecturers On Study Assignment For Master's and Doctor's
Degrees by Faculty/Department/Program of Study
vii
Tabel II.11 Perkembangan Penambahan Dosen yang Telah Menyelesaikan
Tugas Belajar Program Master/Magister dan Program Doktor Menurut Fakultas
Trends in Additional Lecturers Who Have Completed Their Master and
Doctoral Programs by Faculty
Tahun /
Years 2013-2017
... 113
Tabel II.12 Perkembangan Rasio Dosen : Mahasiswa Menurut Fakultas
Trends In Lecturer : Student Ratio by Faculty
Tahun /
Years 2013-2017
... 114
Tabel II.13 Perkembangan Jumlah Dosen Tidak Tetap Menurut Fakultas
Trends in Number of Part-Time Lecturers by Faculty
Tahun /
Years 2013-2017
... 115
Tabel II.14 Perkembangan Jumlah Dosen Menurut Fakultas dan Agama
Trends in Number of Lecturers by Faculty and Religious Affiliation
Tahun /
Years 2013-2017
... 116
Tabel II.15 Perkembangan Jumlah Dosen Berdasarkan Kualifikasi Pendidikan
dan Bidang Ilmu (Kependidikan dan Nonkependidikan)
Trends in Number of Lecturers by Educational Qualification and Field of
Specialization (Education and Non-Education)
Tahun /
Years
2016-2017 ... 118
Tabel II.16 Perkembangan Jumlah Dosen Menurut Umur dan Jurusan
Trends in Number of Lecturers by Age and Department
Tahun /
Years
2016-2017 ... 122
Tabel II.17 Almamater Dosen Universitas Negeri Malang
Almamater of State University of Malang Teaching Staff
Tahun /
Years
2017 ... 124
Tabel II.18 Perkembangan Jumlah Publikasi Nasional
Trend Number of National Publication
Tahun
/ Years
2014-2017 ... 129
Tabel II.19 Perkembangan Jumlah Publikasi Internasional
Trend Number of International Publication
Tahun
/ Years
2014-2017 ... 130
III. Tenaga Kependidikan /
Administrative Staff
... 131
Tabel III.1 Perkembangan Jumlah Tenaga Kependidikan Menurut Unit Kerja
Trends in Number of Administrative Staff by Unit
viii
Grafik III.1 Grafik Perkembangan Jumlah Tenaga Kependidikan
Graph of Trends in Number of Administrative Staff
Tahun /
Years
2013-2017 ... 134
Tabel III.2 Perkembangan Jumlah Tenaga Kependidikan Menurut Unit
Kerja/Pendidikan Tertinggi
Trends in Number of Administrative Staff by Unit/Educational Background
Tahun /
Years
2013-2017 ... 135
Tabel III.3 Perkembangan Jumlah Tenaga Kependidikan Menurut Unit Kerja/
Golongan Kepangkatan
Trends in Number of Administrative Staff by Unit/Category
Tahun /
Years
2013-2017 ... 139
Tabel III.4 Perkembangan Jumlah Laboran/Teknisi Tetap Menurut Unit Kerja
Trends in Number of Full-Time Laboratory/ Technicians Assistants by Unit
Tahun /
Years
2013-2017 ... 140
Tabel III.5 Perkembangan Jumlah Tenaga Kependidikan Menurut Umur
dan Unit Kerja
Trends in Number of Administrative Staff by Age and Unit
Tahun /
Years
2013-2017 ... 141
Tabel III.6 Perkembangan Jumlah Tenaga Kependidikan yang Mengikuti
Pendidikan Tambahan Menurut Unit Kerja
Trends in Number of Administrative Staff Participating in Additional
Training by Unit
Tahun /
Years
2013-2017 ... 144
Tabel III.7 Perkembangan Jumlah Tenaga Kependidikan Menurut Agama
Trends in Number of Administrative Staff by Religious Affiliation
Tahun /
Years
2013-2017 ... 147
Tabel III.8 Perkembangan Jumlah Pustakawan
Trends in Number of Library Assistants
Tahun /
Years
2013-2017 ... 147
IV. Lain-Lain
Miscellany ... 150
Tabel IV.1 Perkembangan Jumlah Mahasiswa Penerima Beasiswa Menurut
Fakultas, Jenjang Program, dan Sumber Dana
Trends in Number of Students Receiving Scholarship by Faculty, Level of
Program, Source of Funds
ix
Tabel IV.2 Perkembangan Jumlah Mahasiswa Pemenang Lomba Bidang
Penalaran Menurut Nama Lomba dan Tingkat Pertandingan
Trends in Number of Students Competition Winners Field of Reasoning by
Name and Level Competition
Tahun /
Years
2013-2017 ... 156
Tabel IV.3 Perkembangan Jumlah Mahasiswa Pemenang Lomba Bidang
Olahraga Menurut Nama Lomba dan Tingkat Pertandingan
Trends in Number of Students Competition Winners Sports Fields by Name and
Level Competition
Tahun /
Years
2013-2017 ... 159
Tabel IV.4 Perkembangan Jumlah Mahasiswa Pemenang Lomba Bidang
Kerohanian Menurut Nama Lomba dan Tingkat Pertandingan
Trends in Number of Students Competition Winners Fields of Spirituality by
Name and Level Competition
Tahun /
Years
2013-2017 ... 161
Tabel IV.5 Perkembangan Jumlah Mahasiswa Pemenang Lomba Bidang
Kesenian Menurut Nama Lomba dan Tingkat Pertandingan
Trends in Number of Students Competition Winners Fields of Arts
by Name and Level Competition
Tahun /
Years
2013-2017 ... 162
Tabel IV.6 Perkembangan Jumlah Kegiatan Kemahasiswaan
Menurut Bidang Kegiatan
Trends in Number of Students Activities by Field of Activity
Tahun /
Years
2013-2017 ... 163
Tabel IV.7 Perkembangan Jumlah Judul Penelitian dan Jumlah Tenaga Peneliti
yang Terlibat Penelitian
Trends in Number of Research Titles and Researchers
Tahun /
Years
2013-2017 ... 164
Grafik IV.1 Grafik Perkembangan Jumlah Judul Penelitian dan
Jumlah Tenaga Peneliti
Graph of Trends in Number of Research Titles and Researchers
Tahun /
Years
2013-2017 ... 166
Tabel IV.8 Perkembangan Jumlah Dosen yang Mengikuti Kegiatan
Lokakarya/Penataran Penelitian
Trends in Number of Lecturers Participating in Research Workshop/Upgrading
x
Tabel IV.9 Perkembangan Jumlah Anggaran Kegiatan Penelitian Menurut Jenis
Sumber Dana
Trends in Number Research Institute Budget by Source of Funds
Tahun /
Years
2013-2017 ... 169
Tabel IV.10 Perkembangan Jumlah Judul dan Tenaga yang Terlibat Dalam
Kegiatan Pengabdian Kepada Masyarakat Menurut Bentuk Kegiatan dan
Fakultas
Trends in Number of Titles and Personnel Involved in Community Service Activities
by Type of Activity and Faculty
Tahun /
Years
2013-2017 ... 171
Tabel IV.11 Perkembangan Jumlah Judul Kegiatan Pengabdian Kepada
Masyarakat Menurut Bentuk Kegiatan dan Sumber Dana
Trends in Number of Community Service Activities by Type of Activity and
Source of Funds
Tahun /
Years
2013-2017 ... 174
Tabel IV.12 Perkembangan Jumlah Mahasiswa Peserta dan Dosen Pembimbing
Kuliah Kerja Nyata (KKN) Menurut Fakultas
Trends in Number of Student Participants and Advisors For Student Community
Service by Faculty
Tahun /
Years
2013-2017 ... 176
Tabel IV.13 Perkembangan Jumlah Mahasiswa yang Mengikuti Kegiatan di
Lembaga Pengembangan Pendidikan dan Pembelajaran (LP3)
menurut Jenis Kegiatan
Trends in Number of Students Participating in Activities in The Center For The
Development of Education and Teaching by Type of Activity
Tahun /
Years
2013-2017 ... 177
Tabel IV.14 Perkembangan Jumlah Judul dan Jumlah Eksemplar Koleksi Bahan
Pustaka Menurut Jenis Bahasa dan Golongan/Klasifikasi
Trends in Number of Titles and Volumes of Library Materials by Language and
Classification
Tahun /
Years
2013-2017 ... 179
Tabel IV.15 Perkembangan Jumlah Anggota Perpustakaan Menurut Unit Kerja
Trends in Library Membership by Unit
Tahun /
Years
2013-2017 ... 181
Tabel IV.16 Perkembangan Jumlah Pengunjung Perpustakaan
Menurut Unit Kerja
Trends in Number of Library Visitors by Unit
xi
Tabel IV.17 Perkembangan Jumlah Bahan Pustaka yang Dipinjam Menurut
Golongan/Klasifikasi
Trends in Number of Library Materials Checked-Out by Classification
Tahun /
Years
2013-2017 ... 183
Tabel IV.18 Perkembangan Pelaksanaan Kajian dan Praktik Lapangan
Menurut Jenjang Program
Trends in Implementation of Student Teaching Program by Level of Program
Tahun /
Years
2013-2017 ... 184
Tabel IV.19 Perkembangan Jumlah Mahasiswa Peserta Kajian dan Praktik
Lapangan Menurut Fakultas/Jurusan/Program Studi
Trends in Number of Students Participating in Student Teaching Program by
Faculty/Department/Program of Study
Tahun /
Years
2013/2014-2017/2018 ... 185
Tabel IV.20 Perkembangan Jumlah Mahasiswa Peserta Kajian dan Praktik
Lapangan Menurut Fakultas dan Jenjang Program
Trends in Number of Students Participating in Student Teaching Program by
Faculty and Level of Program
Tahun /
Years
2013/2014-2016/2017 ... 188
Tabel IV.21 Perkembangan Jumlah Pasien Poliklinik Menurut Jenis Pasien
Trends in Number of Patients Attending “Poliklinik”
by Type of Patient
Tahun /
Years
2013-2017 ... 189
Tabel IV.22 Perkembangan Hasil Pembangunan Fisik Kampus
Trends in Results of Physical Building of The Campus
Tahun /
Years
2013-2017 ... 190
Tabel IV.23 Hasil Pembangunan Gedung Pendidikan dan Penambahan
Pembangunan
Pada Tahun 2013-2017
Results of Construction of Educational Buildings and Additional Development
in The Years
2013-2017 ... 195
Tabel IV.24 Perkembangan Sarana dan Prasarana
Trends in Facilities and Infrastructures
Tahun /
Years
2013-2017 ... 197
Tabel IV.25 Perkembangan Jumlah Anggaran Belanja Terpadu Menurut
Sumber Dana
Trends in Integrated Budget Spending by Source of Funds
xii
Tabel IV.26 Perkembangan Jumlah Anggaran Menurut Fungsinya
Trends in Budget by Function
Tahun Anggaran /
Fiscal Years
2013-2017 ... 199
Grafik IV.2 Grafik Perkembangan Jumlah Anggaran Menurut Fungsinya
Graph of Trends in Budget by Function
Tahun Anggaran /
Fiscal Years
2013-2017 ... 200
Tabel IV.27 Perkembangan Jumlah Kerjasama Dalam dan Luar Negeri
Universitas Negeri Malang (UM)
Trends in Number of Partnerships Local and International
Tahun /
Years
2013-2017 ... 201
V. Ringkasan Data Tahun 2017
Data Summary in The Year 2017
... 202
Ringkasan Data Tahun 2017
xiii
Statistik Perkembangan Universitas Negeri Malang (UM) Tahun 2013-2017: diterbitkan oleh Biro Akademik, Kemahasiswaan, Perencanaan, Informasi, dan Kerjasama (BAKPIK) Universitas Negeri Malang
Statistics Development of State University of Malang (UM) YEARS 2013-2017: Published by Bureau for Academic, Student Affairs, Planning, Information, and CooperationState University of Malang
Alamat:
BAKPIK Universitas Negeri Malang (UM), Graha Rektorat Lantai 2, Jl. Semarang 5, Malang 65145 Telepon (0341) 551-312 , pesawat 1130, 1132, 1143; Sambungan langsung (Telp./Fax.) (0341) 552-114
Homepage:www.um.ac.id
E-mail: info@um.ac.id
Address:
BAKPIK State University of Malang, Graha Rektorat 2nd Floor, Jl. Semarang5 Malang 65145
Phone (0341) 551-312 Ext. 1130, 1132, 1143; Phone/Fax. (0341) 552-114 Homepage:www.um.ac.id
E-mail: info@um.ac.id
xiv
KATA PENGANTAR
PREFACE
Penerbitan Buku Statistik
Perkembangan Universitas Negeri
Malang (UM) Tahun 2013-2017 ini
merupakan kelengkapan dari Laporan
Tahunan Rektor Tahun 2017 dan
laporan lainnya yang sejenis.
Buku ini menyajikan data
perkembangan sejak tahun 2013
sampai dengan tahun 2017 (data
Desember 2017) yang disajikan dalam
bentuk grafik/gambar dan tabel.
Penerbitan ke dua puluh tujuh ini
merupakan sajian yang ke sembilan
belas dalam dua bahasa yaitu bahasa
Indonesia dan bahasa Inggris.
Diharapkan berbagai data yang
disajikan dapat dijadikan sebagai
informasi bagi sivitas akademika
maupun masyarakat luas dan masukan
untuk bahan pertimbangan penetapan
kebijakan, pengambilan keputusan dan
langkah-langkah lain untuk
perencanaan baik jangka pendek
maupun jangka panjang serta evaluasi
program bagi pimpinan serta berbagai
pihak yang berkepentingan.
Kepada semua pihak yang telah
membantu menyiapkan dan menyusun
Statistik Perkembangan Universitas
Negeri Malang (UM) tahun 2013-2017
ini, kami sampaikan terima kasih
terutama kepada Kepala Bagian
Perencanaan dan Sistem Informasi,
Kepala Sub Bagian Sistem Informasi
beserta staf, Ibu Dr. Mirjam
Anugerahwati, M.A, Bapak
The publication of the
2013-2017
Book of Statistical Development of
State University of Malang is a
supplement to the Rector's 2017
Annual Report and other similar
reports.
This book presents development data
from the year 2013 to the year 2017
(data December 2017) in the form of
graphs/figures and
tables.
This 27
thpublication is the
bilingual edition: Indonesian and
English. It is hoped that the various
data presented here will be of use
as a source of information for both
the 'civitas academica' and the
public, and as input for
consideration in policy and
decision making as well as for
other measures in short-term and
long-term planning. The data might
also be of use for program
evaluations by the officers of
administration as well as other
concerned parties.
We are deeply indebted to all those
who have assisted in preparing and
organizing this 2013-2017 Statistical
Development of State University of
Malang. In particular we wish to
thank the Head of Planning and
Information System Division, the
Head of Information System
Sub-Division and Staff,
xv
M. Moehnilabib,M.A., Bapak
Yuswotomo, M.Pd, Bapak Prof. Dr.
Gunadi Harry Sulistyo, M.A. dan Ibu
Prof. Hj. Utami Widiati, M.A., Ph.D.
yang telah membantu menyajikan dalam
bahasa Inggris. Demikian juga kepada
unit-unit terkait di lingkungan
Universitas Negeri Malang (UM) yang
telah ikut melengkapi isi buku ini.
Saran dan komentar yang
konstruktif sangat kami harapkan
untuk bahan penyempurnaan
terbitan mendatang.
Malang, Januari 2018
Wakil Rektor IV,
M. Moehnilabib, M.A.,
Drs. Yuswotomo, M.Pd, Prof. Dr.
Gunadi Harry Sulistyo, M.A. and
Prof. Dra. Hj. Utami Widiati, M.A.,
Ph.D. who translated the text into
English. Our gratitude also goes to
other units in State University of
Malang which have provided data for
this book.
Constructive comments and
suggestions will be much
appreciated for the improvement of
future editions.
Malang, January 2018
Vice Rector IV,
KESIMPULAN UMUM
GENERAL CONCLUSION
MAHASISWA
Jumlah mahasiswa terdaftar Universitas
Negeri Malang (UM) pada tahun 2017: 32.958
orang, naik 13,23% jika dibandingkan dengan
tahun 2013: 29.106 orang. Perkembangan
tiap tahunnya dengan sebaran sebagai berikut:
tahun 2014 naik 4,78 %, 2015 naik 2,98 %,
2016 naik 4,51 %, dan 2017 naik 9,56%.
Penerimaan mahasiswa baru dalam
lima tahun terakhir ini rata-rata setiap
tahunnya naik 4,58% dan daya tampung
turun 1,35%. Adapun perkembangan
penerimaan mahasiswa baru adalah sebagai
berikut: tahun 2014 turun 6,99%, 2015 naik
3,80%, 2016 turun 1,01%, dan 2017 naik
16,12%.
Lulusan Universitas Negeri Malang pada
tahun 2017: 7.406 orang, naik 41,88% bila
dibandingkan dengan tahun 2013. Adapun
perkembangan lulusan adalah sebagai berikut:
2014 naik 3,03%, 2015 naik 9,13%, 2016 naik
1,41% dan 2017 naik 24,43%. Sedangkan
produktivitas rata-rata per tahunnya sebesar
19,53%, dengan rincian sebagai berikut: tahun
2014 sebesar 17,63%, tahun 2015 sebesar
19,62%, tahun 2016 sebesar 17,5%, dan tahun
2017 sebesar 22,47%.
DOSEN
Jumlah dosen sampai dengan bulan
Desember 2017: 861 orang, turun 5,07%
dari tahun 2013, dengan sebaran sebagai
berikut: tahun 2014 naik 1,10%, 2015 naik
2,07%, 2016 turun 2,10%, dan 2017 turun
2,71%.
Dosen yang mencapai gelar Master/
Magister dan Doktor mengalami kenaikan
2,38% dari tahun 2013. Rinciannya adalah:
tahun 2014 naik 3,21%, tahun 2015 naik
4,15%, tahun 2016 turun 2,10%, dan tahun
2017 turun 2,71%. Rata-rata per tahunnya
turun 2,01%. Bila dibandingkan dengan
jumlah dosen secara keseluruhan, dosen yang
mencapai gelar Master/Magister dan Doktor
STUDENTS
The number of student in the State
University of Malang in the year 2017:
32.958 people, increased by 13,23%
compared to the year 2013: 29.106
people. The trend for each year is as
follows: in 2014 increased 4,78%. 2015
increased 2,98%, 2016 increased 4,51%,
and 2017 increased 9,56%.
The enrolment of new students in the
last five YEARS has increased by 4,58%
on average and the capacity has
decreased 1,35%. The trend of enrolment
is as follows: 2014 decreased 6,99%, 2015
increased 3,80%, 2016 increased 1,01%, and
2017 increased 16,12%.
The graduates of State University of
Malang in 2017:7.406 people, increased
by 41,88% compared 2013. The trend of
graduates is as follow: 2014 increased by
3,03%, 2015 increased by 9,13%, 2016
increased by 1,41%, and 2017 increased
by 24,43%. The average productivity
every year is 19,53% with the following
details in, 2014: 17,63%, 2015: 19,62%,
2016: 17,5, and 2017:22,47%.
TEACHING STAFF
The number of the teaching staff up to
December 2017: 861 people, has decreased
by 5,07% from that in 2013, and the
distribution is as follows 2014 is increased
by 1,10%, 2015 is increased by 2,07%, and
2016 is decreased by 2,10%, and 2017
decreased by 2,71%.
xvii
pada tahun 2017 mencapai 99,88% (meningkat
2,42% dibanding tahun yang lalu). Di samping
itu, pada tahun 2017 ini dosen yang sedang
studi program Master/Magister dan Doktor
mencapai 14,40%.
Seiring dengan penurunan jumlah dosen,
terdapat penurunan jumlah dosen golongan IV
turun 7,37%, demikian pula untuk golongan
III turun 2,83% dari tahun 2013. Sampai
dengan tahun 2017 jumlah dosen golongan III
(51,80%) dengan dosen golongan IV
(48,20%). Sedangkan dosen yang bergelar
Profesor pada tahun 2017 naik 14,49%
dibanding pada tahun 2013.
TENAGA KEPENDIDIKAN
Jumlah tenaga kependidikan sampai
dengan bulan Desember 2017: 663orang,
turun 3,07% dari tahun 2013, dengan
sebaran sebagai berikut: pada 2014 turun
0,44%, 2015 naik 7,05%, 2016 turun
4,80%, dan 2017 turun 4,47%.
Dilihat dari tingkat pendidikannya,
selama kurun waktu lima tahun terakhir
terdapat kecenderungan penurunan jumlah
tenaga kependidikan ke jenjang pendidikan
yang lebih tinggi. Jika dibandingkan
dengan tahun 2016 untuk yang
berpendidikan SD turun 2,70%; SLTP
turun 2,94%; SMTA turun 5,46%; Sarjana
Muda turun 9,09%; dan Sarjana turun
2,53%. Sedangkan untuk yang
berpendidikan Magister/Master 3,32%.
Selain itu setiap tahunnya rata-rata 91,70%
mengikuti berbagai program pendidikan
tambahan berupa seminar, lokakarya,
kursus, dan program peningkatan
kemampuan sejenis lainnya.
Peningkatan jumlah tenaga
kependidikan ke jenjang pendidikan yang
lebih tinggi ini sejalan dengan peningkatan
golongan kepangkatan. Hal ini dapat dilihat
pada perkembangan golongan kepangkatan
bila dibandingkan tahun 2013 adalah
sebagai berikut: golongan I turun 29,31%,
golongan II naik 10,74%, golongan III turun
7,83%, dan golongan IV turun 7,69%.
degrees in the year 2017 was 99,88% (a
2,42% increased from the previous year).
Besides, in 2017 the number of staff
studying for Master/Magister and
Doctoral degrees was 14,40%.
Along with the decrease in the number
of staff, there was an decrease in the
number of staff in group IV decreased by
7,37%, while the number of staff in group
III increased by 2,82% from 2013. Up to
the year 2017 in the number of staff in
group III (51,80%) and group IV (48,20%).
Staff with “professorship” in
2017 a
increase of 14,49% compared to 2013.
ADMINISTRATIVE STAFF
The number of administrative staff up
to December 2017:663 people, decreased
by 3,07% from 2013, with the distribution
as follows: in 2014 decreased by 0,44%,
2015 increased by 7,05%, 2016 decreased by
4,80% and 2017 decreased 4,47%.
In terms of educational level, the past
five YEARS have seen the tendency of
decreased of administrative staff to a
higher level compared to 2016, graduates
of Elementary School decreased by
2,70%; Junior Secondary School (SLTP)
decreased by 2,94%; Senior Secondary
School (SMTA) decreased by 5,46%;
Bachelors decreased by 9,09%; and full
degrees decreased by 2,53%. Staff with
Master/Magister still by 3,32%. In
addition, every year on average 91,70%
administrative staff joins various extra
training programs such as seminars,
workshops, courses, and other up-grading
programs.
The increase in the number of
admini-strative staff to a higher educational level
was in line with the increase in positional
level. This can be seen from the decreased
from 2013: group I decreased by more
29,31%, group II increase by 10,74%,
group III decreased by 7,83%, and group
IV increased by 7,69%.
Secara kuantitatif perbandingan jumlah
tenaga kependidikan pada tahun 2017 yang
berpendidikan SD 5,43%; SLTP 4,98%;
SMTA 49,62%; Sarjana Muda 7,54%; Sarjana
29,11%; dan Magister/Master 3,32%
Jumlah tenaga teknisi/laboran tetap
sampai dengan bulan Desember 2017
sebanyak 87 orang (naik 74%) dari tahun
2013, dengan sebaran sebagai berikut: 2014
naik 64,00 %, 2015 naik 2,44 % , 2016 turun
9,52%, dan 2017 naik 14,47%.
PENELITIAN
Jumlah judul penelitian sampai dengan
tahun 2017 sebanyak 120, turun 62,03%
dari tahun 2013, sedangkan peran serta dosen
turun 57,64%. Pada tahun 2017 jumlah
judul penelitian yang telah dilaksanakan
sebanyak 120 judul melibatkan 305 dosen.
Dibandingkan dengan jumlah dosen pada
saat ini, rasio judul dengan dosen mencapai
1:7 dan rasio peran serta dosen dengan
jumlah dosen mencapai 1:3.
PENGABDIAN KEPADA MASYARAKAT
Jumlah judul pengabdian kepada
masyarakat pada tahun 2017, turun 84,21%
dari tahun 2013, sedangkan peran serta
dosen turun 84,75%. Pada tahun 2017 telah
dilaksanakan 3 judul melibatkan 9 dosen.
Jika dibandingkan dengan jumlah dosen
yang ada saat ini, rasio judul dengan dosen
mencapai 1:287, dan rasio peran serta
dosen dengan jumlah dosen mencapai 1:96
Jumlah mahasiswa KKN dari tahun 2013
hingga tahun 2017, cenderung naik. Pada
tahun 2014 naik 39,81%, tahun 2015 naik
8,51%, tahun 2016 naik 3,19% dan tahun
2017 naik 10,58%. Jumlah Dosen
Pembimbing Lapangan (DPL), pada tahun
2014 naik 63,16%, pada tahun 2015 naik
38,71%, dan pada tahun 2016 turun 16,28%
dan tahun 2017 tetap.
PERPUSTAKAAN
Koleksi bahan pustaka s.d tahun 2017,
jumlah judul naik 34,06% dan jumlah
eksemplar naik 33,78% dibandingkan tahun
of administrative staff in 2017 Who are
Elementary School 5,43%; Junior High
School 4,98%; Senior High School 49,62%;
Bachelor 7,54%; Full degree 29,11%;
Master/Magister 3,32%.
The number of permanent technicians/
Laboratory up to December 2017 was 87
(increased of 74%) from the year 2013,
with the distribution as follows: in 2014
increased by 64,00%, 2015 increased by
2,44%, 2016 decreased by 9,52 % and
2017 increased by 14,47%.
RESEARCH
The number of research titles up to
2017 was 120, decreased by 62,03% from
2013, while staff participation decreased
by 57,64%. In 2017 research that was
completed numbered 120 titles involving
305 staff members. Compared to the
number of staff, the ratio between titles
and staff was 1:7, and the ratio between staff
participation and number of staff was 1:3.
COMMUNITY SERVICE
The number of titles for community service
in 2017, decreased by 84,21% from 2013,
while staff participation decreased by 84,75%.
In 2017, 3 titles were conducted involving 9
staff. Compared to the number of staff
mem-bers, the ratio of titles and the staff was 1:287,
and the ratio of lecturer participation and
number of lecturers was 1:96.
The number of students joining
“KKN” from
2013 up to 2017 shows
tends to up. In 2014 increased by 39,81%,
in 2015 increased by 8,51%, in 2016
increased by 3,19%, and 2017 increased
10,58%. The number of Field
Supervisor,in 2014 increased 63,16, in
2015 increased by 38,71%, in 2016
decreased by 16,28% and fixed in 2017.
LIBRARY
xix
2013. Menurut jenis koleksi, tahun 2017
adalah bahan pustaka berbahasa nasional
(66,21%/judul, 81,10%/eksemplar),
berbahasa inggris (31,25%/judul,
17,73%/eksemplar), dan berbahasa asing
(2,54%/judul, 1,18%/ eksemplar).
Anggota perpustakaan: 32.011 orang,
turun 24,05% dari tahun 2013. Pengunjung
perpustakaan sebanyak 247.700
orang, naik
51,70% dari tahun 2013.
KAJIAN DAN PRAKTEK LAPANGAN
Mahasiswa peserta Kajian dan
PraktekLapangan (KPL) tahun 2017, naik
23,20% dari tahun 2013, Guru Pamong
naik 17,68%, Dosen Pembimbing
Lapangan naik 113,41%, dan Sekolah
Latihan naik 60.18%.
for the number of items compared to
2013. In terms of the kinds of library
materials in 2017, the order of numbers is
as follows: in Indonesia language
(66,21% titles, 81,10% items), English
(31,25% titles 17,73% items), foreign
language (2,54% titles, 1,18% items).
Library members numbered 32.011
people, an decreased of 24,05% from
2013. Visitors to the library numbered
247.700 people, increased of 51,70% from
2013.
STUDENT TEACHING
I.
Da
ta
M
a
h
a
sisw
a
3
GRAFIK I.1
GRAFIK PERKEMBANGAN JUMLAH DAYA TAMPUNG,
MAHASISWA BARU, MAHASISWA TERDAFTAR, DAN LULUSAN
GRAPH OF TRENDS IN CAPACITY FOR
NEW STUDENTS, REGISTERED STUDENTS, AND GRADUATES
TAHUN /
YEARS
2013-2017
0
3000
6000
9000
12000
15000
18000
21000
24000
27000
30000
33000
2013
2014
2015
2016
2017
5,220
5,378
5,869
5,952
7,406
8,287
7,708
8,001
7,920
9,197
8,496
8,844
8,909
8,528
8,202
29,106
30,496
31,405
32,820
32,958
Lulusan / Graduates
Mahasiswa Baru / New Students
S
T
AT
IS
T
IK
UM
2
0
1
3
-2
0
1
7
TABEL I.1
PERKEMBANGAN JUMLAH DAYA TAMPUNG MAHASISWA BARU,
MAHASISWA TERDAFTAR, LULUSAN, DAN PRODUKTIVITAS
TRENDS IN CAPACITY FOR NEW STUDENTS,
REGISTERED STUDENTS, GRADUATES, AND PRODUCTIVITY
TAHUN /
YEARS
2013-2017
No. Jenjang Program/
Level of Program
Daya Tampung / Capacity Mahasiswa Baru /
New Students
Mahasiswa Terdaftar /
Registered Students Lulusan / Graduates
Produktivitas /
Productivity %
2013 2014 2015 2016 2017 2013 2014 2015 2016 2017 2013 2014 2015 2016 2017 2013 2014 2015 2016 2017 2013 2014 2015 2016 2017
1. S3-K 582 582 582 492 310 192 147 139 219 246 741 720 739 795 845 103 107 117 187 228 16,75 14,44 16,57 23,52 26,98
2. S2-K 1.386 1.3861.386 1.211 1045 861 884 815 833 1101 2.449 2.448 2.295 2.426 2.505 668 822 861 822 1.107 34,63 33,56 38,58 33,88 44,19
3. S2-NK 66 66 66 79 145 7 23 33 70 76 14 33 46 113 156 - 4 6 9 27 - 28,57 13,64 7,96 17,30
4. S1-NK 1.765 2.2152.215 2.094 2.116 2.038 2.207 2.370 2.272 2.657 6.587 7.590 8.596 9.389 11.857 899 946 1.039 1.178 1.566 17,00 14,36 13,97 12,55 13,20
5. S1-K 4.277 4.1104.175 4.262 4.251 4.849 4.133 4.389 4.405 3.869 18.40218.704 18.750 19.323 16.893 3.085 3.088 3.446 3.274 4.109 19,51 16,78 19,51 16,94 24,32
6. D3-NK 420 485 485 390 335 340 314 255 131 248 913 1.001 979 774 702 251 164 222 274 261 30,31 17,96 23,82 35,40 37,17
7. PPG 214 247 178 208 108
Jumlah/Total 8.496 8.844 8.909 8.528 8.202 8.287 7.708 8.001 7.920 9.197 29.106 30.496 31.405 32.820 32.958 5.220 5.378 5.869 5.952 7.406 20,45 17,63 19,62 17,50 22,47
Keterangan / Note:
Da
ta
M
a
h
a
sisw
a
5
GRAFIK I.2
GRAFIK PERKEMBANGAN JUMLAH PEMINAT UNIVERSITAS NEGERI MALANG
MENURUT JALUR SELEKSI
GRAPH OF TRENDS IN NUMBER OF STATE UNIVERSITY OF MALANG’S APPLICANTS
BY LANE ADMISSION
TAHUN /
YEARS
2013-2017
29,297
60,329
63,738
47,535
37,472
46,870
43,588
45,838
45,608
47,487
25,213
19,686
14,423
16,438
18,312
0
10,000
20,000
30,000
40,000
50,000
60,000
70,000
2013
2014
2015
2016
2017
6
STATISTIK UM 2013-2017
TABEL I.2
PERKEMBANGAN JUMLAH PEMINAT UNIVERSITAS NEGERI
MALANG JALUR SNMPTN MENURUT FAKULTAS/JURUSAN/
PROGRAM STUDI DAN JENJANG PROGRAM
TRENDS IN NUMBER OF APPLICANTS FOR ADMISSION TO STATE
UNIVERSITY OF MALANG BY FACULTY/DEPARTMENT/PROGRAM OF
STUDY AND LEVEL OF PROGRAM THROUGH SNMPTN
TAHUN /
YEARS
2013-2017
Fakultas/Jurusan/Program Studi Faculty/Department/Program of Study
Jenjang Program/
Level of Program 2013 2014 2015 2016 2017
Fakultas Ilmu Pendidikan
Faculty of Education S1-K 4.379 9.132 8.313 6.227 4.682
1. Bimbingan dan Konseling
Guidance and Counseling S1-K 671 1.441 1.345 1.064 719
2. Teknologi Pendidikan
Educational Technology S1-K 171 700 594 402 295
3. Pendidikan Luar Sekolah
Informal/In-community Education S1-K 62 289 286 210 157
4. Administrasi Pendidikan
Educational Administration S1-K 217 804 908 648 508
5. Pendidikan Guru Sekolah Dasar
Elementary School Teacher Education S1-K 2.718 4.555 3.946 2.984 2.274
6. Pendidikan Anak Usia Dini
Early Childhood Education S1-K 342 808 762 515 396
7. Pendidikan Luar Biasa
Special Education S1-K 198 535 472 404 333
Fakultas Sastra Faculty of Letters
S1-NK 1.416 2.828 2.747 2.453 1.894
S1-K 3.066 5.313 5.192 3.927 3.098
1. Bahasa dan Sastra Indonesia
Indonesian Language and Literature S1-NK 426 878 855 598 391
2. Pendidikan Bahasa dan Sastra Indonesia
Indonesian Language and Literature Education S1-K 935 1.774 1.804 1.384 1032
3. Ilmu Perpustakaan
Librarianship Science S1-NK - - - 423 456
4. Bahasa dan Sastra Inggris
English Language and Literature S1-NK 609 1.270 1.159 961 686
5. Pendidikan Bahasa Inggris
English Education S1-K 1.227 1.852 1.646 1.253 1053
6. Pendidikan Bahasa Arab
Foreign Language/Arabic Education S1-K 493 697 731 603 499
7. Pendidikan Bahasa Jerman
German Education S1-K 70 273 222 161 162
8. Pendidikan Bahasa Mandarin
Mandarin Education S1-K 76 181 200 153 96
9. Desain Komunikasi Visual
Visual Communication Design S1-NK 381 680 733 471 361
10.Pendidikan Seni Rupa
Fine Arts Education S1-K 164 323 370 234 145
11.Pendidikan Seni Tari dan Musik
Performing Arts (Dance) and Music Education S1-K 101 213 219 139 111
Fakultas Matematika dan Ilmu Pengetahuan Alam Faculty of Mathematics and Science
S1-NK 1.138 2.669 2.783 2.348 1.987
S1-K 3.518 5.626 5.300 4.540 3.801
1. Matematika
Data Mahasiswa
7
Fakultas/Jurusan/Program StudiFaculty/Department/Program of Study
Jenjang Program/
Level of Program 2013 2014 2015 2016 2017
2. Pendidikan Matematika
Mathematics Education S1-K 1.330 1.428 1.418 1.435 1.195
3. Fisika
Physics S1-NK 112 437 440 320 289
4. Pendidikan Fisika
Physics Education S1-K 484 1.029 869 674 483
5. Kimia
Chemistry S1-NK 312 731 709 490 495
6. Pendidikan Kimia
Chemistry Education S1-K 604 1.074 872 727 666
7. Pendidikan IPA
Science Education S1-K 170 638 648 463 519
8. Biologi
Biology S1-NK 353 875 881 802 708
9. Pendidikan Biologi
Biology Education S1-K 930 1.457 1.493 1.241 938
Fakultas Ekonomi Faculty of Economics
S1-NK 5.704 11.377 12.012 8.570 6.726
S1-K 1.532 3.879 3.977 2.893 2.276
1. Manajemen
Management S1-NK 2.876 5.739 6.109 4.305 3.455
2. Pendidikan Tata Niaga
Business Education S1-K 89 364 348 263 167
3. Pendidikan Administrasi Perkantoran
Office Administration Education S1-K 691 1.784 1.918 1.300 1.133
4. Akuntansi
Accountancy. S1-NK 2.325 3.861 3.927 2.787 2.168
5. Pendidikan Akutansi
Accounting Education S1-K 340 693 729 594 417
6. Pendidikan Ekonomi
Economics Education S1-K 412 1.038 982 736 559
7. Ekonomi dan Studi Pembangunan
Ecomonics and Development Study S1-NK 503 1.777 1.976 1.478 1.103
Fakultas Teknik Faculty of Engineering
S1-NK 666 1.084 6.722 4.322 3.514
S1-K 3.995 7.583 5.322 3.967 3.023
1. Pendidikan Teknik Mesin
Mechanical Engineering Education S1-K 339 793 473 411 285
2. Teknik Mesin
Mechanical Engineering S1-NK - - 1.193 861 576
3. Pendidikan Teknik Otomotif
MechanicalOtomotif Education S1-K 387 768 502 434 333
4. Pendidikan Teknik Bangunan
Civil Engineering Education S1-K 123 547 484 376 249
5. Teknik Sipil
Civil Engineering S1-NK 666 1.084 1.354 1.082 1.175
6. Pendidikan Teknik Informatika
Information Engineering Education S1-K 2.089 2.826 1.446 955 791
7. Teknik Informatika
Information Engineering S1-NK - - 3.101 1.656 1.282
8. Pendidikan Teknik Elektro
Electrical EngineeringEducation S1-K 296 969 509 385 269
9. Teknik Elektro
Electrical Engineering S1-NK - - 1.074 723 481
10.Pendidikan Tata Boga
Food Product Technology S1-K 424 917 1.076 754 574
11.Pendidikan Tata Busana
8
STATISTIK UM 2013-2017
Fakultas/Jurusan/Program Studi Faculty/Department/Program of StudyJenjang Program/
Level of Program 2013 2014 2015 2016 2017
Fakultas Ilmu Keolahragaan Faculty of Sport Science
S1-NK 91 2.160 2.017 1.323 1.101
S1-K 845 1.053 957 588 316
1. Pendidikan Jasmani dan Kesehatan
Phisic and Health Education S1-K 658 736 670 399 220
2. Ilmu Keolahragaan
Sports Science S1-NK 91 114 106 64 39
3. Pendidikan Kepelatihan Olahraga
Sport Coaching Education S1-K 187 317 287 189 96
4. Ilmu Kesehatan Masyarakat
Community Health Science S1-NK - 2.046 1.911 1.259 1062
Fakultas Ilmu Sosial Faculty of Social Science
S1-NK 364 1.191 1.385 834 692
S1-K 1.103 3.099 3.769 3.261 2.716
1. Pendidikan Pancasila dan Kewarganegaraan
Civics and Pancasila Education S1-K 161 638 384 504 379
2. Pendidikan Sejarah
History Education S1-K 261 834 460 740 527
3. Ilmu Sejarah
History S1-NK 116 373 654 251 199
4. Pendidikan IPS
Social Sciences Education S1-K 143 560 880 398 331
5. Pendidikan Geografi
Geography Education S1-K 538 1.067 1.035 790 724
6. Geografi
Geography S1-NK 248 818 731 583 493
7. Pendidikan Sosiologi
Sociologys Education S1-K - - 1.010 829 755
Fakultas Pendidikan Psikologi
Faculty of Educational Psychology S1-NK 1.480 3.335 3.242 2.282 1.446
1. Psikologi
Psychology S1-NK 1.480 3.335 3.242 2.282 1.446
Jumlah / Total
S1-NK 10.859 24.644 30.908 22.132 17.560
S1-K 18.438 35.685 32.830 25.403 19.912
UM 29.297 60.329 63.738 47.535 37.472
Keterangan / Note: NK : Non Kependidikan / Non Education
Data Mahasiswa
9
TABEL I.3
PERKEMBANGAN JUMLAH PEMINAT UNIVERSITAS NEGERI
MALANG JALUR SBMPTN MENURUT FAKULTAS/JURUSAN/
PROGRAM STUDI DAN JENJANG PROGRAM STUDI
TRENDS IN NUMBER OF APPLICANTS FOR ADMISSION THROUGH
STATE ADMISSION TO STATE UNIVERSITY OF MALANG BY FACULTY/
DEPARTMENT/PROGRAM OF STUDY AND LEVEL OF PROGRAM
TAHUN /
YEARS
2013-2017
Fakultas/Jurusan/Program Studi Faculty/Department/Program of Study
Jenjang Program/
Level of Program 2013 2014 2015 2016 2017
Fakultas Ilmu Pendidikan
Faculty of Education S1-K 6.424 5.868 5.498 5.513 5.692
1. Bimbingan dan Konseling
Guidance and Counseling S1-K 1.167 885 937 927 982
2. Teknologi Pendidikan
Educational Technology S1-K 410 474 381 422 458
3. Pendidikan Luar Sekolah
Informal/In-community Education S1-K 314 317 321 298 315
4. Administrasi Pendidikan
Educational Administration S1-K 635 762 724 796 806
5. Pendidikan Guru Sekolah Dasar
Elementary School Teacher Education S1-K 2.792 2.477 2.256 2130 2.167
6. Pendidikan Anak Usia Dini
Early Childhood Education S1-K 614 526 500 469 493
7. Pendidikan Luar Biasa
Special Education S1-K 492 427 379 471 471
Fakultas Sastra Faculty of Letters
S1-NK 2.192 2.585 2.486 3.314 3.076
S1-K 4.067 3.849 3.603 3.842 3.823
1. Bahasa dan Sastra Indonesia
Indonesian Language and Literature S1-NK 643 629 611 571 596
2. Pendidikan Bahasa dan Sastra Indonesia
Indonesian Language and Literature Education S1-K 1.279 1.199 1.078 1.087 1.087
3. Ilmu Perpustakaan
Librarianship Science S1-NK - - - 810 563
4. Bahasa dan Sastra Inggris
English Language and Literature S1-NK 910 872 914 909 930
5. Pendidikan Bahasa Inggris
English Education S1-K 1.407 1.110 966 1.070 1.086
6. Pendidikan Bahasa Arab
Foreign Language/Arabic Education S1-K 532 467 580 625 628
7. Pendidikan Bahasa Jerman
German Education S1-K 230 206 179 205 219
8. Pendidikan Bahasa Mandarin
Mandarin Education S1-K 164 161 159 167 158
9. Desain Komunikasi Visual
Visual Communication Design S1-NK 639 1.084 961 1.024 987
10.Pendidikan Seni Rupa
Fine Arts Education S1-K 295 422 361 393 404
11.Pendidikan Seni Tari dan Musik
Performing Arts (Dance) and Music Education S1-K 160 284 280 295 241
Fakultas Matematika dan Ilmu Pengetahuan Alam Faculty of Mathematics and Science
S1-NK 2.938 2.589 2.269 2.543 2.473
S1-K 5.157 4.328 3.713 3.742 3.963
1. Matematika
Mathematics S1-NK 737 683 650 770 759
10
STATISTIK UM 2013-2017
Fakultas/Jurusan/Program Studi Faculty/Department/Program of Study
Jenjang Program/
Level of Program 2013 2014 2015 2016 2017
Mathematics Education 3. Fisika
Physics S1-NK 571 524 396 435 391
4. Pendidikan Fisika
Physics Education S1-K 834 766 616 444 475
5. Kimia
Chemistry S1-NK 836 584 546 508 519
6. Pendidikan Kimia
Chemistry Education S1-K 1.114 625 554 582 607
7. Pendidikan IPA
Natural Science Education S1-K 562 826 670 647 819
8. Biologi
Biology S1-NK 794 798 677 830 804
9. Pendidikan Biologi
Biology Education S1-K 1.208 998 912 912 992
Fakultas Ekonomi Faculty of Economics
S1-NK 7.548 6.772 6.953 6.587 6.624
S1-K 3.003 2.642 2.580 2.597 2.433
1. Manajemen
Management S1-NK 3.536 3.073 3.196 3.090 3.342
2. Pendidikan Tata Niaga
Business Education S1-K 370 302 342 316 287
3. Pendidikan Administrasi Perkantoran
Office Administration Education S1-K 1.188 9.94 1.011 1.021 1.064
4. Pendidikan Akuntansi
Accounting Education S1-K 711 560 555 528 490
5. Akuntansi
Accountancy S1-NK 2.487 2.202 2.093 2.008 1.936
6. Pendidikan Ekonomi
Economics Education S1-K 734 786 672 732 592
7. Ekonomi dan Studi Pembangunan
Ecomonics and Development Study S1-NK 1.525 1.497 1.664 1.489 1.346
Fakultas Teknik Faculty of Engineering
S1-NK 1.335 1.496 6.490 5.044 5260
S1-K 5.645 5.337 3.647 3.626 4646
1. Pendidikan Teknik Mesin
Mechanical Engineering Education S1-K 649 688 356 413 396
2. Pendidikan Teknik Otomotif
Automotive Engineering Education S1-K 574 539 407 407 366 3. Teknik Mesin
Mechanical Engineering S1-NK - - 1.129 965 928
4. Pendidikan Teknik Bangunan
Civil Engineering Education S1-K 412 357 356 397 373
5. Teknik Sipil
Civil Engineering S1-NK 1.335 1.496 1.500 1.462 1.685
6. Pendidikan Teknik Informatika
Information Engineering Education S1-K 2.331 1.949 923 787 808
7. Teknik Informatika
Information Engineering S1-NK - - 2.832 1.813 1.860
8. Pendidikan Teknik Elektro
Electro Engineering Education S1-K 690 767 391 402 364
9. Teknik Elektro
Electro Engineering S1-NK - - 1.029 804 787
10.Pendidikan Tata Boga
Food Product Technology Education S1-K 567 548 683 657 790
11.Pendidikan Tata Busana
Clothing Design TechnologyEducation S1-K 422 489 531 563 611
Data Mahasiswa
11
Fakultas/Jurusan/Program Studi Faculty/Department/Program of Study
Jenjang Program/
Level of Program 2013 2014 2015 2016 2017
Industrial Engineering Fakultas Ilmu Keolahragaan Faculty of Sport Science
S1-NK 1.694 1.588 1.389 1.484 1.667
S1-K 1.114 1.429 1.390 1.401 1.487
1. Pendidikan Jasmani dan Kesehatan
Sports and Health Education S1-K 751 909 917 936 975
2. Ilmu Keolahragaan
Sports Science S1-NK 200 372 299 424 337
3. Pendidikan Kepelatihan Olahraga
Sport Coaching Education S1-K 363 520 473 465 512
4. Ilmu Kesehatan Masyarakat
Community Health Science S1-NK 1.494 1.216 1.090 1.060 1.330
Fakultas Ilmu Sosial Faculty of Social Science
S1-NK 964 811 746 863 963
S1-K 2.786 2.422 3.482 3.255 3.218
1. Pendidikan Pancasila dan Kewarganegaraan
Civics and Pancasila Education S1-K 778 472 521 604 584
2. Pendidikan Sejarah
History Education S1-K 607 647 536 644 614
3. Ilmu Sejarah
History S1-NK 457 275 277 302 339
4. Pendidikan IPS
Social Sciences Education S1-K 480 508 433 502 452
5. Pendidikan Geografi
Geography Education S1-K 921 795 656 759 693
6. Geografi
Geography S1-NK 507 536 469 561 624
7. Pendidikan Sociology
Sociology Education S1-K - - 1.336 746 875
Fakultas Pendidikan Psikologi
Faculty of Educational Psychology S1-NK 2.003 1.872 1.592 1.797 2.162
1. Psikologi
Psychology S1-NK 2.003 1.872 1.592 1.797 2.162
Jumlah / Total
S1-NK 18.674 17.713 21.925 21.632 22.225
S1-K 28.196 25.875 23.913 24.304 25.262
UM 46.870 43.588 45.838 45.608 47.487
Keterangan / Note:
12
STATISTIK UM 2013-2017
TABEL I.4
PERKEMBANGAN JUMLAH PEMINAT UNIVERSITAS NEGERI
MALANG JALUR SELEKSI MANDIRI MENURUT FAKULTAS/
JURUSAN/PROGRAM STUDI DAN JENJANG PROGRAM STUDI
TRENDS IN NUMBER OF APPLICANTS FOR ADMISSION THROUGH
INTERNALLY-BASED SELECTION TO STATE UNIVERSITY OF MALANG
BY FACULTY/DEPARTMENT/PROGRAM OF STUDY AND LEVEL OF PROGRAM
TAHUN /
YEARS
2013-2017
Fakultas/Jurusan/Program Studi Faculty/Department/Program of Study
Jenjang Program/
Level of Program 2013 2014 2015 2016 2017
Fakultas Ilmu Pendidikan
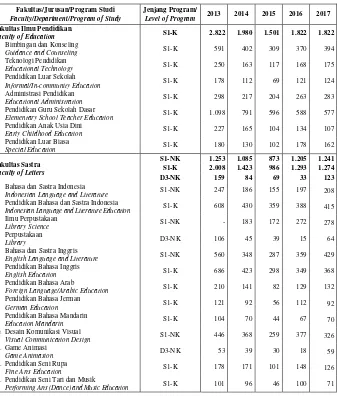
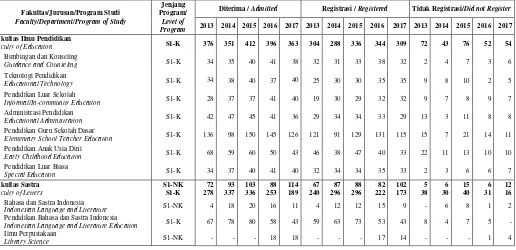
Faculty of Education S1-K 2.822 1.980 1.501 1.822 1.822
1. Bimbingan dan Konseling
Guidance and Counseling S1-K 591 402 309 370 394
2. Teknologi Pendidikan
Educational Technology S1-K 250 163 117 168 175
3. Pendidikan Luar Sekolah
Informal/In-community Education S1-K 178 112 69 121 124
4. Administrasi Pendidikan
Educational Administration S1-K 298 217 204 263 283
5. Pendidikan Guru Sekolah Dasar
Elementary School Teacher Education S1-K 1.098 791 596 588 577
6. Pendidikan Anak Usia Dini
Early Childhood Education S1-K 227 165 104 134 107
7. Pendidikan Luar Biasa
Special Education S1-K 180 130 102 178 162
Fakultas Sastra Faculty of Letters
S1-NK 1.253 1.085 873 1.205 1.241
S1-K 2.008 1.423 986 1.293 1.274
D3-NK 159 84 69 33 123
1. Bahasa dan Sastra Indonesia
Indonesian Language and Literature S1-NK 247 186 155 197 208
2. Pendidikan Bahasa dan Sastra Indonesia
Indonesian Language and Literature Education S1-K 608 430 359 388 415
3. Ilmu Perpustakaan
Library Science S1-NK - 183 172 272 278
4. Perpustakaan
Library D3-NK 106 45 39 15 64
5. Bahasa dan Sastra Inggris
English Language and Literature S1-NK 560 348 287 359 429
6. Pendidikan Bahasa Inggris
English Education S1-K 686 423 298 349 368
7. Pendidikan Bahasa Arab
Foreign Language/Arabic Education S1-K 210 141 82 129 132
8. Pendidikan Bahasa Jerman
German Education S1-K 121 92 56 112 92
9. Pendidikan Bahasa Mandarin
Education Mandarin S1-K 104 70 44 67 70
10.Desain Komunikasi Visual
Visual Communication Design S1-NK 446 368 259 377 326
11.Game Animasi
Game Animasion D3-NK 53 39 30 18 59
12.Pendidikan Seni Rupa
Fine Arts Education S1-K 178 171 101 148 126
13.Pendidikan Seni Tari dan Musik
Data Mahasiswa
13
Fakultas/Jurusan/Program StudiFaculty/Department/Program of Study
Jenjang Program/
Level of Program 2013 2014 2015 2016 2017
Fakultas Matematika dan Ilmu Pengetahuan Alam Faculty of Mathematics and Science
S1-NK 1.744 1.280 655 873 950
S1-K 2.611 2.086 1.080 1.149 1.192
1. Matematika
Mathematics S1-NK 370 302 140 201 235
2. Pendidikan Matematika
Mathematics Education S1-K 641 475 242 319 291
3. Fisika
Physics S1-NK 348 242 111 132 153
4. Pendidikan Fisika
Physics Education S1-K 413 384 179 151 138
5. Kimia
Chemistry S1-NK 514 348 172 200 241
6. Pendidikan Kimia
Chemistry Education S1-K 581 367 165 210 176
7. Pendidikan IPA
Natural Science Education S1-K 341 402 213 197 267
8. Biologi
Biology S1-NK 512 388 232 311 321
9. Pendidikan Biologi
Biology Education S1-K 635 458 281 301 320
Fakultas Ekonomi Faculty of Economics
S1-NK 4.237 2.963 2.336 2.078 2.426
S1-K 1.319 942 638 715 718
D3-NK 243 207 215 80 340
1. Manajemen
Management S1-NK 1.967 1.370 1.090 1003 1.217
2. Manajemen Pemasaran
Marketing Management D3-NK 121 107 104 41 168
3. Pendidikan Tata Niaga
Business Education S1-K 163 86 89 103 120
4. Pendidikan Administrasi Perkantoran
Office Administration Education S1-K 564 369 289 285 324
5. Pendidikan Akuntansi
Accountancy Education S1-K 266 201 98 134 113
6. Akuntansi Accountancy
S1-NK 1.316 877 593 602 614
D3-NK 122 100 111 39 172
7. Pendidikan Ekonomi
Economics Education S1-K 326 286 162 193 161
8. Ekonomi dan Studi Pembangunan
Ecomonics and Development Study S1-NK 954 716 653 473 595
Fakultas Teknik Faculty of Engineering
S1-NK 686 1.692 1.476 1.624 1.845
S1-K 2.248 1.081 700 941 906
D3-NK 496 424 297 101 541
1. Pendidikan Teknik Mesin
Mechanical Engineering Education S1-K 254 104 77 90 91
2. Teknik Mesin Mechanical Engineering
S1-NK - 247 236 260 222
D3-NK 118 71 60 14 78
3. Pendidikan Teknik Otomotif
Automotive Engineering Education S1-K 205 104 60 73 67
4. Mesin Otomotif
Otomotif Mechanical D3-NK - 52 27 3 49
5. Pendidikan Teknik Bangunan
Civil Engineering Education S1-K 184 109 67 143 139
6. Teknik Sipil dan Bangunan
Civil Engineering D3-NK 124 113 57 22 147
7. Teknik Sipil
14
STATISTIK UM 2013-2017
Fakultas/Jurusan/Program Studi Faculty/Department/Program of StudyJenjang Program/
Level of Program 2013 2014 2015 2016 2017
8. Pendidikan Teknik Informatika
Information Engineering Education S1-K 925 321 207 196 193
9. Pendidikan Teknik Elektro
Electrical Engineering Education S1-K 303 124 77 96 81
10.Teknik Informatika
Information Engineering S1-NK - 598 550 493 492
11.Teknik Elektro Electrical Engineering
S1-NK - 287 264 283 221
D3-NK 105 72 51 20 101
12.Teknik Elektronika
Electronic Engineering D3-NK 63 37 28 5 35
13.Pendidikan Tata Boga
Food Product Technology Education S1-K 218 191 119 191 183
14.Tata Boga
Food Product Technology D3-NK 50 46 47 23 79
15.Pendidikan Tata Busana
Clothing Design Technology Education S1-K 159 128 93 152 152
16.Tata Busana
Clothing Design Technology D3-NK 36 33 27 14 52
17.Teknik Industri
Industrial Engineering S1-NK - - - - 287
Fakultas Ilmu Keolahragaan Faculty of Sport Science
S1-NK 592 402 305 432 336
S1-K 568 469 345 499 502
1. Pendidikan Jasmani dan Kesehatan
Sports and Health Education S1-K 369 303 218 345 320
2. Ilmu Keolahragaan
Sports Science S1-NK 94 59 62 67 66
3. Pendidikan Kepelatihan Olahraga
Sport Coaching Education S1-K 199 166 127 154 182
4. Ilmu Kesehatan Masyarakat
Community Health Science S1-NK 498 343 243 365 270
Fakultas Ilmu Sosial Faculty of Social Science
S1-NK 382 252 163 229 288
S1-K 1.210 1.079 820 1.000 1.009
1. Pendidikan Pancasila dan Kewarganegaraan
Civics and Pancasila Education S1-K 294 160 125 188 240
2. Pendidikan Sejarah
History Education S1-K 273 206 121 183 197
3. Ilmu Sejarah
History Science S1-NK 163 86 61 89 111
4. Pendidikan IPS
Social Sciences Education S1-K 270 172 122 172 129
5. Pendidikan Geografi
Geography Education S1-K 373 233 146 198 145
6. Geografi
Geography S1-NK 219 166 102 140 177
7. Pendidikan Sosiologi
Sosiology Education S1-K - 308 306 259 298
Fakultas Pendidikan Psikologi
Faculty of Educational Psychology S1-NK 1.156 748 535 732 841
1. Psikologi
Psychologi S1-NK 1.156 748 535 732 841
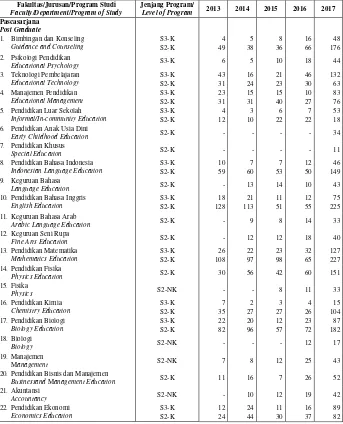
Pascasarjana Post Graduate
S3-K 230 192 188 342 348
S2-K 1.235 1.273 1.174 1.211 1.527
S2-NK 14 24 38 79 83
1. Teknologi Pembelajaran Educational Technology
S3-K 37 19 24 71 66
S2-K 40 28 30 40 35
Data Mahasiswa
15
Fakultas/Jurusan/Program StudiFaculty/Department/Program of Study
Jenjang Program/
Level of Program 2013 2014 2015 2016 2017
Educational Management S2-K 21 34 44 31 53
3. Bimbingan dan Konseling Guidance and Counseling
S3-K 7 6 8 22 23
S2-K 91 57 46 71 88
4. Pendidikan Luar Sekolah Informal In-Community Education
S3-K 5 4 7 7 13
S2-K 12 12 26 29 34
5. Pendidikan Bahasa Indonesia Indonesian Language Education
S3-K 10 9 12 17 27
S2-K 56 96 78 56 63
6. Keguruan Bahasa
Language Education S2-K - 27 17 17 52
7. Pendidikan Bahasa Inggris English Education
S3-K 39 44 29 57 45
S2-K 282 246 136 230 260
8. Keguruan Bahasa Arab
Arabic Language Education S2-K - 10 8 12 10
9. Keguruan Seni Rupa
Fine Arts Education S2-K - 18 12 18 20
10.Pendidikan Biologi Biology Education
S3-K 25 22 13 25 30
S2-K 128 112 98 110 90
11.Biologi
Biology S2-K - - - 18 12
12.Pendidikan Matematika Mathematics Education
S3-K 36 30 33 47 54
S2-K 188 145 147 124 146
13.Pendidikan Kimia Chemistry Education
S3-K 7 2 3 5 3
S2-K 85 37 43 31 51
14.Pendidikan Ekonomi Economics Education
S3-K 15 25 12 21 29
S2-K 34 50 32 40 33
15.Psikologi Pendidikan
Educational Psychology S3-K 7 8 14 22 16
16.Pendidikan Geografi Geography Education
S3-K 7 2 6 16 13
S2-K 54 46 41 33 50
17.Pendidikan Kejuruan Vocational Education
S3-K 6 5 7 14 10
S2-K 108 43 37 42 45
18.Pendidikan Fisika
Physics Education S2-K 45 75 78 77 84
19.Fisika
Physics S2-NK - - 8 11 13
20.Pendidikan Dasar
Fundamental Education S2-K 83 158 248 153 226
21.Manajemen
Management S2-NK 14 8 15 24 27
22.Pendidikan Bisnis dan Manajemen
Fundamental Education S2-K 8 27 10 31 10
23.Pendidikan Sejarah
History Education S2-K - 12 21 19 29
24.Akuntansi
Accountancy S2-NK - 10 13 21 23
25.Ilmu Ekonomi
Economics Science S2-NK - 6 2 5 8
26.Pendidikan Olahraga
Sport Education S2-K - 40 51 47 51
27.Pendidikan Anak Usia Dini
Early Childhood Education S2-K - - -