Lampiran Lampiran 1 Hasil Uji Stasioner Data (i) Variabel IHSG pada derajat first difference
Null Hypothesis: D(IHSG) has a unit root Exogenous: Constant
Lag Length: 0 (Fixed)
t-Statistic Prob.*
Augmented Dickey-Fuller test statistic -6.655981 0.0000 Test critical values: 1% level -3.548208
5% level -2.912631
10% level -2.594027
*MacKinnon (1996) one-sided p-values.
Augmented Dickey-Fuller Test Equation Dependent Variable: D(IHSG,2)
Method: Least Squares Date: 05/29/13 Time: 15:28
Sample (adjusted): 2008M03 2012M12 Included observations: 58 after adjustments
Variable
Coefficie
nt Std. Error t-Statistic Prob.
D(IHSG(-1))
-0.882535 0.132593 -6.655981 0.0000
C 24.51557 24.81400 0.987973 0.3274
R-squared 0.441687 Mean dependent var
-0.574138 Adjusted R-squared 0.431717 S.D. dependent var 247.7756 S.E. of regression 186.7846 Akaike info criterion 13.33166 Sum squared resid 1953755. Schwarz criterion 13.40271
Log likelihood
-384.6182 F-statistic 44.30208 Durbin-Watson stat 1.912536 Prob(F-statistic) 0.000000
(ii)Variabel inflasi pada derajat first difference
Exogenous: Constant Lag Length: 0 (Fixed)
t-Statistic Prob.*
Augmented Dickey-Fuller test statistic -3.796719 0.0050 Test critical values: 1% level -3.548208
5% level -2.912631
10% level -2.594027
*MacKinnon (1996) one-sided p-values.
Augmented Dickey-Fuller Test Equation Dependent Variable: D(INFLASI,2) Method: Least Squares
Date: 05/29/13 Time: 15:29
Sample (adjusted): 2008M03 2012M12 Included observations: 58 after adjustments
Variable
Coefficie
nt Std. Error t-Statistic Prob.
D(INFLASI(-1))
-0.409282 0.107799 -3.796719 0.0004
C
-0.022487 0.071403 -0.314926 0.7540
R-squared 0.204716 Mean dependent var
-0.001034 Adjusted R-squared 0.190514 S.D. dependent var 0.602503 S.E. of regression 0.542080 Akaike info criterion 1.647069 Sum squared resid 16.45565 Schwarz criterion 1.718118
Log likelihood
-45.76499 F-statistic 14.41508 Durbin-Watson stat 1.930384 Prob(F-statistic) 0.000363
Exogenous: Constant Lag Length: 0 (Fixed)
t-Statistic Prob.*
Augmented Dickey-Fuller test statistic -4.526028 0.0005 Test critical values: 1% level -3.548208
5% level -2.912631
10% level -2.594027
*MacKinnon (1996) one-sided p-values.
Augmented Dickey-Fuller Test Equation Dependent Variable: D(RATEBI,2) Method: Least Squares
Date: 05/29/13 Time: 15:53
Sample (adjusted): 2008M03 2012M12 Included observations: 58 after adjustments
Variable
Coefficie
nt Std. Error t-Statistic Prob.
D(RATEBI(-1))
-0.535659 0.118351 -4.526028 0.0000
C
-0.020780 0.022984 -0.904090 0.3698
R-squared 0.267830 Mean dependent var 0.000000 Adjusted R-squared 0.254755 S.D. dependent var 0.198680
S.E. of regression 0.171515 Akaike info criterion
-0.654412
Sum squared resid 1.647383 Schwarz criterion
-0.583363 Log likelihood 20.97796 F-statistic 20.48493 Durbin-Watson stat 2.188784 Prob(F-statistic) 0.000032
Date: 06/23/13 Time: 13:55
Sample (adjusted): 2008M05 2012M12 Included observations: 56 after adjustments Trend assumption: No deterministic trend Series: IHSG INFLASI RATEBI
Lags interval (in first differences): 1 to 3
Unrestricted Cointegration Rank Test (Trace)
Hypothesized Trace 0.05
No. of CE(s) Eigenvalue Statistic Critical Value Prob.**
None 0.146156 11.37351 24.27596 0.7556 At most 1 0.043769 2.525144 12.32090 0.9026 At most 2 0.000336 0.018817 4.129906 0.9107
Trace test indicates no cointegration at the 0.05 level * denotes rejection of the hypothesis at the 0.05 level **MacKinnon-Haug-Michelis (1999) p-values
Unrestricted Cointegration Rank Test (Maximum Eigenvalue)
Hypothesized Max-Eigen 0.05
No. of CE(s) Eigenvalue Statistic Critical Value Prob.**
None 0.146156 8.848365 17.79730 0.6114 At most 1 0.043769 2.506328 11.22480 0.8602 At most 2 0.000336 0.018817 4.129906 0.9107
Max-eigenvalue test indicates no cointegration at the 0.05 level * denotes rejection of the hypothesis at the 0.05 level
**MacKinnon-Haug-Michelis (1999) p-values
Unrestricted Cointegrating Coefficients (normalized by b'*S11*b=I):
IHSG INFLASI RATEBI
-0.000103 -0.704981 0.694626 -1.62E-05 -0.002977 -0.140130 -0.001024 -0.301391 0.693352
Unrestricted Adjustment Coefficients (alpha):
1 Cointegrating Equation(s): Log likelihood -356.2281
Normalized cointegrating coefficients (standard error in parentheses)
IHSG INFLASI RATEBI
1.000000 6866.308 -6765.456 (2330.35) (2222.40)
Adjustment coefficients (standard error in parentheses)
D(IHSG) -0.002789
(0.00221)
D(INFLASI) -1.61E-05
(6.8E-06)
D(RATEBI) 1.28E-06
(2.0E-06)
2 Cointegrating Equation(s): Log likelihood -354.9749
Normalized cointegrating coefficients (standard error in parentheses)
IHSG INFLASI RATEBI
1.000000 0.000000 9046.654
(6512.55)
0.000000 1.000000 -2.302855
(0.95165)
Adjustment coefficients (standard error in parentheses) D(IHSG) -0.002740 -19.14351
(0.00224) (15.1802) D(INFLASI) -1.67E-05 -0.110689
(6.8E-06) (0.04639)
D(RATEBI) 8.56E-07 0.008729
(1.9E-06) (0.01315)
Lampiran 3
Hasil Penentuan Lag Length VAR Lag Order Selection
Endogenous variables: IHSG INFLASI
RATEBI Exogenous variables: C
Date: 05/29/13 Time: 16:04 Sample: 2008M01 2012M12 Included observations: 55
Lag LogL LR FPE AIC SC HQ
0 -583.8968 NA 372533.0 21.34170 21.45119 21.38404 1 -379.7756 378.5520 309.0566 14.24638 14.68435 14.41575 2 -356.4916 40.64107 184.4725 13.72697 14.49340* 14.02335* 3 -344.7697 19.18125* 168.4476* 13.62799* 14.72290 14.05140 4 -338.6212 9.390544 189.6879 13.73168 15.15506 14.28211 5 -330.6456 11.31085 201.7842 13.76893 15.52078 14.44639
* indicates lag order selected by the
criterion LR: sequential modified LR test statistic (each test at
5% level)
FPE: Final prediction error AIC: Akaike information
criterion SC: Schwarz information
criterion HQ: Hannan-Quinn information criterion
Lampiran 4
Hasil Uji Kausalitas Granger Pairwise Granger Causality Tests
Date: 05/30/13 Time: 11:57 Sample: 2008M01 2012M12 Lags: 3
INFLASI does not Granger Cause IHSG 57 4.86203 0.00481 IHSG does not Granger Cause INFLASI 0.67796 0.56965
RATEBI does not Granger Cause IHSG 57 7.35329 0.00036 IHSG does not Granger Cause RATEBI 2.63316 0.06002
RATEBI does not Granger Cause INFLASI 57 3.43581 0.02373 INFLASI does not Granger Cause RATEBI 4.38008 0.00818
Lampiran 5 Hasil Estimasi VAR
Vector Autoregression Estimates Date: 06/23/13 Time: 14:17
Sample (adjusted): 2008M06 2012M12 Included observations: 55 after adjustments Standard errors in ( ) & t-statistics in [ ]
DIHSG DINFLASI DRATEBI
DIHSG(-1) 0.815794 -0.000333 -0.000235 (0.15145) (0.00049) (0.00015)
[ 5.38641] [-0.67792] [-1.61268]
DIHSG(-2) -0.234421 -7.84E-05 2.25E-05 (0.18485) (0.00060) (0.00018)
[-1.26814] [-0.13058] [ 0.12622]
DINFLASI(-1) -88.49290 1.494161 0.051675 (48.9077) (0.15885) (0.04713) [-1.80938] [ 9.40608] [ 1.09644]
DINFLASI(-2) 140.1545 -0.634592 0.029362 (81.3711) (0.26429) (0.07841) [ 1.72241] [-2.40111] [ 0.37446]
DINFLASI(-3) -29.49995 0.071870 -0.026275 (55.0374) (0.17876) (0.05304)
[-0.53600] [ 0.40205] [-0.49542]
DRATEBI(-1) -277.1649 -0.104665 0.999743 (174.540) (0.56690) (0.16820) [-1.58797] [-0.18463] [ 5.94391]
DRATEBI(-2) -20.20159 0.802816 -0.115272 (233.933) (0.75981) (0.22543)
[-0.08636] [ 1.05660] [-0.51134]
DRATEBI(-3) 71.82814 -0.774023 -0.109117 (155.398) (0.50473) (0.14975)
[ 0.46222] [-1.53355] [-0.72866]
C 1930.715 1.104813 1.463691
(828.504) (2.69095) (0.79839) [ 2.33036] [ 0.41057] [ 1.83330]
R-squared 0.974190 0.968037 0.980506 Adj. R-squared 0.969028 0.961645 0.976607 Sum sq. resids 1257880. 13.26971 1.168100 S.E. equation 167.1912 0.543031 0.161114 F-statistic 188.7238 151.4319 251.4867 Log likelihood -354.0758 -38.94076 27.88713 Akaike AIC 13.23912 1.779664 -0.650441 Schwarz SC 13.60409 2.144634 -0.285471 Mean dependent 3024.046 5.884545 6.909091 S.D. dependent 950.0122 2.772754 1.053394
Determinant resid covariance (dof
adj.) 153.3267 Determinant resid covariance 83.97834
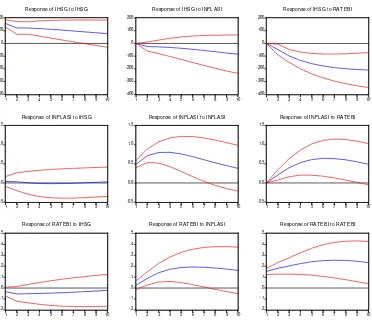
Lampiran 6 Grafik Hasil IRF
-400
Response of IHSG to IHSG
-400
Response of IHSG to INFLASI
-400
Response of IHSG to RAT EBI
-0.5
Response of INFLASI to IHSG
-0.5
Response of INFLASI to INFLASI
-0.5
Response of INFLASI to RAT EBI
-.2
Response of RAT EBI to IHSG
-.2
Response of RAT EBI to INFLASI
-.2
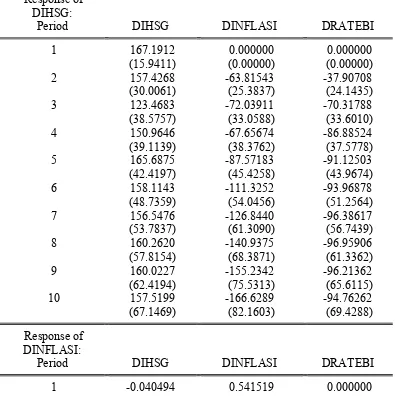
Lampiran 7 Tabel Hasil IRF
Response of
DIHSG:
Period DIHSG DINFLASI DRATEBI
1 167.1912 0.000000 0.000000 (15.9411) (0.00000) (0.00000) 2 157.4268 -63.81543 -37.90708 (30.0061) (25.3837) (24.1435) 3 123.4683 -72.03911 -70.31788 (38.5757) (33.0588) (33.6010) 4 150.9646 -67.65674 -86.88524 (39.1139) (38.3762) (37.5778) 5 165.6875 -87.57183 -91.12503 (42.4197) (45.4258) (43.9674) 6 158.1143 -111.3252 -93.96878 (48.7359) (54.0456) (51.2564) 7 156.5476 -126.8440 -96.38617 (53.7837) (61.3090) (56.7439) 8 160.2620 -140.9375 -96.95906 (57.8154) (68.3871) (61.3362) 9 160.0227 -155.2342 -96.21362 (62.4194) (75.5313) (65.6115) 10 157.5199 -166.6289 -94.76262 (67.1469) (82.1603) (69.4288)
Response of
DINFLASI:
Period DIHSG DINFLASI DRATEBI
(0.07312) (0.05163) (0.00000)
Period DIHSG DINFLASI DRATEBI
1 -0.062958 0.057348 0.136767
DRATEBI Standard Errors:
Analytic
Lampiran 8
Tabel Hasil Variance Decomposite
Variance Decomposition of
DIHSG:
Period S.E. DIHSG DINFLASI DRATEBI
1 167.1912 100.0000 0.000000 0.000000 2 241.3409 90.54113 6.991810 2.467055 3 289.1783 81.29296 11.07581 7.631236 4 344.2976 76.57342 11.67486 11.75173 5 402.4498 72.99265 13.27953 13.72781 6 456.2778 68.79471 16.28402 14.92127 7 508.0120 64.99259 19.37063 15.63677 8 559.4860 61.78887 22.31594 15.89519 9 609.9070 58.87890 25.25684 15.86426 10 658.4408 56.24205 28.07493 15.68303
Variance Decomposition of
DINFLASI:
Period S.E. DIHSG DINFLASI DRATEBI
1 0.543031 0.556075 99.44392 0.000000 2 0.975760 1.435480 98.54300 0.021522 3 1.362204 3.929027 95.65446 0.416513 4 1.687650 5.974659 92.90494 1.120399 5 1.956037 7.444761 90.84817 1.707068 6 2.173433 8.441424 89.52058 2.038001 7 2.346274 9.061772 88.75914 2.179087 8 2.479944 9.422554 88.36562 2.211827 9 2.580104 9.625400 88.18453 2.190068 10 2.652504 9.727637 88.12747 2.144894
Decomposition of DRATEBI:
Period S.E. DIHSG DINFLASI DRATEBI
1 0.161114 15.26984 12.66980 72.06036 2 0.250657 23.65185 16.81983 59.52832 3 0.348096 27.81079 27.56498 44.62422 4 0.443545 26.63594 38.78284 34.58122 5 0.536180 25.25217 46.62575 28.12208 6 0.624088 24.50047 51.77378 23.72574 7 0.704978 23.89444 55.47343 20.63213 8 0.776861 23.34634 58.23343 18.42022 9 0.839252 22.92169 60.28437 16.79393 10 0.892354 22.59581 61.83680 15.56739
Cholesky Ordering: DIHSG DINFLASI
DRATEBI