2 (3) 144- 153 ©UB 2014 University of Brawijaya Malang, Indonesia http://apmba.ub.ac.id
Designing Citizen Business Loan Model to Reduce
Non-Performing Loan: An Agent-based Modeling and
Simulation Approach in Regional Development
Moses L. Singgiha* Bambang Syairudinb Tatbita T. Suhariyantoc
a,b,c Master of Management, Institute Teknologi Sepuluh Nopember ITS Surabaya, Indonesia
Abstract
Citizen Business Loan (CBL) constitutes a program poverty alleviation based on economic empowerment of small and medium enterprise. This study focuses on implementation of CBL at Regional Development Bank branch X. The problem is the existing of interdependencies between CBL’s implements (Bank) and the uncertainty of debtor’s capability in returning the credit. The impact of this circumstance is non-performing loan (NPL) becomes relatively high (22%). The ultimate objective is to minimize NPL by designing the model based on the agent that can represent the problem through a simulation using agent-based modeling and simulation (ABMS). The model is considered by managing the probability of the debtor to pay or not based on 5 C categories, they are: character, capacity, capital, condition, and collateral that inherent to each debtor. There are two improvement scenarios proposed in this model. The first scenario only involves the first category of debtor in simulation. The result of this scenario is NPL value as 0%. The second scenario includes the first and second of debtor’s category in simulation and resulting NPL value between 4.6% and 11.4%.
Keywords
Citizen Business loan (CBL), Non-Performing Loan, Agent-based Modeling and Simulation
Received: 19 December 2013; Accepted: 2 February 2014; Published Online: 30 April 2014
Introduction
Citizen Business Loan (CBL) is a government program that aimed to provide access and economy reinforcement for the entrepreneur in scale of small medium enterprise. CBL is given to UMKMK (Usaha Mikro, Kecil, dan Menengah dan Koperasi) that economically feasible but not yet bankable.
CBL distribution that has been over the target shows that the program is enough effective in strengthening SMEs capital. Nonetheless, the success of CBL is not only measured by distribution capability. According to Syarif (2011), there were two basic problems namely returning loan and utilization loan of CBL. Returning loan is often failed in a few Banks (Slovin&Sushka, 1983). Moreover, from the aspect of utilization has not yet evaluated to ensure whether the distribution of CBL was right on the target and well used by the debtor. The government policy to enhance the CBL distribution is affected to regional development bank, namely Regional Development Bank X (RDB X). As the biggest CBL distribution bank, RDB X has succeeded to distribute CBL of Rp. 3.3 trillion. However, in practice, the bank faces a few problems. In the 2013, RDB X decreases the CBL distribution. (Sukrianto, 2013)
Sukrianto explained that decreasing of CBL distribution was caused by non-performing loans in the major banks that donated by 10%. Moreover, the rate of failing to pay around 3.25% from the debtor. This percentage increases compare the same period in the last year of 2.96%. This non-performing loan is caused by the amount of entrepreneur face the disruption so that debtor difficult to refund the loan. These higher loan will contribute the increasing of non-performing loan (NPL) that resulted in lower performance of the bank.
RDB branch X, is one of the biggest bank that distributes the CBL for working capital loan and invested to 119 debtors. Plafond that has already distributed of Rp 41.593 milliard. Nonetheless, a large CBL is not followed by a smooth loan repayment, so the performance of the
bank’s NPL was 57.62%. In fact, a bank is considered to have good performance when the NPL under 5%. So, this research took a case study of the CBL distribution in RDB Branch X.
A large non-performing value that happens in RDB branch X is caused by the amount SMEs that failed in performing their business. By this the failure of the business, SMEs cannot pay the loan that already given. The existing of the uncertainty of the business SMEs and interdependencies between the bank and SMEs, these problems requires a right solution to solve it (Manove, Padilla&Pagano, 2011). Modeling is one of ways to solve the real problem where the prototype or experiment difficult to implement in the real system. (Borshchev, A. & Filippov, A., 2004)
Lıterature Revıews Loan Analysis
The principal of loan analysis in the world of banking is well-known as the concept of 5C (Character, Capacity, Capital, Condition, and Collateral). This principle is used to evaluate the feasibility of debtor candidate, whether the debtor deserves loan or not. The following is a description of each aspect of 5C.
1) Character
The character of the applicant’s credit is the most preferred aspect of all aspects of 5C. This is related to how credit applicant’s willingness to pay the loan. Information about the character of the credit applicant can be obtained by collecting information from references debtors and other banks about behavior, honesty, relationships, and adherence to meet the payment transaction.
4) Condition
Analysis of the conditions that must be conducted include conditions regionally, nationally and internationally.
5) Collateral
Assessment needs to be done in the guarantees aspects include the value of collateral in the future value and the ease to convert into cash or marketability.
Performing Loan
Performing loan is a type of loans in which customer returns the loan smoothly or arrears up to 90 days (Ismail, 2010). Performing loans are divided into two, namely performing loans and special mention loans. Performing loans are loans that are paid without arrears. While special mention loans are loans that are either delinquent installments, principal and interest payments, but not exceeding 90 days in arrears. (Bank Indonesia, 2004)
Table 1. Type of Performing Loan
Collectibility
Category
Type of Loans
Loan Repayment Time
Span
Collect 1
Liquid loans
Each due date
Collect 2 Special mention loans
Less than 90 days
2) Capacity
The ability to pay the loan related to how loan’s applicants manage their business enterprise so that able to pay the loan. 3) Capital
Capital of the debtor must be analyzed regarding its large and structure of capital that visible from the work sheet debtor company.
Non-Performing Loan
Bank Indonesia, NPL is classified into three types, namely substandard loan, doubtful loans and bad credit.
Table 2. Type of Non-Performing Loan
Collectibility
Category
Type of Loans
Loan Repayment Time
Span
Collect 3
Substandard loans
91 days - 120 days
Collect 4
Doubtful loans
121 days - 180 days
Collect 5
Bad loans
More than 180 days
NPL value can be calculated from the ratio of nonperforming loans to total loans distributed by the bank. From calculating this ratio, there are two categories of NPL value. NPL has a good ratio of below 5%. While bad NPL had ratios above 5%. (Bank Indonesia, 2004)
Agent-Based Modeling and Simulation
Agent-based modeling is a model in which agent can be interacted repeatedly many times. For instance, when agent optimizing their collective behavior through the exchange of simple information that often conducted by colony ant. This way aims to obtain final desired results namely optimal system.
ABMS constitute a new approach for modeling a system to describe the interaction inter-agent basis autonomous (standalone) (Macal, C.M. & North, M.J., 2009). ABMS can be applied in the broad area of modeling the behavior of the agent. Because the excellence ABMS compared to modeling conventional, ABMS received good attention from many researchers during the 10 last year.
ABMS that focus on the interaction agent creates this simulation system selected to solve the problem CBL that involving a lot of stakeholder. Basically,
a stakeholder which involved in the CBL interrelated and have a pattern of each behavior (Johnston&Morduch, 2008). By
modeling the system of CBL distribution using ABMS can be known the behavior of problematic agent, so that can further develop improvement scenarios. The reason why ABMS approach is selected to solve the problem of BCL is that the varied behavior of UMKMK in terms of returning loan and uncertainties that faced UMKMK in the returning loan.
Research Methodology
There are three stages to conduct the research, namely:
Preliminary Stage
At this stage will be carried out field studies and literature. The field study was conducted to acknowledge the problematic condition in the implementation of citizen business loan (CBL) in RDB Branch X. Information obtained from field studies include influential actors in the implementation of CBL and the fundamental problem of BCL implementation. Literature study leads to obtain the references associated with the research problem and finding the solution for model design.
Data Collecting and Processing Stage
and model design stage. The data will be gathered include vision, mission and organizational structure of the company, the data of UMKMK which propose CBL to RDB branch X, the data of UMKMK business that obtain CBL, and data of loan installment.
Before designing the simulation model, need to be done first for the conceptual model of the overall system. Conceptual model design is conducted by identifying the agents involved and describes the interaction between agents. The conceptual model is carried out by data flow diagrams (DFD) in order to acknowledge the flow of data among agents.
To build a simulation model, first need to design a causal loop diagram, identifying the role of each agent, and an assessment of the role of each agent. The design of the simulation model is conducted by using netLogo software. Then, the simulation result will be validated between model result and real system using t-test. In order to achieve the objectives of this research, the initial steps in designing the improvement scenario are to identify the things that can increase the value of NPL. Hence, this study designs several scenarios that can minimize the value of NPL. All the improvement scenario will be analyzed their significant differences by using analysis of variance (ANOVA) and SPSS software used to perform this analysis.
Analysis and Conclusion Stages This stage constitutes analysis stage and interpretation of the model that’s designed based on the existing condition and improvement scenario. The final step is inferring the conclusion of research and recommendation for future works.
Results
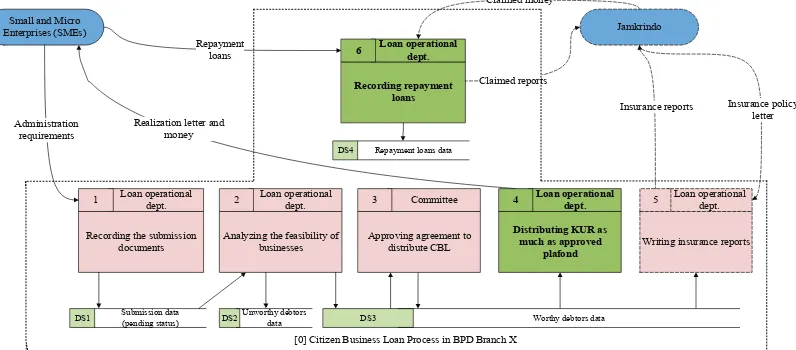
A Conceptual Model Using Data Flow Diagram and Causal Loop Diagram In Data Flow Diagram (DFD), model is designed from bank perspective. External entities which involved in system are smalland micro enterprises (SMEs) and Jamkrindo as the guarantor company. SMEs will propose CBL by completing the administration requirements. This submission will be accepted by loan operational department in bank, then it will be recorded in data base as pending CBL submission. This data will be used by loan analyst to assess the feasibility of the business. From analysis result, it can produce worthy-debtors data and non-worthy-debtors data. The worthy debtors data will be used by committee to give agreement how much plafond will be gave to the debtors. Then, from the committee’s decision, the loan operational department will distribute the money as much as approved plafond and give agreement letter which contains agreement between bank and debtor, also the number of plafond and repayment period. The next process is writing the guarantee report by loan operational department. This report will be submitted to Guarantor Company. Then this company will send guarantees letter as feedback. Furthermore, SMEs have duty to repay the loan corresponding to each due date and the credit operational department will record this transaction. If there is bad loans, then bank can propose claims report to the guarantor company and the company will give claimed money to the bank.
repayment record. From the DFD model, there is data flow between Jamkrindo (guarantor company) which depicted by dashed line. This line indicates that the guarantor company is not getting involved directly to the system. In the real system, Jamkrindo is not involved in giving claimed money because some administration problem that faced by the bank. Consequently, in this conceptual model, Jamkrindo is depicted in dashed line. This data flow diagram has been verified by expertise judgement from the bank. Figure 1 shows the data floe diagram of citizen business loan processes in RDB Branch X.
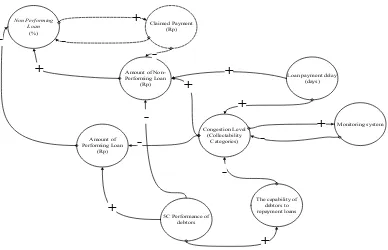
influences how much performing loan and non-performing loan. The better performance of 5C debtor, it can in crease the amount of performing loans and reducenon-performing loans.
The capability of debtors to pay loans will decrease the congestion level of credit payment. The higher levels of congestion, it will affect the number of monitoring to be done. Intensive monitoring system will reduce congestion level.
Low congestion level can increase the amount of performing loans and decrease the value of NPL. High congestion
Analyzing the feasibility of businesses
DS1 Submission data(pending status) DS2Unworthy debtors data DS3 Worthy debtors data Jamkrindo
[0] Citizen Business Loan Process in BPD Branch X
Approving agreement to
Figure 1. Data Flow Diagram
After design data flow diagram, the next step is designing causal loop diagram. Causal loop diagram is designed to know causal relationship in a system. In this causal loop diagram, it is started from debtors capability to repay the loan which influenced by 5C performance. Getting better its performance, it will increase the capability of debtors to pay loans. Good performance in 5C aspect means the debtorhas good character, good capability to pay loans, good capital for doing business, good condition for his business, and good collateral. This 5C performance
performing loans. High non-performing loans due to the long delay in the payment of the loans. Late payment of loans will affect the level of congestion loan payment. The more late loans are paid, the higher level of congestion.
role of Jamkrindo has not beenfelt in the existing system. Therefore, claim payment is depicted by dashed line. This causal loop diagram has been verified by expertise judgment from the bank. Figure 2 shows the causal loop diagram of citizen business loan in RDB Branch X.
if the debtors late 1 until 90 days, then it should be calculated the number of delays (K). The value of K is derived from the number of delays divided by 30 days. Paid principal is derived from principal each month multiplied by the number of months that the debtors pat the loan on time
(n-Non Performing Loan
(%)
Amount of Non
-Performing Loan (Rp)
Claimed Payment (Rp)
+
+
-Congestion Level (Collectability
Categories)
Loan payment delay (days)
+
+
Amount of Performing Loan
(Rp)
-Monitoring system
+
-The capability of debtors to repayment loans
-5C Performance of
debtors
+ +
+
-Figure 2. Causal Loop Diagram
Designing Programming Algorithm Flow Programming algorithm flow is used to design the flow of simulation model. Debtors will accept plafond as much as agreement. Then, principal each month is calculated from the ratio between plafond and payment period. The debtors have to pay the principal each month according to the provision.
When the debtors pay the loan, then it will be calculated the debt balance. Debt balance is derived from plafond minus paid principal. The debtors who pay the loan on due date, it will categorize the debt balance as debt balance K1 (debt balance from performing loans). Then,
Designing Simulation Model and Improvement Scenarios Using Agent-Based Modeling and Simulation
The concept of simulation model is designed by managing the debtor’s movement based on 5C Categories. These categories is five categories which analyzed by bank when the debtors propose the loan. These categories consist of Character, Capacity, Capital, Condition, and Collateral. In existing simulation model, there are five combinations of 5C Categories which obtained from the observation of bank credit analysts. Table 3 shows five combinations of 5C Categories.
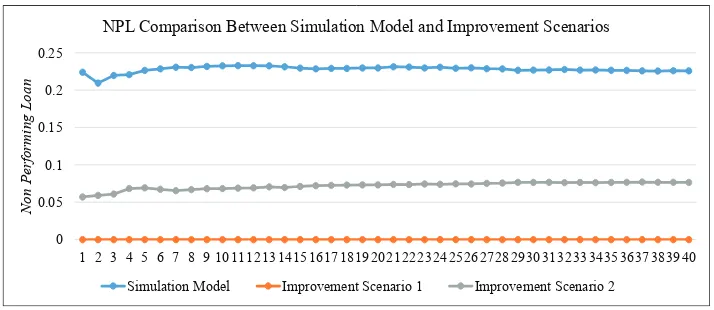
From simulation result, 5C Categories which attached to each debtors is greatly effect to the value of MPL. When the number of debtors with third category, fourth category, and fifth category is too high, it will increase the value of NPL. Conversely, when the number of debtors with first category and second category is high, the value of NPL can be reduced. There are two improvement scenarios which will be proposed in this research. The first scenario is tightening the acceptance of the debtors, so that the banks only accept the debtors with first category (Zulverdi, Gunadi&Pramono, 2007). This scenario can reduce the value of NPL until 0% because every debtor always pay the loan on due date.
Table 3. Five Combinations of 5C Categories
Category Character Capacity Capital Condition Collateral
1 Yes Yes Yes Yes Yes
2 No Yes Yes Yes Yes
3 No No Yes Yes Yes
4 No No No Yes Yes
5 No No No No Yes
Each combination of 5C Categories has different overdue behavior. Table 4 shows the number of overdue corresponding to each 5C Categories. This table will be referred to planning the movements of debtors in simulation model.
Table 4. Number of Overdue Corresponding to Each 5C Categories
5C
Category
Number of
overdue
1
0
2
< 5 months
3
< 6 months
4
< 8 months
5
> 8 months
This scenario can reduce the value of NPL from 4.6% until 11.4%. This value is still quite high because it isstill more than 5%. This high NPL is due to potential of debtors who do not pay the loan, the debtors in second category. Figure 3 show NPL value comparison chart of simulation model with two improvement scenarios.
predetermined target cannot be met by the bank.
From simulation result, this recommendation can decrease the value of NPL until 0%. This value is an ideal value. The probability to achieve this value is very low.
0 0.05 0.1 0.15 0.2 0.25
1 2 3 4 5 6 7 8 910111213141516171819202122232425262728293031323334353637383940
N
on P
e
rf
or
m
ing L
oan
NPL Comparison Between Simulation Model and Improvement Scenarios
Simulation Model Improvement Scenario 1 Improvement Scenario 2
Figure 3. NPL Comparison Chart between Simulation Model and Improvement Scenario.
Dıscussıon
From the two improvement scenarios, there are some advantages and disadvantages. First improvement scenario is tightening the acceptance of debtors, so that the bank only accepts the debtors in first category. The advantage of this recommendation is decreasing the risk of high NPL value. Furthermore, the bank also can get the money back from the debtors when they repay the loans. However, the disadvantage is less extensive loan expansion because the bank implements prudential principle strictly (DeYeoung, Gleonnon&Nigro, 2008). Loan expansion becomes limited because only a few debtors can received loans from the bank. If this recommendation is implemented, then only 66% of the total debtors who meet this category. This causes the
The second scenario is loosening the acceptance of the debtors, so that the bank accept the debtors in first and second category. The advantage of this recommendation is the expansion of loan can be more extensive than the first scenario. The bank can accept more debtors than before. Then, with loosened the acceptance of the debtors, the bank can meet the predetermined target. However, this recommendation has possibility to increase the value of NPL above 5% because the bank accepts the debtors in second category.
Notes on Contributors
of Queensland, Australia. His research interest are in Total Quality Management.
Bambang Syairudin is a senior lecturer in Industrial Engineering Departement, Institute Sepuluh Nopember ITS Surabaya. He got his doctorate degree in Management & Industrial Engineering, ITB Bandung. His research interests are in knowledge engineering and management.
Tatbita T. Suhariyanto is a student of industrial Engineering Department in Institute Teknologi Sepuluh Nopember Surabaya ITS.
References
Bank Indonesia, (2004). Peraturan Bank Indonesia Nomor 6/9/PBI/2004 tentang Tindak Lanjut Pengawasan dan Penetapan Status Bank.
Borshchev, A. & Filippov, A., (2004). From System Dynamics and Discrete Event to Practical Agent Based Modeling : Reasons, Techniques, Tools.
DeYoung, R., Glennon, D., & Nigro, P. (2008). Borrower–lender distance, credit scoring, and loan performance: Evidence from informational-opaque small business borrowers.
Journal of Financial Intermediation,
17(1), 113-143.
Ismail. (2010). Akuntansi Bank. Jakarta : Penerbit Kencana.
Johnston, D., & Morduch, J. (2008). The unbanked: evidence from Indonesia.
The World Bank Economic Review,
22(3), 517-537.
Komite Kredit Usaha Rakyat, (2013). Sebaran Penyaluran Kredit Usaha Rakyat Periode November 2007- Februari 2013. Available at: http://komite-kur.com/article-77-
sebaran-penyaluran-kredit-usaha- rakyat-periode-november-2007-februari-2013.asp [Accessed March 28, 2013].
Macal, C.M. & North, M.J., (2009). Agent-Based Modeling And Simulation. In Proceedings of the 2009 Winter Simulation Conference. Argonne, United States of America, pp. 86–98. Manove, M., Padilla, A. J., & Pagano,
M. (2001). Collateral versus project screening: A model of lazy banks.
Rand journal of economics,
726-744.
Rosengard, J. K., & Prasetyantoko, A. (2011). If the banks are doing so well, why can’t I get a loan? Regulatory constraints to financial inclusion in Indonesia. Asian Economic Policy
Review, 6(2), 273-296.
Slovin, M. B., & Sushka, M. E. (1983). A model of the commercial loan rate. The Journal of Finance, 38(5),
1583-1596.
Sukrianto, H., (2013). Banyak Kredit Macet, Bank Jatim Kurangi Penyaluran KUR. economy. okezone.com, p.1. Available at: http://economy.okezone.com/ read/2013/03/07/457/772636/ banyak-kredit-macet-bank-jatim-kurangi-penyaluran-kur [Accessed March 28, 2013].
Syarif, T., (2011). Prospek dan Kendala KUR dalam Mendukung Perkuatan Permodalan UKMK, Bidang Pengkajian Sumberdaya dan UKMdan Koperasi, Kementrian Negara Koperasi dan UKM.
Zulverdi, D., Gunadi, I., & Pramono, B. (2007). Bank portfolio model and monetary policy in Indonesia.
Journal of Asian Economics, 18(1),