Indonesia
Demographic and
Health Survey
2012
Special Report on
Adolescent
Reproductive Health
Preliminary Report
Statistics Indonesia
National Population and Family Planning Board
Ministry of Health
The 2012 Indonesia Demographic and Health Survey (IDHS) was carried out by Statistics Indonesia (Badan Pusat Statistik—BPS) in collaboration with the National Population and Family Planning Board (BKKBN) and the Ministry of Health (MOH). Funding for the local costs of the survey was provided by the government of Indonesia. ICF International provided technical assistance under the auspices of the Demographic and Health Surveys (MEASURE DHS) program, which is funded by the U.S. Agency for International Development (USAID).
Additional information about the survey may be obtained from the Directorate for Population and Labor Force Statistics, BPS, Jalan Dr. Sutomo No. 6-8, Jakarta 10710, Indonesia (Telephone/fax: 345-6285; E-mail: [email protected]), or BKKBN, Jalan Permata 1, Halim Perdanakusumah, Jakarta 13650, Indonesia (Telephone/fax: 800-8557; E-mail: [email protected]), or the Institute for Research and Development, Ministry of Health, Jalan Percetakan Negara 29, Jakarta 10560, Indonesia (Telephone: 426-1088; Fax: 424-3935; E-mail: [email protected]).
Indonesia Demographic
and Health Survey 2012
Special Report on
Adolescent Reproductive Health
Preliminary Report
Statistics Indonesia
Jakarta, Indonesia
National Population and Family Planning Board
Jakarta, Indonesia
Ministry of Health
Jakarta, Indonesia
MEASURE DHS
ICF International
Calverton, Maryland, USA
iii
C
ONTENTSPage
TABLES AND FIGURES ... v
I INTRODUCTION 1.1 Background ... 1
1.2 Objectives of the Survey ... 1
II SURVEY IMPLEMENTATION 2.1 Questionnaires ... 2
2.2 Sample Design ... 2
2.3 Training and Fieldwork... ... 3
2.4 Data Proccesing ... 3
III RESULTS 3.1 Response Rates ... 4
3.2 Respondent’s Characteristics ... 4
3.3 Exposure to Mass Media ... 5
3.4 Knowledge of Phyisical Changes at Puberty ... 7
3.5 Discussion of Reproductive Health ... 8
3.6 Knowledge of Contraceptive Methods ... 9
3.7 Attitudes about Marriage ... 9
3.8 Ideal Age at First Birth ... 11
3.9 Smoking, Alcohol Drinking, and Drug Use ... 13
3.10 Knowledge of HIV Prevention Methods ... 13
3.11 Attitudes about Premarital Sex ... 14
v
T
ABLES ANDF
IGURESPage
Table 1 Results of the household and individual interviews ... 4
Table 2 Background characteristics of respondents ... 5
Table 3 Exposure to mass media ... 6
Table 4 Knowledge of physical changes at puberty ... 7
Table 5.1 Discussion of menstruation before first menstruation: women ... 8
Table 5.2 Discussion of wet dreams before having first wet dream: men ... 8
Table 6 Knowledge of contraceptive methods... 9
Table 7.1 Ideal age at first marriage for women ... 10
Table 7.2 Ideal age of first marriage for men ... 11
Table 8.1 Ideal age at first birth for women ... 12
Table 8.2 Ideal age at first birth for men ... 12
Table 9 Use of smoking tobacco, alcohol and drugs ... 13
Table 10 Knowledge of HIV prevention methods ... 13
Table 11 Attitudes about premarital sex ... 14
Table 12 Sexual experience ... 15
1
I. I
NTRODUCTION1.1 Background
The 2012 Indonesia Demographic and Health Survey (IDHS) was carried out by Statistics Indonesia (Badan Pusat Statistik—BPS) in collaboration with the National Population and Family Planning Board (BKKBN) and the Ministry of Health (MOH). Funding for the local costs of the survey was provided by the government of Indonesia. ICF International provided technical assistance under the auspices of the Demographic and Health Surveys (MEASURE DHS) program, which is funded by the U.S. Agency for International Development (USAID). Indonesia has conducted seven DHS surveys to date. The 2012 IDHS updates estimates of basic demographic and health indicators determined in previous IDHS surveys. In a departure from past DHS surveys in Indonesia, however, which cover only ever-married women age 15-49, the 2012 IDHS includes never-married women age 15-49.
Among never-married women, those age 15-24 were asked questions about their knowledge of the human reproductive system; use of tobacco, alcohol, and other drugs; and dating and sexual experiences. These questions were included in the original reproductive health survey administered to young adults years earlier as part of the 2007 IYARHS.
The 2012 IDHS also interviewed currently married men age 15-54, and never-married men age 15-24, who were asked questions similar to those asked of never-married women age 15-24. This part of the IDHS is called the Adolescent Reproductive Health (ARH) component of the 2012 IDHS. This report presents a first look at selected findings of the ARH component. A comprehensive analysis of the data will be published in August 2013. While considered provisional, the results presented here are not expected to differ significantly from those presented in the final report.
1.2 Objectives of the Survey
Specifically, the ARH component of the 2012 IDHS was designed to do the following:
• Measure the knowledge of adolescents about reproductive health issues • Examine attitudes of adolescents on various issues in reproductive health • Evaluate tobacco use, alcohol consumption, and drug use
• Assess sexual activity among adolescents
2
II. S
URVEYI
MPLEMENTATION2.1 Questionnaires
The 2012 IDHS used four questionnaires: the Household Questionnaire, the Woman’s Questionnaire, the Married Man’s Questionnaire, and the Never-Married Man’s Questionnaire. Because of the change in survey coverage from ever-married women age 15-49 in the 2007 IDHS to all women age 15-49 in the 2012 IDHS, the Woman’s Questionnaire had questions added for never-married women age 15-24. These questions had previously been a part of the 2007 Indonesia Young Adult Reproductive Survey questionnaire.
The Household Questionnaire and the Woman’s Questionnaire are largely based on standard DHS phase VI questionnaires (March 2011 version). The model questionnaires were adapted for use in Indonesia. The Household Questionnaire listed all the usual members and visitors who spent the previous night in the selected households. Basic information collected on each person included age, sex, education, marital status, and relationship to the head of the household. The main purpose of the Household Questionnaire was to identify women and men who were eligible for individual interview.
The Woman’s Questionnaire was used to collect information from all women age 15-49. These women were asked questions on background characteristics such as marital status, education, and media exposure; reproductive history and fertility preferences; knowledge and use of family planning methods; antenatal, delivery, and postnatal care; breastfeeding and infant and young child feeding practices; vaccinations and childhood illnesses; marriage and sexual activity; fertility preferences; husband’s employment and background characteristics; childhood mortality; awareness and behavior regarding AIDS and other sexually transmitted infections (STIs); and sibling and maternal mortality.
Questions asked of never-married women age 15-24 included additional background characteristics; knowledge of the human reproductive system; attitudes toward marriage and having children; the role of family, school, community, and media; use of smoking tobacco, alcohol, and drugs; and dating and sexual activity.
The questionnaire for never-married men age 15-24 included the same questions asked of never- married women age 15-24.
2.2 Sample Design
The 2012 IDHS sample was selected using a stratified three-stage design. In the first stage, primary sampling units (PSUs) were selected with a probability proportional to the number of households listed during the 2010 population census. A PSU is a group of contiguous census blocks; each is assigned to a census team coordinator. In the second stage, a census block was selected from each PSU; each had a probability proportional to the number of households in the PSU. In the third stage, 25 households were selected systematically from each census block.
The 2012 IDHS sample included 1,840 census blocks: 874 in urban areas and 966 in rural areas. The sample was intended to provide reliable estimates of key characteristics of all women age 15-49 and of married men age 15-54 in Indonesia as a whole, in urban and rural areas, and in each of 33 provinces. The sample was targeted to yield 46,000 household interviews, 55,200 interviews with women, 13,250 interviews with married men, and 23,000 interviews with never-married men.
3 2.3 Training and Fieldwork
A total of 922 persons, 546 women and 376 men, participated in the 2012 IDHS main survey training for interviewers. Training took place in May 2012 in nine training centers: Batam, Bukit Tinggi, Banten, Yogyakarta, Denpasar, Banjarmasin, Makasar, Manokwari, and Jayapura. The training included class presentations, mock interviews, and tests. In each training center, participants were grouped into three different classes, consisting of interviewers of women, married men, and never-married men. All of the participants were trained using the household and individual questionnaires.
The 2012 IDHS employed 119 interviewing teams to collect the data. From each team, one person was assigned to conduct interviews with never-married men in the selected households. Female interviewers on the team interviewed all women age 15-49, including never-married women age 15-24.
Fieldwork took place from May 7, 2012, to July 31, 2012.
2.4 Data Processing
4
III. R
ESULTSThis section of the report focuses on key findings from the adolescent reproductive health component of the 2012 IDHS.
3.1 Response Rates
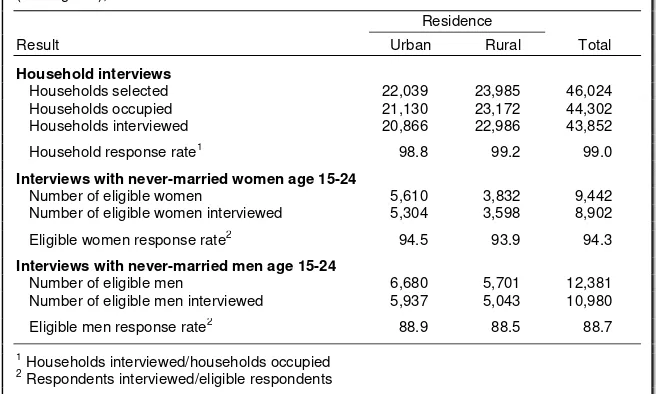
Table 1 shows response rates for the 2012 IDHS. The survey selected a total of 46,024 households, of which 44,302 were occupied. Of these households, 43,852 were successfully interviewed, yielding a household response rate of 99 percent.
In the interviewed households, 9,442 never-married women age 15-24 were eligible for individual interview, and 8,902 were successfully interviewed, yielding a response rate of 94 percent. In the same households, 12,381 never-married men age 15-24 were eligible for interview. Of these men, 10,980 were successfully interviewed, yielding a response rate of 89 percent. In general, response rates in rural areas were similar to those in urban areas.
Table 1. Results of the household and individual interviews
Number of households, number of interviews, and response rates, according to residence (unweighted), Indonesia 2012
Result
Residence
Total
Urban Rural
Household interviews
Households selected 22,039 23,985 46,024
Households occupied 21,130 23,172 44,302
Households interviewed 20,866 22,986 43,852
Household response rate1 98.8 99.2 99.0
Interviews with never-married women age 15-24
Number of eligible women 5,610 3,832 9,442
Number of eligible women interviewed 5,304 3,598 8,902
Eligible women response rate2 94.5 93.9 94.3
Interviews with never-married men age 15-24
Number of eligible men 6,680 5,701 12,381
Number of eligible men interviewed 5,937 5,043 10,980
Eligible men response rate2 88.9 88.5 88.7
1 Households interviewed/households occupied 2 Respondents interviewed/eligible respondents
3.2 Respondent’s Characteristics
This section provides background information on adolescents in Indonesia. The main background characteristics used to analyze differentials in knowledge, attitudes, and practices in reproductive health are age, urban-rural residence, and education level. Table 2 shows the distribution of unmarried women and men age 15 to 24 in the ARH component of the 2012 IDHS sample.
5
Three percent of women and 5 percent of men age 15-24 have less than primary school education. Forty-three percent of women have completed secondary or higher education compared with 35 percent of men. Compared with data from the 2007 IYARHS, educational attainment of young, never-married women and men in Indonesia has improved. For instance, in 2007 the percentages of young women and men who completed secondary or higher education were 38 and 31 percent, respectively.
Table 2. Background characteristics of respondents
Percent distribution of never-married women and men age 15-24 by background characteristics, Indonesia 2012
Background characteristic
Never-married women Never-married men
Weighted
Completed secondary or higher 42.9 3,615 3,978 35.3 3,877 4,153
Total 100.0 8,419 8,902 100.0 10,980 10,980
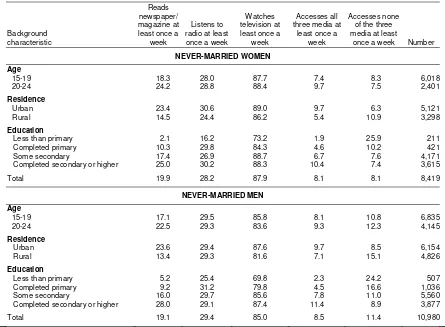
3.3 Exposure to Mass Media
Knowledge of the type of media most used by adolescents is important when designing a mass media strategy to reach them. Table 3 and Figure 1 show that young women are as likely as young men to be exposed to various mass media. Young women are as likely as young men to read a newspaper or magazine, watch television, and listen to the radio. Overall, the media used most often by adolescents is television; 88 percent of young women and 85 percent of young men watch television at least once a week. On the other hand, printed materials are the least popular form of media, read once a week by 20 percent of never-married women and 19 percent of never-married men.
6
Table 3. Exposure to mass media
Percentage of never-married women and men age 15-24 who are exposed to specific media on a weekly basis by background characteristics, Indonesia 2012
Exposure to Mass Media
7 3.4 Knowledge of Physical Changes at Puberty
In the ARH component of the 2012 IDHS, to gauge knowledge about physical change as a boy or a girl grows from childhood into adolescence, the respondents were asked to name as many signs of physical change as they knew. Their responses were spontaneous, unprompted in any way by the interviewers. Table 4 presents the findings.
The change most often cited in a boy by female respondents is the change in voice (69 percent of women), followed by growth of facial hair, pubic hair, and hair on chest, legs, and arms (43 percent of women). The change most often cited by men (50 percent) was growth of facial hair, pubic hair, and hair on chest, legs, and arms; also commonly mentioned was a change in voice (49 percent). Women were more likely than men to mention growth in the Adam’s apple (53 percent and 31 percent, respectively), while men were more likely than women to mention wet dreams (34 percent and 30 percent, respectively). The least-reported change by women and men was hardening of the nipples.
Among girls, the change most often cited by female respondents was menstruation (83 percent) followed by growth in breasts (73 percent). Male respondents adhered to the reverse pattern; they were more likely to mention growth in breasts (58 percent) followed by menstruation (43 percent).
It was noteworthy that few respondents mentioned an increase in sexual arousal as one of the signs of adolescence in a girl (4 percent of women and 3 percent of men) or in a boy (4 percent of women and 6 percent of men).
Table 4. Knowledge of physical changes at puberty
Percent distribution of never-married women and men age 15-24 who know of specific physical changes in a boy and a girl at puberty, by age, Indonesia 2012
Indicators of physical changes
Never-married women Never-married men
15-19 20-24 Total 15-19 20-24 Total
In a boy
Develop muscles 22.4 29.3 24.4 18.4 22.7 20.0
Change in voice 69.3 66.7 68.6 50.3 45.5 48.5
Growth of facial hair, pubic hair, or
hair on chest, legs, and arms 43.4 42.5 43.1 50.2 49.7 50.0
Growth of pubic hair and underarm
hair 31.7 31.7 31.7 22.0 21.8 21.9
Growth in breasts 72.4 73.9 72.8 57.3 58.9 57.9
Growth in hips 28.8 21.8 26.8 19.4 15.7 18.0
Increase in sexual arousal 3.0 6.3 3.9 2.8 3.9 3.2
Menstruation 81.9 85.1 82.8 42.4 44.5 43.2
Other 11.9 14.5 12.6 12.4 14.8 13.3
Don't know any signs 4.7 4.8 4.7 21.2 19.2 20.4
Number 6,018 2,401 8,419 6,835 4,145 10,980
8 3.5 Discussion of Reproductive Health
In the ARH component of the 2012 IDHS female respondents were asked whether they had talked with anyone about menstruation before they had their first period. Table 5.1 shows that more than half of the women report discussing menstruation with their friends (53 percent) or with their mother (41 percent). Only one in four women did not discuss menstruation with anyone before their first menses.
Table 5.1 Discussion of menstruation before first menstruation: Women
Among never-married women age 15-24 who have begun menstruation, percentage who discussed menstruation with specific persons before first menstruation, by age, Indonesia 2012
Person with whom
Male respondents were asked about their experiences with wet dreams, including discussions about wet dreams with anyone before their occurrence. Men are less likely than women to talk to others about their experience with the physical changes that occur at puberty. Table 5.2 shows that half of men (50 percent) did not talk with anyone, and almost half of men (48 percent) talked with their friends. There are only small differences by respondent’s age, except that men age 15-19 are more likely than men age 20-24 to discuss this experience with their teachers (20 and 14 percent, respectively).
Table 5.2 Discussion of wet dreams before first wet dream: Men
Among never-married men age 15-24 who had wet dreams, percentage who discussed wet dreams with specific persons before first wet dream, by age, Indonesia 2012
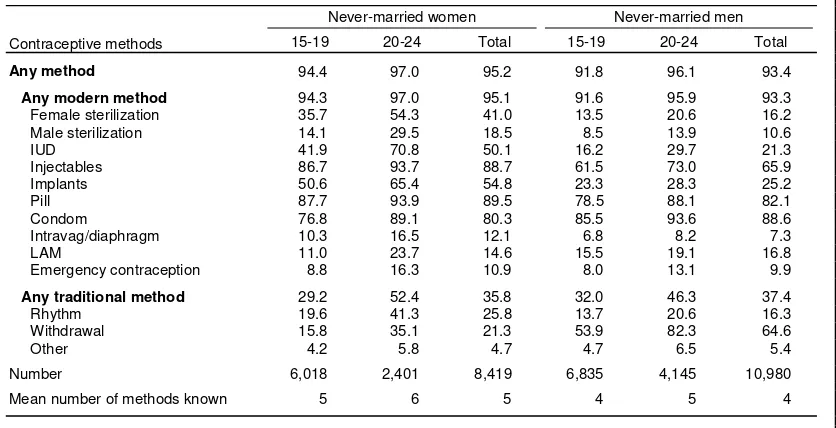
9 3.6 Knowledge of Contraceptive Methods
In the ARH component of the 2012 IDHS respondents were asked if they had heard of any family planning methods. For methods not mentioned, the interviewer read a description of the method and asked if the respondent had heard of it. Table 6 shows that 95 percent of women and 93 percent of men age 15-24 have heard of at least one contraceptive method. Knowledge of modern contraceptive methods among never-married adolescents in Indonesia is widespread. Overall, women are more knowledgeable than men about ways to avoid pregnancy using a modern contraceptive method (95 percent compared with 93 percent). Never-married adolescents in Indonesia are much less familiar with traditional contraceptive methods. On average, women know five contraceptive methods compared with men, who know an average of four methods.
The most popular methods among women are the pill (90 percent) and injectables (89 percent). Eight in ten women know about the male condom (80 percent). As expected, the methods most commonly known by men are condoms (89 percent). Knowledge of the pill and injectables is also high among men (82 percent and 66 percent, respectively).
In general, women and men age 20-24 are more likely than their younger counterparts (age 15-19) to have heard of family planning methods.
Table 6. Knowledge of contraceptive methods
Percentage of all never-married women and men age 15-24 who have heard of any contraceptive method, by specific method, according to age, Indonesia 2012
Contraceptive methods
Never-married women Never-married men
15-19 20-24 Total 15-19 20-24 Total
Any traditional method 29.2 52.4 35.8 32.0 46.3 37.4
Rhythm 19.6 41.3 25.8 13.7 20.6 16.3
Withdrawal 15.8 35.1 21.3 53.9 82.3 64.6
Other 4.2 5.8 4.7 4.7 6.5 5.4
Number 6,018 2,401 8,419 6,835 4,145 10,980
Mean number of methods known 5 6 5 4 5 4
LAM = Lactational amenorrhea method
3.7. Attitudes about Marriage
In the ARH component of the 2012 IDHS respondents were asked what they consider the best age for a woman and a man to get married. The findings are presented in Table 7.1 for women and Table 7.2 for men.
10
The proportion of women who say that the ideal age at marriage is 25 or older increases with the woman’s education. Forty percent of women with secondary or higher education say that the ideal age at first marriage is 25 or older compared with 20 percent of women with less than primary education. It should be noted that almost 3 in 10 women with less than primary education did not give a numeric response.
Table 7.1 also shows that the majority of men (64 percent) say that the ideal age for a woman to get married is between 20 and 24, One in five men say that ideally women should marry at age 25 or older. Older men and men who live in urban areas are more likely than other men to say that the ideal age for women to marry is 25 or older. Men with higher education are also more likely than men with less education to say that it is best for women to marry at age 25 or older.
In summary, the median ideal age at first marriage for women, according to women, is 23.8, and the median ideal age at first marriage for women, according to men, is 22.9.
Table 7.1 Ideal age at first marriage for women
Percent distribution of never-married women and men age 15-24 by ideal age at first marriage for women, according to background characteristics, Indonesia 2012
Background characteristic
Ideal age at first marriage for women
Total Number Median
<20 20-24 25+
11
The median age that both women and men report as the ideal age for men to marry is around 26 years.
Table 7.2 Ideal age at first marriage for men
Percent distribution of never-married women and men age 15-24 by ideal age at first marriage for men, according to background characteristics, Indonesia 2012
Background characteristic
Ideal age at first marriage for men
Total Number Median
<20 20-24 25+
Less than primary 3.6 20.2 44.7 31.5 100.0 211 27.2
Completed primary 1.4 24.7 59.1 14.9 100.0 421 25.7
Some secondary 0.6 15.8 76.3 7.3 100.0 4,171 25.9
Completed secondary or higher 0.3 5.4 91.6 2.8 100.0 3,615 26.8
Total 0.6 17.6 76.3 5.5 100.0 10,980 25.7
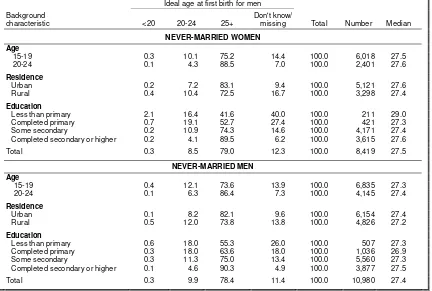
3.8 Ideal Age at First Birth
In the ARH component of the 2012 IDHS, respondents were asked their opinion on the best age for a woman and a man to have a first child. Women are equally likely to say that the ideal age for a woman to have her first child is between age 20 and 24 (44 percent) or age 25 or older (45 percent). Men want women to have a child sooner than women themselves do; 49 percent want women to have a child at age 20-24, and 37 percent want one at age 25 or older.
Older women are more likely than younger women to cite an older age for women to have their first child. For example, 53 percent of women age 20-24 think it’s best for a woman to have her first child at age 25 or older, compared with 42 percent of women age 15-19. The idea of an older age at first birth for women is shared with urban women and increases with women’s education.
There are small differences in men’s opinions about the ideal age for a woman to have her first child. It should be noted that more than 3 in 10 women with less than primary education did not give a numeric response to the question.
12
Table 8.1 Ideal age at first birth for women
Percent distribution of never-married women and men age 15-24 by ideal age at first birth for women, according to background characteristics, Indonesia 2012
Background characteristic
Ideal age at first birth for women
Total Number Median
<20 20-24 25+
Less than primary 3.9 40.6 21.6 33.9 100.0 211 25.6
Completed primary 2.7 48.3 26.8 22.2 100.0 421 24.6
Some secondary 1.4 45.0 41.7 11.8 100.0 4,171 25.2
Completed secondary or higher 0.3 42.8 52.3 4.6 100.0 3,615 25.3
Less than primary 5.0 45.2 21.5 28.2 100.0 507 24.9
Completed primary 5.4 53.7 20.9 20.0 100.0 1,036 23.4
Some secondary 2.2 48.8 34.7 14.4 100.0 5,560 24.9
Completed secondary or higher 0.9 47.1 46.5 5.5 100.0 3,877 25.1
Total 2.2 48.5 36.9 12.4 100.0 10,980 24.9
Table 8.2 Ideal age at first birth for men
Percent distribution of never-married women and men age 15-24 by ideal age at first birth for men, according to background characteristics, Indonesia 2012
Background characteristic
Ideal age at first birth for men
Total Number Median
13 3.9 Smoking, Alcohol Drinking, and Drug Use
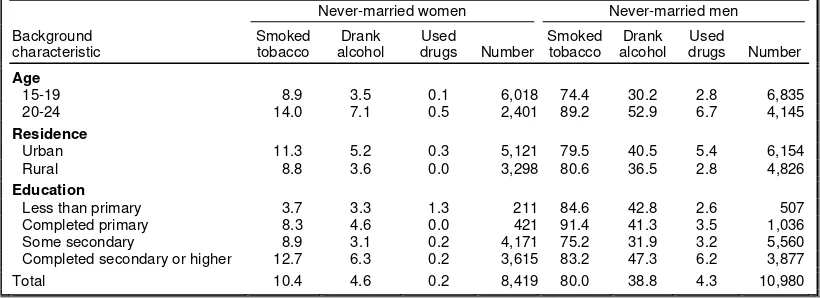
Table 9 shows the percentage of respondents who currently smoke, who drank alcohol in the past three months, and who have ever used drugs. Data for women indicate that 10 percent have smoked tobacco and 5 percent have drunk alcohol; men are more likely to be involved in such behavior. For men, the corresponding percentages are 80 and 40 percent, respectively. Use of drugs is much more limited, less than 1 percent for women and 4 percent for men. Older respondents, those living in urban areas, and those with a higher level of education are more likely to be engaged in drug use than other respondents.
Table 9. Use of smoking tobacco, alcohol, and drugs
Percentage of never-married women and men age 15-24 who smoked a cigarette, drank alcohol, or used drugs, by background characteristics, Indonesia 2012
Background characteristic
Never-married women Never-married men
Smoked
Completed secondary or higher 12.7 6.3 0.2 3,615 83.2 47.3 6.2 3,877
Total 10.4 4.6 0.2 8,419 80.0 38.8 4.3 10,980
3.10 Knowledge of HIV prevention methods
Respondents in the survey were also asked about their knowledge of HIV/AIDS and ways to reduce the risk of contracting the infection. Table 10 shows that overall, 67 percent of women and 63 percent of men say that HIV can be prevented by using condoms every time a person has sexual intercourse. Older respondents, those living in urban areas, and better-educated respondents are more likely to know about this prevention method.
Table 10. Knowledge of HIV prevention methods
Percent distribution of never-married women and men age 15-24 by knowledge of HIV prevention methods, by background characteristics, Indonesia 2012
Background
one partner Number
Completed primary 30.9 15.2 421 Some secondary 61.7 38.6 4,171
Completed secondary or higher 79.4 60.2 3,615
Completed primary 32.4 34.1 1,036 Some secondary 60.4 55.4 5,560
Completed secondary or higher 79.9 74.8 3,877
Total 63.1 58.8 10,980
14
Another way to prevent getting HIV is by limiting sexual intercourse to one partner. This method is known to 46 percent of women and 59 percent of men. Older respondents, respondents in urban areas, and better-educated respondents are most likely to know about this prevention method.
3.11 Attitudes about Premarital Sex
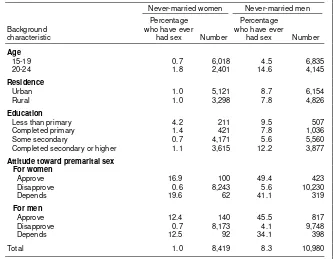
In the ARH component of the 2012 IDHS respondents were asked about attitudes and practices in sexual behavior. Table 11 shows that, as expected, acceptance of premarital sex is very low. In general, women are much less likely than men to approve of premarital sex. Only 1 percent of women and 4 percent of men say that women can have sex before marriage. Men are less likely than women to be stigmatized for having premarital sex; 2 percent of women and 7 percent of men say that they approve of men having sex before marriage.
There are small variations in acceptance of premarital sex among women, except by education. In general, women and men with less primary education are more open to premarital sex than their better- educated counterparts. For example, 11 percent of men with less than primary education approve of premarital sex for men compared with 9 percent of men with higher education.
Table 11. Attitudes about premarital sex
15 3.12 Sexual Experience
In the ARH component of the 2012 IDHS respondents were also asked about their own sexual experience. Overall, only 1 percent of female respondents reported having had sex (Table 12). Men are somewhat more likely than women to have had sexual experience (8 percent). There are only slight differences in sexual experience among women by age, but older men are more experienced in sex than younger men (15 percent compared with 5 percent). Men with secondary or higher education are more likely to have had sex than men with less education.
Table 12. Sexual experience
Percentage of never-married women and men age 15-24 who have ever had sex, by background characteristics, Indonesia 2012
Background characteristic
Never-married women Never-married men
Percentage
Attitude toward premarital sex For women
Note: Total includes women and men with missing information on attitude toward premarital sex.