Refer to Important disclosures in the last page of this report
Stock DataTarget price (Rp) Rp5,100
Prior TP (Rp) Rp3,900
Shareprice (Rp) Rp4,260
Upside/downside (%) +19.7
Sharesoutstanding (m) 10,540
Marketcap. (US$ m) 3,098
Inalum (Persero) 65.0%
Estimate Change; Vs. Consensus
2018F 2019F PT Indo Premier Sekuritas [email protected] +62 21 5793 1170
Growing against challenges
Good 2Q18 results despite pressure from DMO pricing.
Benefit by abundant coal reserves and low production costs.
High production growth despite scarcity of heavy equipment.
Maintain Buy with higher TP of Rp5,100 (prev: Rp3,900).
Better than expected 2Q18 results as export sales contribution increased.
PTBA reported better than expected 2Q18 results with 1H18 net profit represent
53% and 67% of consensus’ and our forecast for FY18F, respectively. Earnings
dropped 23% qoq but up 32% yoy in 2Q18, mainly caused by DMO pricing
regulation (released on March 2018). However, PTBA managed to control
production costs, allowing the company to enjoy higher gross margin of 42% and
operating margin of 33.5% in 1H18. Cash cost (including opex and royalties)
dropped 10% yoy to Rp614k per ton in 1H18. We also note that despite pressure
from DMO pricing, coal ASP increased 8.7% yoy to Rp838k/ton in 1H18 on the
back of higher export contribution of 48% (vs. 36% in 1H17).
PTBA is benefited by abundant coal reserves and low production costs.
PTBA holds the largest coal reserves and the longest mine-life within our coverage
of four coal companies. PTBA had the option to change its sales mix and increase
export sales in 1H18 as the company holds abundant coal reserves with calorific
value ranging from 4,500-7,000 kcal/kg (adb). Additionally, PTBA enjoyed low
production costs supported by low stripping ratio of 4x-4.5x (1H18: 4.3x) and
efficient train transportation costs. With these low and efficient costs, PTBA’s
margin is the highest among its peers.
Minimal impact from the shortage of heavy equipment.
PTBA recorded
production volumes of 11.2mn tons in 1H18, increased 19% yoy, which we
believe the highest compared to the peers. The impact of insufficiency of new
heavy equipments in the market is minimal for PTBA as the company’s coal seam
is very thick which allows PTBA to apply slightly different mining method
(compared to the peers) with the application of Bucket Wheel Excavator (Fig. 4).
Thus, with increasing train transportation capacity (1H18: +8.5% yoy), PTBA
could increase productivity.
Maintain Buy with higher TP of Rp5,100 (prev: Rp3,900).
We maintain our
Buy recommendation for PTBA with higher DCF-based (WACC: 13.3%, TG: 2%)
target price of Rp5,100 (previously Rp3,900) as we raise our earnings forecast by
28% and 19% for FY18F and FY19F, respectively. We like PTBA as the company
booked strong production volumes growth of 19% yoy in 1H18 while its low SR of
4.3x allows the company to enjoy higher-than-peers’ margins. PTBA is currently
trades at FY18F P/E of 9.1x, lower than the average P/E of 11x in the past
7-years. Please note that or new TP of Rp5,100 implies FY18F P/E of 10.9x.
Bukit Asam
(
PTBA IJ
)
Source: PTBA, IndoPremier Share Price Closing as of : 20-July-2018
2
Refer to Important disclosures in the last page of this report
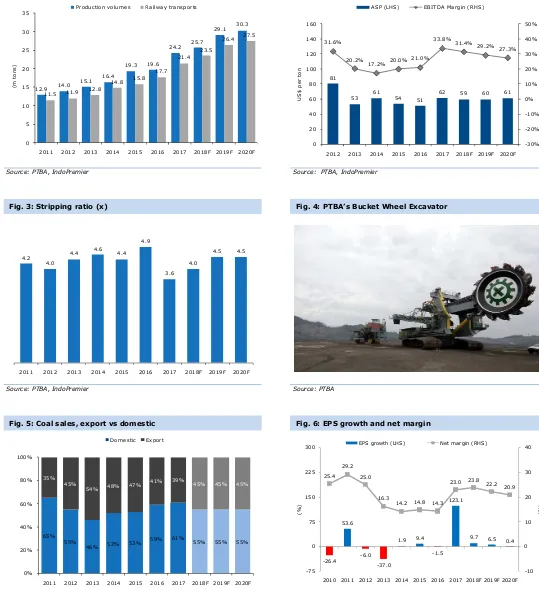
Fig. 1: Production and railway transport volumes Fig. 2: ASP and EBITDA margin
Source: PTBA, IndoPremier Source: PTBA, IndoPremier
Fig. 3: Stripping ratio (x) Fig. 4: PTBA’s Bucket Wheel Excavator
Source: PTBA, IndoPremier Source: PTBA
Fig. 5: Coal sales, export vs domestic Fig. 6: EPS growth and net margin
Source: PTBA Source: PTBA, IndoPremier
12.9 14.0
2011 2012 2013 2014 2015 2016 2017 2018F 2019F 2020F
(m
Production volumes Railway transports
81
2012 2013 2014 2015 2016 2017 2018F 2019F 2020F
US
ASP (LHS) EBITDA Margin (RHS)
4.2
2011 2012 2013 2014 2015 2016 2017 2018F 2019F 2020F
65%
2011 2012 2013 2014 2015 2016 2017 2018F 2019F 2020F Domestic Export
2010 2011 2012 2013 2014 2015 2016 2017 2018F 2019F 2020F
(%
)
(%
)
3
Refer to Important disclosures in the last page of this report
Fig. 8: 2Q18 results summary
(Rp Bn) 1H18 1H17 % Y-Y 2Q18 % Q-Q % Y-Y vs. cons. vs. ours
Revenues 10,525 8,967 17.4 4,776 (16.9) 8.1 47.9 51.5
COGS 6,101 5,622 8.5 2,935 (7.3) 6.0
Gross profit 4,424 3,345 32.2 1,842 (28.7) 11.4 49.2 58.0
G&A expenses 564 517 9.2 239 (26.6) (8.1)
Selling expenses 449 444 1.2 197 (21.6) 7.6
Other 112 93 20.7 77 121.9 71.0
Operating profit 3,523 2,477 42.2 1,483 (27.3) 18.2 56.7 72.1
Net interest inc. (exp) 22 (68) neg 13 31.6 neg
Other 50 66 (23.9) 20 (33.0) (36.0)
Pretax profit 3,595 2,475 45.3 1,516 (27.1) 20.6 54.4 68.9
Tax 975 728 34.0 369 (39.1) (6.1)
Minority Interest 44 23 90.8 21 (5.9) 114.9
Net profit 2,576 1,724 49.4 1,125 (22.5) 31.9 53.2 67.3
GPM (%) 42.0 37.3 38.6
OPM (%) 33.5 27.6 31.0
Pretax mgn (%) 34.2 27.6 31.7
NPM (%) 24.5 19.2 23.6
Source: PTBA, IndoPremier
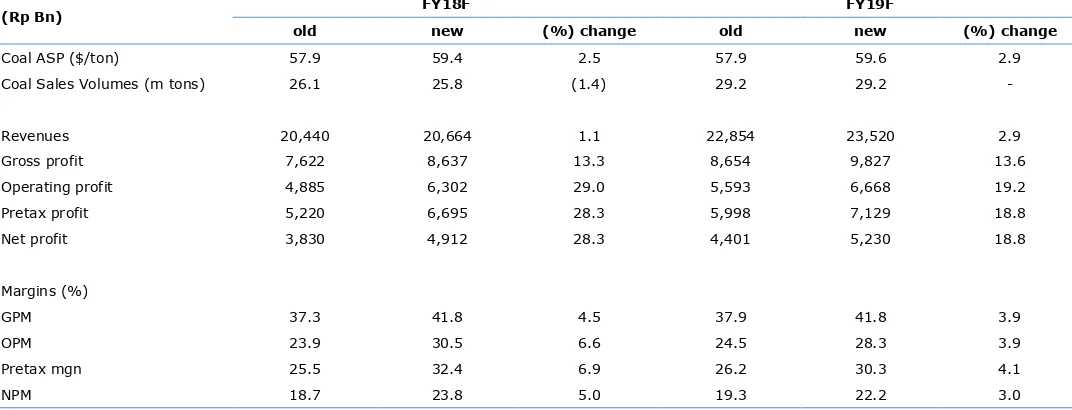
Fig 8. Earnings revisions
(Rp Bn) FY18F FY19F
old new (%) change old new (%) change
Coal ASP ($/ton) 57.9 59.4 2.5 57.9 59.6 2.9
Coal Sales Volumes (m tons) 26.1 25.8 (1.4) 29.2 29.2 -
Revenues 20,440 20,664 1.1 22,854 23,520 2.9
Gross profit 7,622 8,637 13.3 8,654 9,827 13.6
Operating profit 4,885 6,302 29.0 5,593 6,668 19.2
Pretax profit 5,220 6,695 28.3 5,998 7,129 18.8
Net profit 3,830 4,912 28.3 4,401 5,230 18.8
Margins (%)
GPM 37.3 41.8 4.5 37.9 41.8 3.9
OPM 23.9 30.5 6.6 24.5 28.3 3.9
Pretax mgn 25.5 32.4 6.9 26.2 30.3 4.1
NPM 18.7 23.8 5.0 19.3 22.2 3.0
4
Refer to Important disclosures in the last page of this report
Year To 31 Dec (RpBn) 2016A 2017A 2018F 2019F 2020F
Income Statement
Net Revenue 14,059 19,471 20,664 23,989 26,544
Cost of Sales (9,657) (10,965) (12,027) (13,781) (15,374)
Gross Profit 4,401 8,507 8,637 10,207 11,170
SG&A Expenses (1,871) (2,608) (2,335) (3,126) (3,379)
Operating Profit 2,531 5,899 6,302 7,081 7,790
Net Interest 53 81 213 269 329
Forex Gain (Loss) 0 0 (10) (11) (13)
Others-Net 150 122 189 220 243
Pre-Tax Income 2,734 6,102 6,695 7,559 8,349
Income Tax (709) (1,554) (1,706) (1,926) (2,127)
Minorities (18) (71) (78) (88) (97)
Net Income 2,006 4,476 4,912 5,545 6,126
Balance Sheet
Cash & Equivalent 3,675 3,555 4,683 5,748 6,902
Receivable 2,285 5,344 5,671 6,584 7,285
Inventory 1,102 1,156 1,268 1,453 1,621
Other Current Assets 1,288 1,063 1,128 1,309 1,449
Total Current Assets 8,350 11,118 12,750 15,094 17,256
Fixed Assets - Net 7,516 7,466 8,210 9,043 10,287
Goodwill 0 0 0 0 0
Non Current Assets 1,315 1,905 2,245 2,645 3,117
Total Assets 18,577 21,987 24,778 28,434 32,395
ST Loans 958 208 208 208 208
Payable 539 886 0 1,114 1,243
Other Payables 3,065 3,328 3,532 4,100 4,537
Current Portion of LT Loans 481 91 0 0 0
Total Current Liab. 5,043 4,513 4,712 5,422 5,988
Long Term Loans 167 36 36 36 36
Other LT Liab. 2,814 3,638 4,670 5,994 7,694
Total Liabilities 8,024 8,187 9,418 11,452 13,718
Equity (944) (956) (956) (956) (956)
Retained Earnings 11,366 14,565 16,119 17,735 19,424
Minority Interest 131 192 198 204 210
Total SHE + Minority Int. 10,552 13,800 15,360 16,982 18,677
Total Liabilities & Equity 18,577 21,987 24,778 28,434 32,395
5
Refer to Important disclosures in the last page of this report
Year to 31 Dec 2016A 2017A 2018F 2019F 2020F
Cash Flow
Net Income (Excl.Extraordinary&Min.Int) 2,036 2,006 4,476 4,912 5,545
Depr. & Amortization 332 428 677 194 203
Changes in Working Capital (1,167) 631 3,297 1,433 1,634
Others 697 (1,137) (6,035) (558) (694)
Cash Flow From Operating 1,898 1,928 2,415 5,982 6,688
Capital Expenditure (1,247) (574) (677) (943) (1,051)
Others 134 259 141 0 0
Cash Flow From Investing (1,113) (315) (536) (943) (1,051)
Loans (426) (237) (881) 0 0
Equity 0 0 0 0 0
Dividends (706) (611) (602) (3,357) (3,930)
Others (663) (163) (524) (556) (646)
Cash Flow From Financing (1,795) (1,011) (2,007) (3,914) (4,575)
Changes in Cash (924) 559 (119) 1,128 1,065
Financial Ratios
Gross Margin (%) 31.3 43.7 41.8 42.6 42.1
Operating Margin (%) 18.0 30.3 30.5 29.5 29.3
Pre-Tax Margin (%) 19.4 31.3 32.4 31.5 31.5
Net Margin (%) 14.3 23.0 23.8 23.1 23.1
ROA (%) 11.3 22.1 21.0 20.8 20.1
ROE (%) 20.2 36.8 33.7 34.3 34.4
ROIC (%) 19.1 35.9 35.1 36.0 36.3
Acct. Receivables TO (days) 50.4 71.5 97.3 93.2 95.4
Acct. Receivables - Other TO (days) 0.0 0.0 0.0 0.0 0.0
Inventory TO (days) 8.3 9.7 9.9 10.1 10.0
Payable TO (days) 31.9 23.7 28.2 27.6 28.0
Acct. Payables - Other TO (days) 0.0 0.0 0.0 0.0 0.0
Debt to Equity (%) 15.2 2.4 1.6 1.4 1.3
Interest Coverage Ratio (x) 0.1 0.0 0.0 0.0 0.0
Net Gearing (%) (19.6) (23.3) (28.9) (32.4) (35.6)
Head Office
PT INDO PREMIER SEKURITAS
Wisma GKBI 7/F Suite 718
Jl. Jend. Sudirman No.28
Jakarta 10210 - Indonesia
p +62.21.5793.1168
f +62.21.5793.1167
INVESTMENT RATINGS
BUY : Expected total return of 10% or more within a 12-month period HOLD : Expected total return between -10% and 10% within a 12-month period SELL : Expected total return of -10% or worse within a 12-month period
ANALYSTS CERTIFICATION.
The views expressed in this research report accurately reflect the analysts personal views about any and all of the subject securities or issuers; and no part of the research analyst's compensation was, is, or will be, directly or indirectly, related to the specific recommendations or views expressed in the report.
DISCLAIMERS
![Studi Induksi Kalus Androgenik Pisang Batu [Musa balbisiana (Bb)] Pada Berbagai Media Dengan Penambahan Putresin](data:image/gif;base64,R0lGODlhAQABAIAAAP///wAAACH5BAEAAAAALAAAAAABAAEAAAICRAEAOw==)