MINISTRY OF ENVIRONMENT AND FORESTRY
RESEARCH, DEVELOPMENT AND INNOVATION AGENCY
Proceedings of International Conference of
Indonesia Forestry Researchers III-2015
“Forestry research to support sustainable timber production
and self-sufficiency in food, energy, and water”
PAPER PRESENTATIONS
PAPER A1 - Importance of Social Capital for Community
Empowerment to Ensure Household Food Security of the
Agroforestry Farmers in Wan Abdul Rachman Grand Forest Park
Arzyana Sunkar1, Windy Mardiqa Riani2, Leti Sundawati3
1Department of Forest Resources Conservation and Ecotourism, Faculty of Forestry, Bogor Agricultural
University, Bogor Indonesia
2Department of Forestry, Faculty of Agriculture, University of Lampung, Lampung Indonesia 3Department of Forest Management, Faculty of Forestry, Bogor Agricultural University, Bogor Indonesia
Corresponding Email: [email protected]
ABSTRACT
Ensuring food security is a fundamental challenge facing the government. Empowering the local people to be able to secure access to food - as an important condition to ensure food security - is another challenge. Hence, the inherent power of the local communities to adapt and manage their own resources for their survival is important to be highlighted. In such case, social capital is an important concept that deserves attention and should become an emerging issue in community empowerment. This paper examined the potential relationship between social capital and food security. Research was conducted in the Villages of Sumber Agung, Batu Putu, and Talang Mulya within the Wan Abdul Rachman Grand Forest Park Protected Area of Lampung Province. Data was collected employing the methods of interviews, field observation and literature studies. Respondents were selected among agroforestry farmers using random sampling. Results of the research indicated that among the three elements of social capital studied, i.e., trusts, norms and social networks, trust and social networks formed the two most crucial factors in determining the success of household food security for the agroforestry farmers of Wan Abdul Rachman Grand Forest Park. The presence of local leaders, maintenance of good relationship between the local people, with the manager of the Grant Forest Park as well as increased level of networking proved to enhance food security of the villagers. The results also indicated the necessity to provide enabling conditions where community could build social capital and using social capital to empower themselves.
Keywords: agroforestry, community empowerment, household food security, social capital, social network, trust
1. INTRODUCTION
Food is one of the factors that determine why the poor take decisions to spread risk and how they finally balance competing needs in order to survive. Many of the rural poor are subsistence producers, family farmers or landless agricultural workers, including fishermen, pastoralists, and forest-dependent peoples with limited access to productive means. Poor on-farm resources such as limited productive land and low access to agriculture inputs, have driven rural families to increasingly depend on off-farm incomes, which is their way out of poverty when the rural economy is thriving. Hence, it can be said that sustainable development in rural areas, is actually about food security (Sunkar, 2008).
dependent on the ability of the community to access food, not only from own production but also food purchased from the market using its own assets. In the same line, EIU (2012) states that food insecurity in Indonesia is not necessarily due to unavailability of food, but rather due to lack of affordability and vulnerability to food price shocks. High prices make food less affordable for consumers. Those, for whom food consumption makes a significant portion of household expenditure, are the most vulnerable to higher prices (EIU, 2014).
The ability to purchase food links to income. Most rural households’ incomes in developing countries depend directly or indirectly on agriculture. Hence, for these households, income plays a very important means to secure food. A relatively small temporary reduction of income would mean that the household would consume less food than is required to maintain a healthy and active life (Zeller et al., 1997). This is one of the important condition enabling food security as stated in Rome Declaration on World Food Security at World Food Summit
(1996), i.e., “Food security exists when people at all times have physical, social and economic
access to sufficient and nutritious food that meets their dietary needs for a healthy and active life”.
The nexus between income and food security is thus important for a rural community survival, specifically where local food crop production is not an option. Such condition can be found among the agroforestry farmers of Wan Abdul Rachman Grand Forest Park who are given the rights to practice agroforestry inside a state protected area. The agroforestry lands are only allowed to be planted with cash crops and cannot be planted with food crops. Thus, cash crops are an integral part of strategies to improve food security for the households in this area. By selling their cash crops on markets, the households generate income that improves their accesses to food. On the other hand, communities with increased specialisation in cash crops will face a drop in incomes during harvest failure, when prices fall, or lack or minimum access to market. Such income slump will have consequences for their food security status (Achterbosch et al., 2014), which could eventually lead to food insecurity.
Food insecurity is an indicator of poverty and social capital is said to be able to significantly alleviate poverty. Research by Dzanjaet al. (2013) specifically concludes that social capital has positive influence on household food security. The linkage between social capital and food security, is however, has not been extensively studied. This paper will look at the importance of social capital in ensuring food security of the cash crops agroforestry farmers of Wan Abdul Rachman Grand Forest Park of Lampung Province in Indonesia, with focus on the contribution of agroforestry to the local income-generation.
2. EXPERIMENTAL METHOD 2.1 Time and location of research
The research was conducted in Wan Abdul Rachmad Grand Forest Park, Lampung Province of Indonesia from May-July 2014. Specifically, the research took place on the social forestry and reforestation block within the Grand Forest Park.
2.2 Sampling procedure and size
unit of population sampled selected was agroforestry household. A simple random sampling technique was used to select respondents out of all the agroforestry farmers. To determine the minimum amount of population that must be acquired, Paul Leedy formula (Arikunto, 2010) was used (Equation 1), while the total number of respondents within each village followed Walpole formula (Equation 2) as follows:
(1) Where:
n : size of sample
p : the estimated proportion of cases in the population
e : the proportion of sampling error in a given situation
z : the standard score corresponding to a given confidence level
( ) (2)
Where:
Nvillage : number of individuals in each village
Ni : number of ith population in a village
N : total population
n : population size
The use of Equation 1 and 2 gave the total number of respondents as shown in Table 1.
Table 1: Total number of samples
No. Village name Sub-district No. of household
No. of household sampled
1. Sumber Agung Kemiling 499 43
2. Batu Putu Teluk Betung 251 22
3. Talang Mulya Padang Cermin 398 34
Total 1148 99
2.3 Data Collection Technique
Both primary and secondary data were collected. Primary data included household income, social capitals comprised of trust, norms and networks elements, expenses from both agroforestry and non-agroforestry practices, and agroforestry plants composition, which were collected from direct observation and interviews. Secondary data included social-economic condition of the village samples collected through literature studies from periodic reports and publications from local authorities, institutions, government offices and websites.
2.4 Data Analysis
3. RESULT AND DISCUSSION
3.1 Agroforestry Practice in Wan Abdul Rachman Grand Forest Park
Prior to its establishment as a Grand Forest Park, Wan Abdul Rachman Grand Forest Park was previously a protection forest. Due to the increasing pressure on expansion of local monoculture and settlement, the protection forest was converted to a Grand Forest Park. As a result, the increasing surrounding local population faced limited productive land. Population density followed by low ability to purchase land, have triggered them to occupy the productive land inside the Grand Forest Park. The transmigration programme to place these people to other areas has produced no results, due to low land productivity of the new place. Instead, they came back to occupy their old land and demanded that they were given the rights to work the land inside the Grand Forest Park under the Social Forestry Scheme. Responding to this, since 2000, the Provincial Forestry Office of Lampung in collaboration with NGO and local university has helped the local communities to work the land inside the Park, employing
agroforestry practices on the Park’s block that is intended for social forestry and reforestation development.
Agroforestry practice inside the Grand Forest Park was realized by lending a total of 2,304.03 ha of land or 10.45% of the total Grand Forest Park to the surrounding agroforestry communities, to be planted with forest trees and cash crops. Since it is a protected area, food crops are not allowed to be planted. Fruits were the main commodities for trade while forestry trees were used for reforestation and shades. The tree species planted were mostly comprised of jackfruit (Artocarpus heterophyllus), durian (Durio zibethinus), clove (Cinnamomum burmanii), tangkil (Genetum gnemon), petai (Parkia speciosa) and calliandra (Caliandra sp.), with durian and tangkilas the dominating tree species, while the dominating cash crops are coffee (Coffea arabica) and kakao (Theobroma cacao).
3.2 Agroforestry and Off-farm Contributions to Household Income
Dawson et al. (2013) observed that among the benefits that agroforestry supports is raising
farmers’ income. Similarly is the conclusion by Idumah & Akintan (2014) who urged the young to go into farming based on their study that agroforestry is very profitable and a ready source of food supply. In the studied villages, agroforestry also contributed to the household income as depicted in Table 2. Table 3 clearly indicated that Talang Mulya has the highest dependency on agroforestry, owing to a total of 62.79% of the total income and the least dependency on agroforestry for Sumber Agung Village with only 31.32%. Asmi et. al., (2013), in their research, conclude that as much as 91.44% of the total income of the agroforestry farmers in Pesawaran Indah Village of Wan Abdul Rachman Grand Forest Park were attained from agroforestry.
Table 2: Contribution of agroforestry on total annual household income
Batu Putu 5,376,137 11,685,682 46.01
Talang Mulya 7,512,647 11,965,647 62.79
Average 7,493,839 18,094,726 41.41
Figure 1: Distribution of non-agricultural occupation among the three studied villages
Figure 1 indicates that trading is the most common occupation found in Sumber Agung Village which suggested that Sumber Agung Village is the most accessible to markets. This is also justified by the fact that Sumber Agung Village received the highest total income, with significant non-agroforestry (Table 3) sources, and enjoyed the highest income from agroforestry as compared to Batu Putu and Talang Mulya Villages (Table 4).
Table 3: Total annual household income
Village
Sumber Agung 9,592,732 21,040,116 30,632,848
Batu Putu 5,376,137 6,309,545 11,685,682
Talang Mulya 7,512,647 4,453,000 11,965,647
As depicted in Table 4, it is clear as to the reason that Sumber Agung Village received the highest income from agroforestry practice. Unlike Batu Putu and Talang Mulya Villages, Sumber Agung Village has the most diverse cash crops with various harvesting periods. This would allow the households to be able to receive income. Table 4 also indicated that coffee and cacao are the two most main prime commodities in all villages. This was due to the fact that both commodities have good market prices. The close distance to the market that
Sumber Agung enjoyed, also provided other benefits such as easier access to education and less transportation expenditures (Table 5).
The results were in line with previous research on the contributions of off-farm incomes. Babatunde & Qaim (2010) showed that off-farm income contributes to improved calorie supply at the household level. Owusu et al. (2011) also showed that off-farm work can exert positive effect on household income and food security status. These views indicate that off-farm work is crucial to attain food security.
Table 4: Total annual household income from agroforestry crops in each village sample
One important result depicted by Table 5 was that Sumber Agung people were able to have savings, implying that the total income exceeded the total expenses, signifying that Sumber Agung Village as the most prosperous among the three village studied. Table 5 revealed that most of the expenses were on food, suggesting that access to food is very important. Table 5 also showed that Talang Mulya Village has the highest expenses. Talang Mulya is located furthest from market which resulted in a higher transportation cost to sell agroforestry produces. Furthermore, such long distance has resulted in the increase of food prices and other commodities. This has made the population of Talang Mulya Village to spend of their income for food as seen in Table 5.
Table 5: Details of household expenses in the three villages studied
Type of expenses Sumber Agung
[Rp/household/year]
Batu Putu [Rp/household/year]
Talang Mulya [Rp/household/year]
Food 12,302,326 11,528,409 14,922,059
Clothing 856,977 477,273 538,235
Health 353,953 561,182 348,824
Education 1,051,093 40,909 194,412
Transportation 1,664,150 2,991,409 3,044,324
Electricity &water 877,195 1,084,636 633,618
Agroforestry
Coffee 3,278,488 1,677,273 3,518,382
Cacao 2,503,605 2,176,136 2,973,529
Tangkil 988,837 270,455 711,765
Rubber 2,180,640 1,161,364 128,824
Clove 362,791 - 180,147
matters
Total 17,903,960 16,923,636 20,363,825
Markets and trade increased access to food thus contribute to achieving food security (Hebebrand et. al., 2010). As illustrated by Simmonds (2006), one major causes of food insecurity in Malawi is long distances to markets. On the contrary, research by Tembo & Simtowe (2009) found that most of the rural households in Malawi that were food secure had no market access. Unfortunately, in the face of lacking food crop own production, one way to ensure food security in Talang Mulya Village is to increase access to market.
3.3 Social Capital and Community Empowerment to Enhance Food Security
There are two most obvious solutions to increase food security in the villages studied, i.e., to increase access to market through development of infrastructures and diversification of off-farm works. Both would require financial resources, which often not cheap. Tibesigwa et. al. (2014) suggest that an easier, cheaper and more accessible alternative to household coping strategy is to strengthen their social capital. Similar suggestion was also forwarded by Chen et al. (2013) that higher social capital in a farm household has significantly increases their adaptive capacity against environmental perturbation. Social capital is believed to enable households to gain access to needed supplies and allowing them to work together for increased efficiency and security. Therefore, social capital is an important concept underlying socio-economic and its broader context of food insecurity (Misselhorn, 2014). Various forms of collective action, as one form of social capital, have also been a central mechanism for improving market access and productivity of smallholder producers, (Ahuja & Staal, 2013).
Strengthening a community social capital would mean empowering the community, because social capital is about building community confidence of their own power to manage their environment. Community empowerment involves all efforts made by a group of people, with or without external support, to be able to continue to develop their capacity or potential for the improvement of their quality of life, independence and sustainability. It can be interpreted as a process that builds community through the development of human or community capacity. In order to be successful in empowering the community, it is important to have some basic understanding of the social organisation, social levels, and the community itself. It is also important to recognise the relationships between individuals, between individuals and community groups, and between communities (social capital).
Although maintenance of group norms will strengthen the communities’ social capital, the norms found within the three villages were similar and thus insignificantly related with food security within each village. The social capital that showed the strongest effect was social networks. Although in all three villages, they have established certain networks, however, the location of Sumber Agung Village which is the most accessible, has given it more advantages. Trading of cash crops accelerated the building of local association and thus empowers the individual within the group. The trust toward outsiders proved to enhance the communities to develop networks, such as easier network for trading due to easy access to markets, networking with the University of Lampung were also more frequent. Social networks are indispensable for increasing food security. Strong positive relationships within and between social groups could significantly increase collective action. Hence, social capital would build on community empowerment, which in turn will increase food security.
4. CONCLUSION
Food security for local people with lack of productive lands and lack of land tenure would depend on the income of the people and their access to food, including affordability to purchase food. The results of the study showed that although agroforestry is practiced on the state land and intended only for cash crops, it has the potential to be a profitable activity that can help the local community to become food secured.
In all three villages, access to food determined the status of their food security. Cash crops like cocoa and coffee, and also vegetables, offer income and employment opportunities to the rural economy. In addition, cash crops accelerate the build-up of institutions that enable further commercialisation. It has been argued that local institutions functioning at community level and social capital have their role in maintaining food security at household level. As any farming activity, cash crop agriculture requires the management of various types of risk such as soil degradation and price variability. The agroforestry farmers employ several adaptive and risk reducing strategies, for instance in Sumber Agung Village, by diversifying crops to cope with risks of harvest failures, price slums or loss of market access.
Social capital has positive influence on household food security through strengthening of community empowerment. These are especially necessary to enhance the capacity of the villagers to stand against any environmental and economic changes. Apart from increased market access, off-farm work and incomes play crucial roles in enhancing food security for all agroforestry farmers of Wan Abdul Rachman Grand Forest Park.
REFERENCES
Achterbosch, T.J., van Berkum, S., & Meijerink, G.W. (2014). Cash crops and food security; Contributions to income, livelihood risk and agricultural innovation. Wageningen, LEI Wageningen UR (University & Research centre), LEI Report 2014-015, 57 pp.
Ahuja, V., & Staal, S. (2013). Poverty, food security, livestock and smallholders: Issues and options for the Asia and Pacific Region. In V. Ahuja (Ed),Asian Livestock: Challenges, opportunities and the response: Proceedings of an international policy forum held in Bangkok, Thailand, 16-17 August 201 (pp. 97-106).
Arikunto, S. (2010). Prosedur penelitian suatu pendekatan praktik (p.413). Jakarta: Rineka Cipta. Asmi, M.T., Qurniati, R., & Haryono, D. (2013). Komposisi Tanaman Agroforestry dan
Babatunde, R. O., & Qaim, M. (2010). Impact of Off-Farm Income on Food Security and Nutrition in Nigeria. Food policy, 35(4), 303-311.
Chen, H., Wang, J., & Huang, J. (2014). Policy Support, Social Capital, and Farmers’ Adaptation to Drought in China. Global Environmental Change, 24, 193-202.
Dawson, I.K., Place, F., Torquebiau, Malézieux, E., Iiyama, M., Sileshi, G. W.,Kehlenbeck, K., Masters, E., McMullin, S. & Jamnadass, R. (2013). Agroforestry, food and nutritional security:Background paper for the International Conference o Forest for Food Security and Nutrition. FAO, Rome 13-15 May, 2013 (pp.
Dzanja, J. L., Christie, M., Fazey, I., & Hyde, T. (2013). The Role of Social Capital on Rural Food Security: The Case Study of Dowa and Lilongwe Districts in Central Malawi. Access International Journal of Agriculture Science, 1, 46-56.
Hebebrand, C., Wedding, K., & Elliott, K. A. (2010). The Role of Markets and Trade in Food Security: A Report of the CSIS Global Food Security Projects. CSIS
Idumah, F.O., & Akintan, A.O. Contribution of Agroforestry to Food Production and Income Generation in Sapoba Forest Area, Edo State, Nigeria. (2014). Journal of Horticulture and Forestry, 6(8), 64-71.
Jamnadass, R., Place, F., Torquebiau, E., Malézieux, E., Iiyama, M., Sileshi, G. W., Kehlenbeck, K., Masters, E., McMullin, S., & Dawson, I. K. (2013). Agroforestry for Food and Nutritional Security. Unasylva, 241(64), 22-29.
Misselhorn, A. (2014). Is a Focus on Social Capital Useful in Considering Food Security Intervensions? Development Southern Africa, 26(2), 189-208.
Owusu, V., Abdulai, A., & Abdul-Rahman, S. (2011). Non-Farm Work and Food Security among Farm Households in Northern Ghana. Food policy, 36(2), 108-118.
Sen, A. (1981). Poverty and Famines: An Essay on Entitlement and Deprivation. Oxford: Clarendon Press.
Simmonds, C. (2006). Questioning the Road: Local Perception and trends along the highway, Malawi, Working Paper Series: Yale University.
Sunkar, A. (2008). Sustainability in karst resources management: the case of the Gunung Sewu in Java. Doctoral thesis. New Zealand: the University of Auckland.
Tembo, D., & Simtowe, F. (2009). The effects of market accessibility on household food security: Evidence from Malawi. Proceeding of International Conference on Research on Food Security, Natural Resource Management and Rural Development, October 2009(pp. 6-8).
The Economist Intelligence Unit [EIU]. (2012). Global food security index 2012: An assessment of food affordability, availability and quality (p. 68). The Economist Intelligence Unit.
The Economist Intelligence Unit [EIU]. (2014). Global food security index 2014: An annual measure of the state of global food security (p. 35). The Economist Intelligence Unit. Tibesigwa, B., Visser, M., Twine, W., & Collinson, M. (2014). Investigating the Sensitivity of
Household Food Security to Agriculture-related Shocks and the Implication of Informal Social Capital and Natural Resource Capital: The Case of Rural Households in Mpumalanga, South Africa (No. 470).
PAPER A2 - Effect Filter Cover of Seedlings in Direct
Inoculation Screening of
Uromycladium tepperianum
for
Falcataria moluccana
Disease Tolerant
Asri Insiana Putri1, Liliana Baskorowati1, Nurhidayati1, Toni Herawan1, Siti Husna Nurrohmah1
1Center of Forest Biotechnology and Tree Improvement Research, Jl. Palagan Tentara Pelajar Km. 15,
Purwobinangun, Pakem, Sleman,Yogyakarta, Indonesia, 55582, Corresponding E-Mail: [email protected]
ABSTRACT
Effectively of direct inoculation screening of F. moluccana to gall rust disease tolerance in nursery needs to be proved in un-cultured pathogen like U. tepperianum. This technique requires accurate simulation of natural environmental conditions for disease infection to host target. The aim of this study is to observed effect of filter clear poly bag cover in direct inoculation screening of F. moluccana by fresh U. tepperianum spores as inoculums. Three months old of F. moluccana seedlings were used as host target. This research was designed as four groups of cases, seedlings with cover and non-cover, gall rust from 400 m asl and from 800 m asl altitudes sites. Each group comprises three families with 10 individual seedlings as replication. There were significant differences in percentage of galled formation at all treatments among family 1 and total families, but no significant effect at family 2 and 3 on NC400 and NC800 treatments. The highest seedlings percentage of gall rust formation (94.2480 % ± 1.97468) was in Family 2 with source of inoculums from 400 m asl. U. tepperianum spores from lower altitude site source can more able to formed gall rust than the higher altitude site.
Keywords: F. moluccana, U. tepperianum, gall rust, filter paper, direct inoculation, screening
1. INTRODUCTION
Use of disease tolerant/resistant plants is the ideal method to manage plant diseases, if plants of satisfactory quality and adapted to the growing region with adequate levels of durable tolerance are available. The use of disease tolerance plants eliminates the need for additional efforts to reduce disease losses unless other diseases are additionally present. Tolerant plants are usually derived by standard breeding procedures of screening (Fry, 1982; Arneson, 2001; Maloy, 2005).
gall-forming rust give rise to pycnia, recognized as small brown pustule which breaks through the epidermis. The typical symptom of gall rust disease on the seedlings is the bending of the stem or shoot, either with or without the formation of a dark red necrotic lesion (Rahayu, 2007).
Symptoms of the disease begins with local swelling (tumefaksi) in the affected part of the plant (leaves, branches and stems), further swelling turned into lumps which then became a small pimple or called gall. Arising galls have varied from round to form irregular diameters ranging from a few millimeters to greater than 10 cm. The galls can be grouped or spread on the affected areas. Young gall green light brownish covered by a layer of powdery slightly reddish color which is a collection of spores. Old gall reddish brown to black, usually the gall is porous or perforated, and is used as a nest of ants and other insects. When the diseased section of the petiole compound or canopy, that part a little bent because of thickening and swelling, then roll up the canopy leaves change shape (malformations) no longer leaves. If the plants have severe attacks, then the whole plant is filled by the gall, then the leaves dry up experiencing hair loss, followed by the trunk and branches of trees and plants eventually die (Anggraeni, 2008).
The germplasm screening methods can be classified into (i) direct intact or live plants, (ii) direct detached plant organs, and (iii) indirect approaches (Steadman et al., 1997; Olivier et al., 2008). Excised common inoculation of F. moluccana has been performed on direct inoculation using fresh gall rust spores suspensions (Morris, 1987; Kull et al., 2003). Effective screening for disease resistance requires accurate simulation of natural environmental conditions where plants are exposed to the inoculums (Porta-Puglia & Aragona, 1997). Optimum inoculation and incubation conditions should be established so that susceptible and resistant genotypes can be easily differentiated (Infantino et al., 2006).
Limited availability of space is often the major constraint to screening in environment control. Disease evaluation in controlled conditions is often used to identify resistant breeding material during non-crop periods, but may also be used to confirm the reaction of tolerant/resistant genotypes identified in the field or for characterization of pathogen variability (Infantino et al., 2006). Screening in the greenhouse or nursery without plastic cover allows challenging inoculums in interaction with other phytopathogenic organisms. Even though a major problem using plastic covers are high moisture, low respiration and the opportunity for cross-contamination via the wet surface (Narciso, 2008).
2. EXPERIMENTAL METHOD 2.1 Seedlings and gall rust spores material
Sengon seeds were collected from Wamena, Papua. Seedlings direct inoculations were observed in tissue culture nursery, Center of Forest Biotechnology and Tree Improvement at Kaliurang, Yogyakarta (7035’50.44” SL and 110025’35.54” EL), 800 m asl. altitude, 21 0C daily average temperature, 85 % daily humidity, 28-9200 lux daily light and daily win speed 0-0.4 m/s. Gall rust as U. tepperianum as spores source collected from 2 site of sengon society forest, Kaliurang, Yogyakarta (7035’50.44” SL and 110025’35.54” EL), 800 m asl, altitude and Tridadi,
Yogyakarta (7041’83.28” SL and 110021’97.82” EL) 800 m asl. Research activities were observed from 2012 until 2014.
2.2 Filtered nursery direct inoculation
Direct inoculation in this research was based on Morris (1987) and Kull et al. (2003) method with some modifications. Fresh spores were inoculated directly into all parts of healthy 3 months old seedling, two times for a week. Concentration of spores predetermined by haemocytometer at least 1x10⁵ spores/ml in sterilized water containing 0.2 ml/l Tween20
(polysorbate surfactant), stability and relative non-toxicityemulsifier. After inoculation, the seedlings covered by perforated clear poly bag with Watman20 filter paper for 14 days. During
incubation, seedlings moisture was maintained by capillarity system with water in the beds. Pest prevention was maintained by spraying insecticides in nursery every 1 week (Figure1).
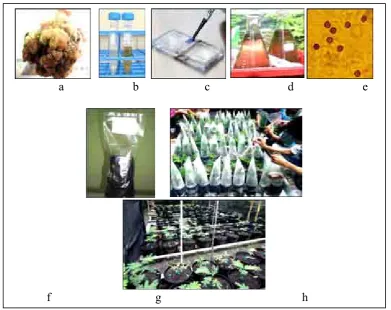
Figure 1: Direct inoculation in nursery of obligate biothropic pathogen
2.3 Design experiment
This research was designed as four groups of cases, seedlings with cover and seedlings with no cover, gall rust from 400 m asl and from 800 m asl altitudes sites. Each group comprises of three families with 10 seedlings as replication. Parameter of this observation was percentage of seedlings that attacked by gall rust. All treatments were compared with control. The group means data were analyzed using post hoc tests in the Analysis of Variance (ANOVA), if significant differences existed between the treatments, then groups will be analyzed using
Duncan’s multiple range tests.
3. RESULT AND DISCUSSION
Direct inoculation technique for each of the two sources of U. tepperianum spores was used to infected F. moluccana seedlings individually. Figure 2 illustrated calculated and inoculated the
fresh spores with filter poly bag cover and one month after the cover is opened. This directs intact inoculation application was modification technique for U. tepperianum live plants in nursery for screening disease tolerant. Successful screening for disease tolerant is based on the availability of precise and accurate screening technique (Infantino et al., 2006).
Figure 2: Gall rust of sengon with red-brown spores (a), fresh spores sampel in sterilized water (b), spore calculation with haemacytometer (c), sterilized water containing 0.2
ml/l Tween20 and at least 1x10⁵ spores/ml (d), microscopic observation of U. tepperianum
spores (e), seedling media polybag covered by perforated plastic bag with Watman20 filter
paper (f), seedlings inoculation and covered by filtered perforated plastic (g), sengon seedlings after one month inoculation (h).
Table 1: Descriptive statistic of each sengon family separately and the treatments
Factor Treatments (%) ± SE*
C400 C800 NC400 NC800
Family 1 86.9590 ± 3.79931 52.0590 ± 2.23692 20.0250 ± 1.22679 10.1620 ± 0.42476
Family 2 94.2480 ± 1.97468 54.2720 ± 3.02714 15.9250 ± 1.78243 10.4530 ± 0.40555
Family 3 89.1140 ± 3.43941 54.3730 ± 2.66821 16.2350 ± 1.61897 10.4270 ± 0.42460
*Standard error of the mean
The descriptive statistic for each family separately and the overall treatments were shown in Table 1. The result showed the highest percentage of seedlings that attacked by gall rust was in C400, followed by C800, NC400 and the lowest was NC800 treatments for all families. It is often difficult to achieve high and uniform pathogen pressure in the field year after year to permit adequate evaluation of plant germplasm for disease avoidance or physiological
a b c d e
micro environments like filter cover at nursery in this research can be expected to reduce the difficulty of plants disease screening to discriminate between physiological resistance and plant architectural avoidance of pathogen.
Table 2: Resume of ANOVA test results for percentage of seedlings that attacked with gall rust disease
Source of Variation Degree of Freedom Sum of Squares Mean of Square F Sig.
Family 1 Between
** Significant at 95% confident interval level
Table 3: Resume of Duncan’s Multiple Range Test results for percentage of seedlings that attacked with gall rust disease.
Treatments Subset for alpha 0.05
a b c d
Remarks: Numbers followed by different letters, a, b, c or d in the same column indicate significant differences
ANOVA test, determine the effect of treatments to the percentage of seedlings that attacked with gall rust disease (Table 2), indicated the significant effect of filter cover, the inoculums sources and the combination of these treatments individually between sengon families.
More specific from the further test using Duncan’s Multiple Range Test (Table 3), it was shown that all treatments at family 1 and total family had significant effect but at family 2 and 3 had no significant effect on NC400 and NC800 treatments. This result indicated that the site of inoculums source have a role of pathogen infection and gall rust formation. The severity of this disease depends on the interaction of the gall rust fungus, host response, and environmental conditions. The disease developed rapidly is probably due to favorable environmental conditions (Franje et al., 1993; Braza, 1997; Old & Cristovao, 2003).
Figure 3: Percentage of seedlings in gall rust attacked from family 1 (a), from family 2 (b), from family 3 (c), stem of sengon seedling attacked by gall rust (d) and petiole of sengon
seedling attacked by gall rust (e)
Fresh spores of un-cultured biotrophic pathogen from nature have a limited life time outside the host, thus the study of this technique is important to obtain accuracy of infection in fast incubation. This direct inoculation technique indicated that filtration through common filter paper (Whatman 40) on clear poly bag cover of seedlings have higher percentage of gall rust attacked. The inoculations technique led to gall rust formation during 9 months incubation for all families and treatments but there was no attacked at all in control. Figure 3 shown that percentage of seedlings in gall rust attacked has similar trend line in sengon family 1, sengon family 2 and sengon family 3. These similarity shows that the technique can be repeated in more than one population. Repetition is the requirements for the validity of new technique or modification technique. However, the technique must be observed for other un-cultured biotrophic pathogen in interaction with specific host plant.
Plants have the ability to continuously respond to various stimuli which alter their physiology, morphology and development. These range stimuli are from essential to toxic in their effects (Tugizimana et al., 2012). A clear and broader understanding of F. moluccana tolerant for gall rust screening that caused by U. tepperianum has not been fully investigated in all aspects, for it would open up possibilities of developing novel, more effective and sustainable strategies to control or eradicate fungal diseases in plants.
4. CONCLUSION
Filter cover of seedlings in nursery direct inoculation were effective as alternative technique for Falcataria moluccana gall rust tolerant screening that caused by Uromycladium tepperianum, the obligate biotrophic parasites pathogen.
ACKNOWLEDGMENT
The author would like to thank Fithry Ardhani, Titis Budi Ekowati as researcher team for helpful discussions. We are grateful to Endin Izudin, Suprihati, Rudi Hartono, Waluyo, Alin, Margiyanti, Heri, Sukijan and Susanto for technical assistants.
REFERENCES
Anggraeni, I. (2008). Penanggulangan Serangan Karat Puru pada Tanaman Sengon. Makalah Workshop. 19 Nop 2008. Balai Besar Penelitian Bioteknologi dan Pemuliaan Tanaman Hutan. Pusat Litbang Tanaman Hutan, Bogor. Indonesia.
Arneson, P. A. (2001). Plant Disease Epidemiology. The Plant Health Instructor. DOI: 10.1094/PHI-A-2001-0524-01.
Braza, R. D. (1997). Gall Rust Disease of Paraserianthes falcataria in The Philippines. For Farm Commun Tree Res Rep 2:61–62.
Brown J. K. M., & Hovmoller M. S. (2002). Aerial Dispersal of Fungi on the Global and Continental Scales and Its Consequences for Plant Disease. Science 297:537-541.
Franje, N. S., Alovera H. C., Isidora M. O., Expedito E. C., & Revelieta B. (1993). Gall Rust Of Falcata (Albizia falcataria (L. Beck): Its Biology And Identification. Northern Mindanau Consortium for Agriculture Resources Research and Development (NOMCARRD), Mindanao, The Philippines.
Fry, W. E. (1982). Principles of Plant Disease Management. Academic Press, New York. General Electric Company (2013). Laboratory Filtration, Principle and Chemical Compatibility
Infantino A., Kharrat M., Riccioni L., Coyne C. C., McPhee K. E., & Grunwald N. J. (2006). Screening Techniques and Source of Resistance to Root Disease in Cool Season Fond Legumes. Euphytica 147:201-221. Springer. DOI:10.1007/310681-006-6963-z.
Kull, L. S., Vuong T. D., Powers K. S., & Eskridge K. M., Steadman J. R., and Hartman G. L. (2003). Evaluation of Resistance Screening Methods for Sclerotinia Stem Rot of Soybean and Dry Bean. Plant Dis. 87:1471–1476. doi:10.1094/PDIS.2003.87.12.1471 Maloy, O. C. (2005). Plant Disease Management. Department of Plant Pathology, Washington
State University, Pullman, WA.
Miklas, P. N., & Grafton, K.F. (1992). Inheritance of Partial Resistance to White Mold in Inbred Populations of Bean. Crop Sci. 32:943–948. doi: 10.2135/cropsci 1992.0011183X003200040021x
Morris, M. J. (1987). Biology of the Acacia gall rust, Uromycladium tepperianum. Plant Pathology 36: 100–106.
Narciso, J. A. (2008). A Simple Method for Screening Antimicrobial Compounds with Application to Plant Disease and Fruit Quality. USDA/ARS. Citrus and Subtropical Products Laboratory, Winter Haven, Florida, USA.
Old, K. M., & Cristovao C. D. S., 2003. A Rust Epidemic of the Coffee Shade Tree ( ) in East Timor. Eds. H. Costa., C. Piggin., C. J. Cruz. And J. J. Fox. ACIAR Proceedings No. 113, Canberra, Australia. p: 139-145.
Olivier, C. Y., Gossen B. D., & Seguin-Swartz, G. (2008). Impact of Flower Age and Colour on Infection of Bean and Alfalfa by Sclerotinia sclerotiorum. Can. J. Plant Pathol. 30:1–8. doi:10.1080/07060660809507496
Portapuglia, A., & Aragona, M. (1997). Improvement of Grain Legumes General Part: Disease. Field Crops Res., 53:73-76.
Rahayu, S. (2007). Gall Rust Disease of Falcataria moluccana on Tawau, Sabah, Malaysia (PhD thesis). Universiti Putra Malaysia, Malaysia.
Smit, P. W., Elliot I., Peeling, R. W., Mabey, D., & Newton, P. N. (2014). An Overview of the Clinical Use of Filter Paper in the Diagnosis of Tropical Disease. American Journal Trop. Med. Hyg., 90(2):195-210.
Staples, R. C. (2000). Research on The Rust Fungi During The Twentieth Century Annual Review of Phytopathology Vol. 38: 49-69 (Volume Publication Date September 2000) Doi: 10.1146/Annurev. Phyto 38.1.49. Boyce Thompson Institute, Cornell University, NY.
Steadman, J. R., Powers K., & Higgens, B. (1997). Screening Common Bean for White Mold Resistance Using Detached Leaves. Annu. Rep. Bean Improv. Coop. 40:140–141. Tugizimana F., Steenkamp P. A., Piater L. A., & Dubery A. (2002). Ergosterol-Induced
PAPER A3 - Social Capital Status on HKm Development in
Lampung
Christine Wulandari 1, Pitojo Budiono 2
1 Lampung University , Forestry Department, Faculty of Agriculture, Jl. S. Brojonegoro 1, Bandar Lampung
35145, Indonesia
2 Lampung University , Faculty of Social Science and Politics, Jl. S. Brojonegoro 1, Bandar Lampung 35145,
Indonesia
Corresponding Email: [email protected]
ABSTRACT
It is known that social capital in community empowerment activities in local level is clearly essential in maintenance and use of the commons so it needs to be preserved the existence by keeping trust among the members of local community groups. Thus it is very important to recognize conditions and factors in the social capital which influence development of Community Forestry (CF) or Hutan Kemasyarakatan (HKm) program in Lampung. Based on the results of research at CF Group of Binawana in Tri Budi Syukur village, West Lampung, and HKm Group of Mekar Jaya at Lebak Paniangan village in Way Kanan, it is known that the level of social capital of those HKm group members are affected by the institutional governance of HKm groups including commitment and participatory level of its management personnel and assistance facilitating from other parties. The different levels of social capital in these two groups could also be observed from background of the groups establishment, as well as the work program planned and implemented by the group, whether short-term (annual) or long term (5 years) programs.
Keywords: social capital, HKm, institutional governance, management personnel, Group establishment
1. INTRODUCTION
Community-based forest resources management has been proven to save the forest function in some regions in Indonesia or other countries (Marwoto, 2012). According to Keraf (2010), community-based forest management is also able to prevent the forest from extinction. This condition could happen because of the harmony and alignment of environment which prioritize the balance of the ecosystem rather than economic interests. This is what makes the basic reason why social capital becomes an important element in the community forest management in Lampung Province. The Government through the Ministry of Forestry (currently known as the Ministry of Environment and Forestry, MoEF) has been reorienting the policy of sustainable forestry development. The reorientation includes the policy of priority for rehabilitation and economic empowerment of the communities around the forest. This policy reorientation is seen as one solution of the social aspects which is able to make the communities around the forest to contribute actively in the program of sustainable forest development.
term. In addition, social capital is a strategic investment either individuals or groups (Bourdie, 1986). Hauberer (2011) stated that Coleman emphasizes the concept of social capital in the context of rational choice theory to obtain benefits for all parties to the fullest. There is also other definition of social capital developed by Fukuyama (2007) that is as capabilities that emerge from general trust in the community or certain parts of it. Flassy et al. (2009) stated that trust is the key element in social capital, while other elements which is participation in the network, reciprocity, social norms, social values and proactive actions are the adequacy requirement of social capital. Based on the opinion of Flassy et al. (2009), then study of social capital in a community forest management will be observed on the aspects of trust, participation in the network, and the proactive actions of the board and members of community forest groups in managing forests which already obtain Izin Usaha Pemanfaatan
HKm (IUPHKm or license on HKm utilization) from the government. This study was
conducted because community based forest management factor is one of the determining factors in the sustainable natural resources management (Wulandari, 2013) and so far, there is still a few study on the role of human resources associated with the level of its social capital in the Community Forest Management in Lampung Province. The selected study sites are West Lampung District and Way Kanan District, because of the different background of HKm group formation.
2. EXPERIMENTAL METHOD
The study was held from June to August 2014 in West Lampung District and Way Kanan District, Lampung Province. Respondent are the committee and members of Community Forest (HKm) Group of Binawana in Tri Budi Syukur village, West Lampung and HKM Group of Mekar Jaya in Lebak Paniangan village in Way Kanan. Questions in the questionnaire is a modified version of SCAT (Social Capital Asessment Tool) dan SC-IQ (Social Capital on Integrated Questionaire).
The member of Gabungan Kelompok Tani (Gapoktan or Farmer Group Association) Mekar Jaya is 687 people who are members of the 10 groups (Mekar Jaya, 2011) and only 2 sub-groups that were chosen as research samples (144 people). They manage HKm which is located at Register 24, Bukit Punggur, Lebak Peniangan Village, Rebang Tangkas Sub District, Way Kanan. Based on the Decree of Minister No. 256/Menhut-II/2013, this Gapoktan obtained Penunjukan Areal Kerja (PAK or Working Area Designation) from the Ministry since April 19th 1993.
Gapoktan (Gabungan Kelompok Tani) or Farmer Group of Bina Wana is consisted of 493 people, who is member of the 7 sub-groups (Bina Wana, 2013). The 2 sub-groups has chosen as research samples or 161 people. The PAK permission of the Minister has been obtained since December 11th 2007 (Decree No. 434/Menhut-II/2007). Bina Wana got their IUPHKm No. B/1454/KPTS/III.05/2007 on December 13th 2007. The location of HKm which managed by this group is in Register 45 Bukit Rigis, Sumber Jaya Sub District.
The number of respondents who should take by the formula of Slovin (Wulandari, 2013) is:
N
n = 1 + Ne2
Where :
n = sample size N = population size
As results calculation, research conducted for 115 respondents of Gapoktan Bina Wana and 106 respondents of Gapoktan Mekar Jaya. Continue by qualitative descriptive analysis to explain the elements and levels of its social capital. The calculation of value interval to describe the characteristics based on the level of its social capital elements. The level of social capital is divided into four classes, namely minimum, low, medium and high. Lastly, calculation of Interval Value (Saputro, 2012) as follows:
the total highest score - total lowest score Interval Value =
number of classes.
3. RESULT AND DISCUSSION 3.1 Trust
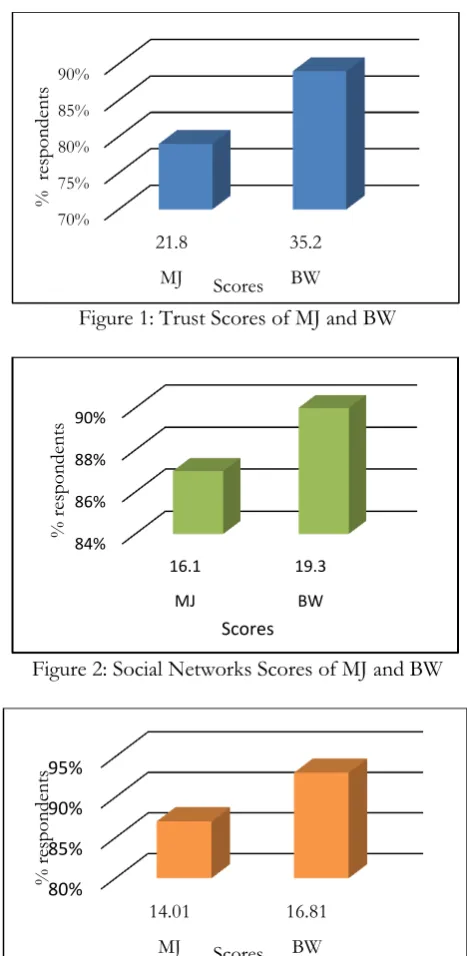
Trust is one of the requirements in the strengthening of social capital, and trust means that there are mutual trust between the members with other members in Gapoktan (Fukuyama, 2007). Sidu (2006) states that the level of trust is affected by conditions and feelings experienced by a person, but it is difficult to be measured because of its very broad sense and subjective (Mayes and Lewis, 2012). The confidence interval is 6 with Xmin = 15, Xmax = 39 and n = 4. Interval value is 6 if Xmin= 15, Xmax= 39 and n =4. Based on the calculation, it
will call as high level if scores ≥ 32, moderate 27 – 31, Low 21 – 26 and minimum ≤20. There are differences in the level of trust between the two Gapoktan, where Mekar Jaya is low and Bina Wana is high. Mekar Jaya has low trust level possibly due to the boards which appointed by the government and not by the members. That condition has influence to level of sense of belonging members to their Gapoktan or HKm institution. According to Mahareni (2011), managerial quality has impact to service quality of institution to members therefore needs high quality and appropriate management leader and staff which has chosen by members objectively. In detail, the trust level of Mekar Jaya (MJ) member on average 21.8 (low level) and Bina Wana (BW) is 35.2 (hight level) where details: trust to the people around, the same ethnic, different ethnic, government officials, forestry apparatus, community leaders,ç religious leaders, outside parties, trust in terms of lending and borrowing. While the category of trust level according to Uphoff (2000) is as follows: 79% of MJ members have low trust level and 89% BW members have hight trust level.
3.2 Social networks
The definition of social network is a relationship that is arranged in an interaction involving people, groups, communities, information and various social services therein. Social networks is strongly associated with the level of social capital as its multidimensional nature that allows collective action (Sidu, 2006). With value of Xmax=20 and Xmin= 6, with N = 4 is obtained the interval value of 3.5. It called as high level of social network if scores > 19, moderate if 18
– 14.5, low if 13.5 – 10, and minimum if < 9. Based on the score obtained, it is known that the strength of social networks in Mekar Jaya is moderate (16.1) and Bina Wana is high (19.3).
Figure 1: Trust Scores of MJ and BW
Figure 2: Social Networks Scores of MJ and BW
Figure 3: Social Norms Scores of MJ and BW
The level of social norms is minimum if the score≤ 9, low id 10-12, moderate 13-15 and high
≥16 Levels of social norms is based on the value of Xmax=20, Xmin=8, n = 4 (so that the
interval value of social norms level is 3). Based on the average value, it is known that the score of social norms of MJ group memberis 14.01 so it can be said to fall into the moderate category while in BW is 16.81and fall into the category of high. According to Lendesang (2014) differences in the level of social norms can occur because of the high and low of interference or influence from outside in addition to the level of the group solidity. This is the same with the opinion of Hernandez and Jimenez (2013) that disruption to social capital values generally come from outside the region or outside the village. The distribution of social norms level based of the continuum Uphoff (2000) can be seen that 87% of MJ respondents have moderate level and 93% of BW respondents have high level.
70% 75% 80% 85% 90%
21.8 35.2
MJ BW
% r
espond
ent
s
Scores
84% 86% 88% 90%
16.1 19.3
MJ BW
% r
espond
ent
s
Scores
80% 85% 90% 95%
14.01 16.81
MJ BW
% r
espond
ent
s
3.3 Proactive actions
Proactive action is one important element in the social capital because not only mean participation but always find a way for their involvement in social activities (Hasbullah, 2006). Interval value of confidence level of proactive action is 4 with Xmin = 7, Xmax= 23 and n=4.
So, the level of its proactive action is high if ≥ 21, moderate 20-16, low 15-11, and minim ≤ 10. Based on the analysis results it is known that the level of proactive action of MJ Gapoktan member is low or 15.05 and BW is high or 23.04.The distribution level of proactive action is 82% of MJ respondents at low level and high level of BW belong to 77% respondents.
The big difference in the level of proactive action is because both of these Gapoktan have different mechanisms and also intensity of coaching and mentoring from the government and outside parties. Moreover, because also the differences in the work plan clarity which has been arranged by the group either annual or five-yearly work plan. According to Menguc et al., (2010), various causes of the differences mentioned will affect the proactive action of a group.
3.4 Caring
Rinawati (2012) stated that awareness is the pattern of exchange which is not done reciprocally instantaneous, but rather a combination of short-term and long-term in the spirit of helping and altruism.A community group will have a strong and tough social capital in dealing with various social problems if it has a high level of awareness (Hasbullah, 2006). Value interval is 1.5 because Xmax = 10, Xmin=4 and n=4 then the awareness level is high if the caring
scores> 6.5, minimum jika ≤3.5, low: 3.6 – 5, and moderate: 5.1 – 6.5. It is known that the caring level of 89% of BW respondents is 7.6 (high) and 89% member of MJ respondents is 5.8 (moderate).
Figure 4: Caring Scores of MJ and BW
Figure 5: Proactive Actions Scores of MJ and BW
0% 50% 100%
5.8 7.6
MJ BW
% r
espond
ent
s
Scores
74% 76% 78% 80% 82%
15.05 23.40
MJ BW
% r
espond
ent
s
Clearly apparent differences in the caring level of the members in both gapoktan which can be caused by not gaining benefits of the group existence for the members of Gapoktan MJ; it is in contrary to what has been perceived by the members of BW. This proves the statement of Ssemakula and Mutimba (2011) that the benefit or advantage of grouping will affect to the group dynamics and caring of the members.
3.5 Social capital
Based on the scores of all the elements of social capital which analysed in this study, then obtained the scores of social capital as at the table 1. While the interval value is 18 with Xmin
≤40 and Xmax ≥ 112. It is said that the social capital is high if scores ≥94, moderate 75 -93, low 56-74 dan minimum if scores ≤55. If Gapoktan has high level of social capital it means HKm Gapoktan is very easy to be developed, if the social capital is mediumit means HKm Gapoktan is easy to be developed, on the contrary, if the level of social capital is low then it is difficult to be developed (Baliamoune, 2011). Based on the analysis results of social capital, then MJ has low level (72.76) and BW has high level (101.95).
Table 1: Capital Social Score of HKm Group of Mekar Jaya (MJ) and Bina Wana (BW)
No. Capital Social Aspect Total Score Mean Acore Value
MJ BW MJ BW Max Min
1. Trust 2,310.80 4,048 21.80 35.20 39 15
2. Social Networks 1,706.60 2,219.50 16.10 9.30 20 6 3. Social Norms 1,485.06 1,933.15 14.01 16.81 20 8 4. Proactive actions 1,595.30 2,649.60 15.05 23.04 23 7
5. Caring 614.80 874 5.80 7.60 10 4
Total 7,713.10 11,724.25 72.76 101.95 112 40
Source: calculated primary data, 2015
Of the type of social interrelation that occur within the Gapoktan it is known that there tends to be the type of social capital that binding in MJ and bridging di BW. In MJ, it can be seen from the attitude of the members who tend to be cautious if there are other communities who want to join into the group. As a result, there will be a strong distinction between "insiders" and "outsiders" and will affect to the accommodative level towards initiatives from the outside. In contrast with the BW group that already has a strong social capital and bridging nature, then it is more accommodating with building initiatives provided by other parties. With strong social capital in the BW group, it means that this Gapoktan has a high collective action and this had a positive impact on the progress of HKm forest land they managed. Similar conditions also occur in the groups of community of people forest cultivators in Sukabumi (Rinawati, 2012) and community groups of HTR cultivators (Saputro, 2012).
4. CONCLUSION
The analysis results described that the caring level in MJ is 5.80 and BW is 7.60.The difference of social networks level also occur where the MJ: 16.10 and BW is 19.30. For the score of social norms also differ in both groups so that MJ has the level of social norms 14.01 and BW has 16.81. Especially for trust and proactive actions in both groups have same on level difference, that is MJ at the level low (21.80 and 15.05 respectively) and BW high (35.20 and 23.04 respectively). Based on the overall analysis on the level of social capital owned by the two Gapoktan, it is known that the human resources aspects and elements of social capital affects to the level of effort which required by the government and other parties in the development of HKm in a region.
REFERENCES
Baliamoune, M. (2011). Trust-based social capital, institutions, and development. Journal of Behavioral and Experimental Economics (formerly The Journal of Socio-Economics), 2011, vol. 40, issue 4, pages 335-346.
Bina Wana. (2013). Laporan Tahunan 2013. Gapoktan HKm Bina Wana. West Lampung. Lampung.
Bourdie, P. (1986). The Form of Capital. In J.G. Richardson eds. Handbook of Theory and Research for Sociology of Education. New York: Greenwood Press. (pp. 46-58).
Flassy D.J., Rais, S., & Supriono A. (2009). Modal Sosial: Unsur-unsur Pembentuk. Jakarta. Bappenas.
Fukuyama, F. (2007). Trust: Kebijakan Sosial dan Penciptaan Kemakmuran. Ruslani, penerjemah. Cetakan Kedua. Jakarta: Penerbit Qalam. Terjemahan: Trust: The Social Virtues and The Creaton of Prosperity.
Hasbullah, J. (2006). Social Capital (Menuju Keunggulan Budaya Manusia Indonesia). Cetakan Pertama. Jakarta. MR-United Press.
Hauberer, J. (2010). Social Capital Theory Towards A Methodological Foundation. Heidelberg: VS Verlag fur Sozialwissenschaften. Springer Fachmedien Wiesbaden GmbH.
Henandez, A.C., & Jimenez, D.J. (2013.) Can Family Firms Innovate? Sharing Internal Knowledge From a Social Capital Perspective. The electronic Journal of Knowledge Management Vol. 11 Issue 1 (pp. 30 -37) available online at www.ejkm.com
Keraf, S. (2010). Etika Lingkungan Hidup. PT. Kompas Media Nusantara. Jakarta.
Lendensang, Y. (2014). Analisis Modal Sosial pada Komunitas Anak Jalanan di Pasar Pagi Kota Samarinda, Kalimantan Timur. E journal Ilmu Sosiatri 2(2): 41-54. Fakultas Ilmu Sosial dan Politik Universitas Mulawarman. Samarinda.
Mahareni, S. (2011). Pengaruh Kemampuan Manajerial Pengurus dan Kinerja Karyawan terhadap Kualitas Pelayanan Anggota Koperasi Pegawai Republik Indonesia Fajar baru Kecamatan Sukoharja Kabupaten Kendal 2011. Skripsi. Universitas Negeri Semarang. Semarang.
Marwoto. (2012). Peran Modal Sosial Masyarakat dalam Pengelolaan Hutan Rakyat dan Perdagangan Kayu Rakyat (Kasus di Kecamatan Giriwoyo, Kabupaten Wonogiri, Provinsi Jawa Tengah). Tesis. IPB. Bogor.
Mayes, L., & Lewis, M. (2012). Hand Book of Environment in Human Development. Cambridge University Press.
Mekar Jaya. (2011). Proposal Pengajuan HKm. Gapoktan HKm Mekar Jaya, Way Kanan. Lampung.
Menguc, B., Auh, S., & Ozanne, L. (2010). The Interactive Effect of Internal and External
Factors on a Proactive Environmental Strategy and Its Influence on a Firm’s
Rinawati, R. (2012). Social Capital of the Community in the Development Private Forest at the Sub Watershed of Upstream Cisadane. Tesis. IPB. Bogor.
Saputro, A.W.D. (2012). Modal Sosial dan Persepsi Masyarakat dalam Pembangunan Hutan Tanaman Rakyat di Kabupaten Ogan Komering Ilir. Tesis. IPB. Bogor.
Sidu, D. (2006). Pemberdayaan Masyarakat Sekitar Kawasan Hutan Lindung Jompi Kabupaten Muna Provinsi Sulawesi Tenggara. Disertasi. Sekolah Pasca Sarjana. IPB. Bogor.
Ssemakula, E., & Mutimba, J. K. (2011). Effectiveness of the farmer-to-farmer extension model in increasing technology uptake in Masaka and Tororo Districts of Uganda. South African Journal of Agricultural Extension. Vol.39 No. 2. pp. 30 – 4. Pretoria Jan. 2011. Print version ISSN 0301-603X.
Uphoff, N. (2000). Understanding Social Capital: Learning from the Analysis and Experienses of Participation. In Dasgupta P and Serageldin I (Eds.). Social Capital: A Multifaceted Perspective. Washington D.C.: The World Bank.
PAPER A4 -
Value chain of smallholder’s timber: Lessons from
Indonesia
Dede Rohadi1, Tuti Herawati1
1Centre for International Forestry Research, Forest and Livelihood Research Portfolio
Jalan CIFOR, Situ Gede, Bogor Barat 16115, ph.251 8622622, Fax 0251 8622100 Corresponding Email: [email protected]
ABSTRACT
The paper presents some key findings of smallholder timber value chain study recently completed in Indonesia. Focus of the study was on timber production practices and marketing strategies applied by farmer tree growers. The study collected value chain data on
smallholder’s timber plantation through interviews and focus group discussions with some farmer respondents and key informants at five districts in Indonesia. The study showed that the value chain of smallholder's timber involves many actors since farmer tree growers, middlemen, sawmills, wood based industries, and exporters. Smallholder timber generally undervalued by the industry due to its small size and low quality. Most of farmers are not implementing adequate silvicultural techniques on their timber plantations and less market oriented due to various factors. The supply of smallholder timber, however has been instrumental in the development of wood industry in Indonesia. Farmers need to be nurtured to increase their capacity, particularly in their market orientation, production techniques, and marketing strategy. Strengthening farmer's ability to apply better silvicultural techniques, collective marketing, and developing business link between farmers group with industry are among the required interventions by the governments or developing agencies.
Keywords: smallholder timber, value chain, profit distribution, middlemen, collective marketing.
1. INTRODUCTION
Timber plantation business plays an important role as a mean to improve farmer’s livelihood.
The business can also supply material for the timber industry and improve environment through the increased of land cover and forest area. Timber plantation activity has been part
of farmer’s culture in Indonesia where farmers have long been growing variety of timber
together with their agricultural crops on their farmlands and widely known as hutan rakyat or private forest.
Despite of these government efforts, it seems that timber plantation business is not yet attracting the majority of farmers in the country. The current total area of private forests in the country is about 4 million ha (Rohadi, 2012) and mostly is found in Java. The total area is far below the available potential land area for developing smallholder timber plantations. The total state forest areas that have been utilized by the community in various social forestry scheme is very low. By 2012, the total mapped state forests area allocated for HTR covered approximately 700,000 ha (Kementerian Kehutanan, 2013). However, the total area that have been granted to community or the issued license was only covered about 190,000 ha. Moreover within this granted area, the real plantation activities that have been taken place on the ground was only about 8,000 ha (Direktorat Jenderal Bina Usaha Kehutanan, unpublished).
Timber plantation provides important contribution on farmer’s income structures (Rohadi et al, 2012), especially in the context of income diversification strategies that commonly practiced by farmers. However, the study showed that farmers generally receive relatively low price when selling their timber and they have low bargaining position when negotiating prices with middlemen. More study is required to understand smallholder timber value chain and seek
some options to improve farmers’ bargaining position in the system.
This paper presents some of the lessons from a study of smallholder timber value chain recently completed in Indonesia. The study was done as a research component under an action research project that funded by the Australian Centre for International Agricultural Research (ACIAR) entitled "Overcoming Constraints to Community Based Commercial Forestry in Indonesia" or the CBCF project. The study was conducted at five districts in Indonesia, namely in Gunungkidul, Pati, Sumbawa, Bulukumba and Konawe Selatan. The main objectives of this study were:
a. To identify market actors and their roles in the smallholder timber value chain system; b. To analyse value chain model that best providing economic profit to farmer tree growers; c. To find strategies to increase benefits for farmers in their timber plantation business.
2. METHOD
2.1 Research Approach
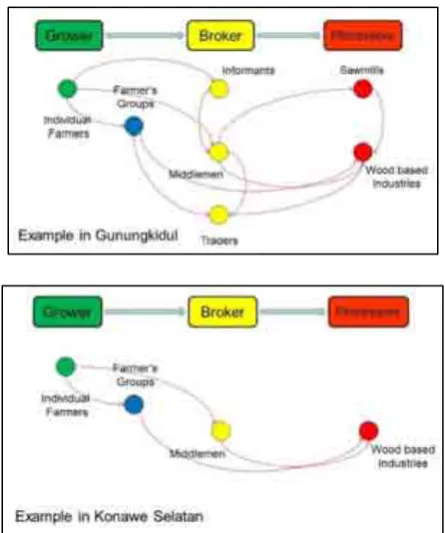
This study applied the framework of value chain analysis according to M4P (2008; 2012). Within this framework, value chain is defined as any activity carried out by various actors in the market (such as timber grower, market broker and industry) to produce timber and process it into a wide range of timber products that sold to consumers. The value chain is part of market system that consist of various functions and rules and is influenced by various market actors (ILO, 2009). Position of value chain in the market system is shown in Figure 1.
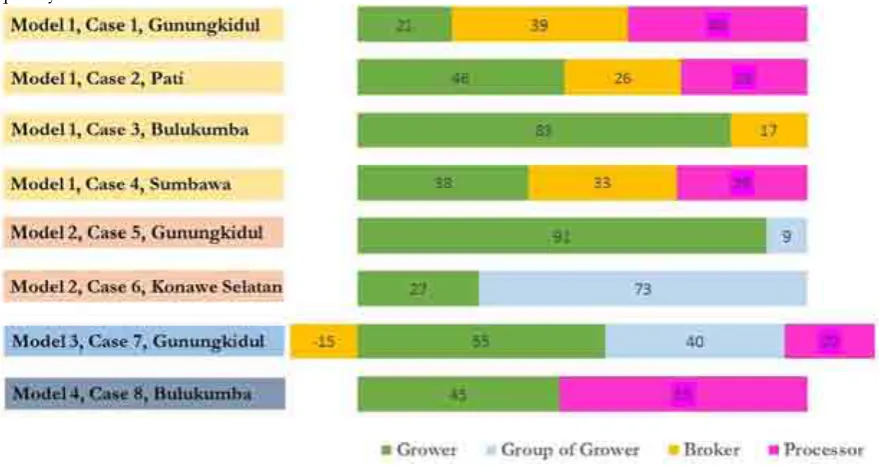
There are four timber value chain models were examined in this study. The four models were based on the preliminary results of the CBCF research in five districts of the study sites (van de Fliert, et.al 2012). These four models are:
- Model 1: In this model, the individual growers sell their timber to brokers who then resell the timber to processors (growers-brokers-processors);
- Model 2: In this model, the individual growers sell their timber to group of growers who then resell the timber to processors (growers-group of growers-processors);
- Model 4: In this model, the individual growers sell their timber directly to processors (growers-processors).
Figure 1: Value chain as a subset of market system
2.2 Data Collection and Analysis
Data collection was done by a Team of Researchers under the CBCF project. Team members come from various institutions that include the Australian National University (ANU), Centre for International Forestry Research (CIFOR), the Centre for Research on Climate Change and Forestry Policy - Forestry Research and Development Agency (Puspijak-FORDA), Forestry Research Institute of Makassar , University of Gajah Mada (UGM), Worldwide Fund for Nature (WWF) Nusa Tenggara, and Tress for Trees (T4T) Pati.
Data collection was done in 8 villages located in 5 districts and 5 provinces in Indonesia. The district names and province (in parentheses) were Gunungkidul (Yogyakarta), Pati (Central Java), Bulukumba (South Sulawesi), Konawe Selatan (Southeast Sulawesi), and Sumbawa (West Nusa Tenggara). Map of study sites is shown on Figure 2. Data collection activities in the field were conducted between July 2012 and April 2013.
Figure 2: Research Site of CBCF Project
various government agencies and conducted field observations at the sites. Interviews were guided by a questionnaire containing open-ended questions. Some of the key questions that were asked to the respondents are presented in Annex 1.
In this study, information on value chain was collected and analysed according to the guidelines that have been developed by M4P (2008). The collected information includes:
- Activities of actors, i.e. identification of specific activities of different actors;
- Transformation of products at each stage along the value chain;
- Relationships and connections between actors;
- Volume of products and number of jobs at each stage along the value chain;
- Value at stages along the value chain, including the distribution of costs and profits;
- Geographical flow of products, both at local and regional markets;
- Supporting functions, such as knowledge and information flows;
- Rules and regulations that relate to different actors and stages along the value chain. Not all of the information was reported in this paper however, as this paper more focus on information that directly relate to timber growers.
Data was analysed descriptively to explain timber value chain on actors that involved along the marketing chain, relationship and connection between actors, product transformation, rules and regulations that applied in the timber marketing. Quantitative analysis was used to calculate profit margin of each actor. The calculation process of profit margin was facilitated through table as presented in Annex 2.
3. RESULT AND DISCUSSION
3.1 Actors and their roles in smallholder timber value chain model
The study identified various actors among the timber growers, brokers and processors that involved in smallholder timber value chain system (Table 1). In some cases, the same actor may play more than one role in the system. For example, the wood depot can be seen as a broker as their main activity is trading the timber. However, they can also be classified into processor as they may also processing logs and selling sawn timber. The processors also vary widely, from small scale processors, such as sawmills that only processing logs into sawn timber, to more complicated wood industries such as furniture and plywood manufacturers. The study experienced that not all of market actors were always easy to be identified and interviewed as some of them were located outside the research area. For example, the timber processing industries in the case of Konawe Selatan were located in Java Island.
Table 1: The identified market actors in smallholder value chain system in research sites
Category of actor Market actor
Growers 1. Individual farmers
2. Farmers group
Brokers 1. Informant (e.g. Blantik)
2. Middlemen (e.g. Pengepul or Penebas or Pelele)
3. Wood Trader (e.g. Wood Depot)
Processors 1. Sawmill
2. Wood Depot