BRIGHTNESS PERFORMANCE OF OFFICE INTERIOR DUE TO
ROOM’S WINDOW COMPON
ENTS CONFIGURATION
Asri Dinapradipta1*, Johanes Krisdianto2
1,2
Department of Architecture, Institut Teknologi Sepuluh Nopember, Kampus ITS-Sukolilo, Surabaya - 60111 *
Corresponding author; Email: asridinapradipta@gmail.com, johaneskrisdianto@gmail.com2
ABSTRACT
The paper reports room’s brightness performance of glass dominance office building facade in Jakarta due to the use of tinted and reflective type of glass wall and the combination of these with internal roller and venetian shading types. Method used to collect the data was mainly by direct measurements at three open-plan office buildings with different window components configurations under overcast sky condition, and at parallel sitting positions. Comparing the results of measurement with the standard of luminance value for office building was used as data analysis. Results show that the window components configuration influenced the luminance values of the interior and thus affected mostly on the brightness perception of the rooms. Both tinted and reflective glazing configured with roller blinds yielded accepted luminance value of
rooms’ surfaces. They contributed to bright enough light perception of the rooms. On the other hand, the problem of room’s
luminance values may occur with the use of reflective type of glass configured with the venetian blinds. The blinds exacerbated the daylight coming from window in which it resulted in significantly high average luminance value of the window.
Keywords: Brightness; glass-facade office building; hot humid tropics; luminance values; window components configure-tion.
INTRODUCTION
Recent decades have witnessed an increasing popularity for office buildings in hot humid tropics, with extremely large and wide, un-shaded glazed curtain walls and deep open spaces. Some cases showed that the solar-protective glazing technologies, which solved the problem of daylighting in sub-tropics or even cool climates, might introduce problems in humid tropical regions (Haase & Amato, 2006). Typical design of high rise office buildings in tropical humid region is that they generally have large solar-protective glazing area and as the consequence of this is the necessity of using interior shading devices as thermal protection and daylight control. In a glass-dominance building, the window glazing used and shading might affect the quantity of daylight transmitted to the room. Together with the other
room’s surfaces properties, they might create various
luminance values of the room’s surfaces and might contribute to improper rooms’ brightness i.e either
overbright (tended to glary) or even gloomy environ-ment (Ibrahim & Zain-Ahmed, 2007; Li & Tsang, 2008).
Brightness is the attribute of a visual sensation according which an area appears to emit more or less light. It is determined by the average absolute luminance values of all surfaces in the room, parti-cularly those that captured in the visual field (CIE,
1987). The importance of surfaces’ luminance values
is increasingly recognized as a major determinat of
the rooms’ visual quality. To this, a study had
indicated the importance of luminance distribution of surfaces within a space (Loe et al., 1994). They found that the available light (created from both daylight transmitted from the glass window and the electric
lighting) affected the room’s surfaces luminance
values in which at the end will influence the rating of lighting adequacy and comfort for working. Other researchers found that compared to the illuminance
value, the room’s average surface luminance value
was much more important to gain perceived visual/
lighting quality based on subjective room’s brightness
assesment (Collins, 1994; Bulow-Hube, 2001). Shortly, it reveals that the quality of light coming from the light sources has high contribution to the proper luminance value of the surfaces and thus
affects the room’s brightness. Further, regarding which one of rooms’ surfaces having the most
influential effect to the brigtness of the room, some researchers asserted that the ceiling and the vertical surfaces particularly those of the walls with its components, had significant impact to the brightness sensation (Berruto, Fotoynont & Avouac-Bastie, 1997). According to them, carefull attention should be paid on these two surfaces as they may affect
significantly to the users’ brightness perception.
performance of window glass and its components such as shading device as a vertical daylight source should be taken into account and be carefully analyzed. Concurrently, the relevance to evaluate the window glass and its components is that because as a source of daylight, they contribute to harness the
room’s brightness performance in which together
with the illuminance, it dictates the overall room’s
visual quality i.e overbright (tended to glary), bright, or gloomy.
This paper is not intended to evaluate glare. It aims to report the room’s brightness performance, particularly the inner room’s surfaces’ luminance distribution of three glass-dominance office building facades in which they used several variety of window component configurations as sources of daylight.
METHODOLOGY
As this study aims at gathering information about the present existing condition and the degree of the present situation in detail, descriptive explorative method is then considered as the cathegory of the research explanation. It is emphazised on describing rather than on judging or interpreting (Groat & Wang, 2002). Further, based on the research objectives, since the inquiries are explored based on “what questions”, this research can be categorized as a quantitative research (Creswell, 2008). So that, it is essential for the research to have a clear view or picture of the phenomena being investigated before carrying out the data collection procedure. Further, the descriptive approach was employed since it is considered quick and practical.
Case Studies
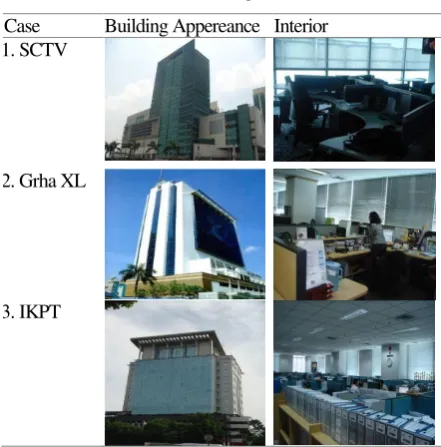
The study focused on three office building as the case studies (i.e the SCTV Tower, Grha XL, and IKPT buildings). They were all located in the city of Jakarta and chosen based on their window compo-nents configuration such as the variety of types of their window glazings and their interior shadings used (table 1). Since brightness perception is influenced
also by the rooms’ surrounding luminance values, the room’s interior surface attributes are also considered
in the measurement. The building figures and the their window configuration as well as the interior surface attributes is explained as the following:
The facades are mostly covered with solar protective glass and indoor shading device. In these buildings, tinted and reflective type of glass com-plimented with roller and venetian blinds type are applied as efforts to control heat and light.
Table 1. The Three Case Buildings.
Case Building Appereance Interior 1.SCTV
2.Grha XL
3.IKPT
Table 2. Window Component Configuration and their Properties of the Three Building Cases.
Case Type of window components and its properties (%) Glass Blinds (closed)
Opaque grey roller blinds. (T=15, R=85)
3 Reflective (T=42, R=58)
Yellowish venetian blinds. (T=5, R=95)
Note: T= transmittance value; R=reflectance value.
Table 3. Surrounding Surfaces Reflectance Values of the Three Building Cases
Case
Interior surrounding surfaces properties reflectance values (%)
Wall Floor Ceilling Working Plans
1 Light grey (47) Grey carpet (15) White (70) Light grey (45)
The independent variable of this study were the type of glass window, and some configurations of two types of solar-protective glass window and three types of interior shadings. Table 2 shows the proper-ties of these independent variables.
buildings i.e. case 2 and 3 in which they all have 45% of glass transmittance value of the reflective type of glass. The interior shading system used in these three case buildings was also variable. The value of trans-mittance of the system was depended mostly on the transparency of the material. From the table 2, it is noticed that the case 1 building that used perforated roller blind with many little hollow dots can release much light if it is compared to other two systems used in case 1 and case 2 buildings. Among those three shading systems, the shading used by the case build-ing 3 had the worst transmittance value since it was made of an opaque metal (aluminum) horizontal blinds that cannot transmit the light except from the small fissure (if any) between the metal bars/slats.
Data Collection Methods
Data collection method used in this research was mainly by direct measurement. Since this research is in the context of daylighting, the measurements were conducted in the absence of artificial lights. Other than that, information from secondary sources such as
building’s drawings, pictures, some products informa
-tion, and from the building’s technical managers were
also enrich the data. Important points and means of measurement for gathering the luminance values of the surfaces were determined as the following:
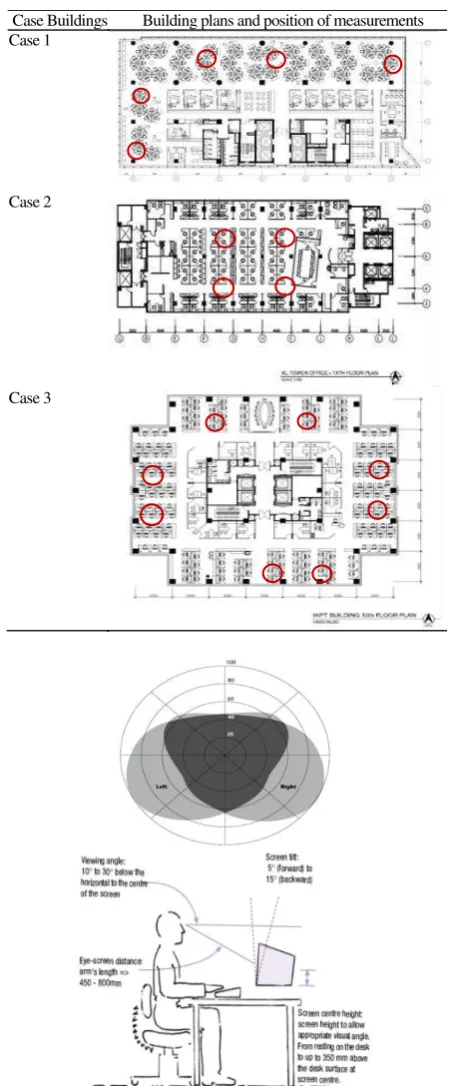
● Points of measurements were determined on the work planes located in zone 0-3 m from the nearest window distance (table 4). Luminance values were gathered at some sitting orientation of
the building’s plan (North, South, West, and East)
and at working planes faced parallel to the window posititions (figure 1).
Fig. 1. Luminance Values of Surfaces in Field of View were recorded from sitting position parallel to the window.
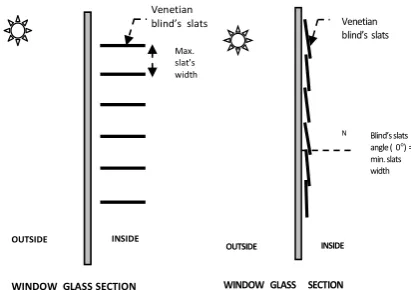
● Luminance measurements were taken during the month of August 2011 and by using digital Photometer (Hagner, S4). The photometer was held at 1.0 m high (the assumption of the height of
the workers’ eyes when sitting on their work
plane) and at the worker’s chair positions. For
gaining the field of view, the luminance meter was focused to approximately 40o in altitude and 90o in azimuth (as the area of the human field of view) so
that it was measuring the table with paper and VDT tasks and its surrounding surfaces (window, window frame, table, table devider, and walls) (figure 2).
Table 4. Points of Luminance Values Measurements at some sitting orientations
Case Buildings Building plans and position of measurements
Case 1
Case 2
Case 3
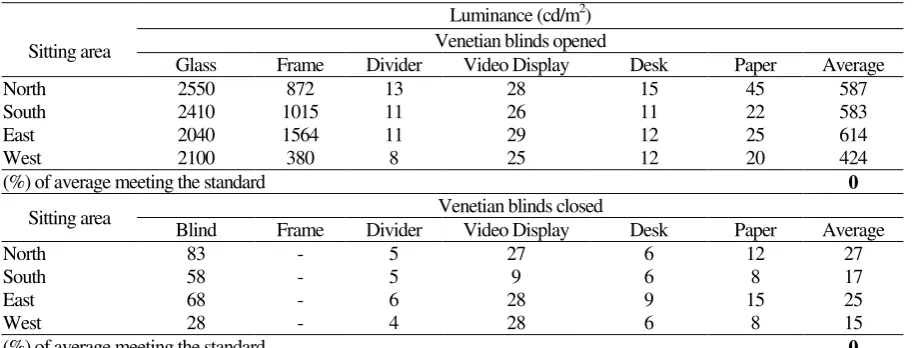
● The luminance measurements were taken when the window blinds were totally opened for measuring luminance values of the window glass and surrounding surfaces due to the capability of glass to transmit and reflected the daylight. Meanwhile, totally closed blind was situated for measuring the luminance values of the interior shading and the surrounding surfaces due to the capability of its to transmit and reflected the daylight. An opened roller blind was executed by rolling up the blind until reaching the top of upper window sill, while a closed one was that rolled down until it reached the bottom part of window sill (figure 3). Accordingly, an opened venetian blind was executed by tilting the slats fully opened at 90o, while a closed venetian blind was that
Fig. 4. Venetian blinds’ position opened (left), and closed (right).
Method of Analysis
After the all luminance values of points at the surfaces was gathered, the brightness analysis was conducted by comparing those average values at each surface in at every orientation of sitting area with the standard parameters. The international standards for
evaluation examined whether the luminance in the room is too high, accepted, or too low for office environment. Too much light will make the space over bright and inverselly, too little light will make the space appear gloomy and unpleasant. In this respect, the European standard i.e. NUTEK (1994) required that luminance values in an office space be kept below 1000 cd/m2 (preferably below 500 cd/ m2) in the normal visual field. Similarly, the CIBSE (1994) and Perry (1993) recommended that surface However, luminance values accepted had been set by some researchers i.e. bellow 30 cd/m2 value creates too low light while above 500 cd/m2 creates too bright light environment (Loe & Rowland, 1994).
RESULTS AND DISCUSSION
The results of the measurement of each building case are presented in Table 5 and 6. Table 5 and 6 show that all the solar protective glazing applied in two building cases were succeed to contribute to the acceptable luminance values of surfaces across the room. There are no average luminance values below 30 cd/m2 and above 500 cd/m2. In the case of combination of the glass and the shading, it shows that both window component configuration i.e. the tinted glazing combined with the perforated roller blind applied in SCTV and similar glass type combined with opaque roller blind as applied in Grha XL building were capable to contribute to the best performance of luminance value (100% meeting the standard requirement). However, from table 7, it is interestingly be noted that the reflective glazing complimented with both fully opened and closed venetian blind applied in case 3 building contributed to improper average luminance values of surfaces at all sitting positions. They yielded average luminance value above 500 cd/m2 when the venetian blinds were opened, and below 30 cd/m2 when the blinds were closed. It seems that the configuration of reflective glazing and venetian blinds were not the best surfaces
for gaining acceptable room’s average luminance
value. It can be also hypotesized that the venetian blind type is unsuitable to be applied in buildings in hot humid tropics since high reflectance property of
the shading’s metal slats exacerbates the daylight
In addition, as showed in table 5, 6, and 7, among the individual surfaces, both the window glazing per se and the shaded window (all confi-guration of glazing and blind types) surfaces had the highest surface luminance values compared to some other surrounding surfaces. Thus, for buildings in hot
humid climate, these two surfaces have the highest
contribution to the high rooms’ brightness and have a
potential as being sources of glare. These findings are in line with the concept stated that interior shadings can be used to eliminate excessive bright spots in the rooms since it can reflect and diffuse the bright light Table 5. Case 1 - luminance Values of the Surfaces and the Average of room’s Luminance Values Measured at some sitting areas
Sitting area
Luminance (cd/m2) Perforated roller blinds opened
Glass Frame Divider Video Display Desk Paper Average
North 250 122 62 85 85 140 121
West 256 146 68 85 87 151 128
East 254 138 62 85 92 149 126
(%) of average meeting the standard 100
Sitting area Perforated roller blinds closed
Blind Frame Divider Video Display Desk Paper Average
North 230 84 7 85 18 18 77
West 235 76 5 83 42 25 82
East 232 101 50 83 72 92 105
(%) of average meeting the standard 100
Table 6. Case 2 - Luminance Values of the Surfaces and the Average of Room’s Luminance Values Measured at some sitting areas
Sitting area
Luminance (cd/m2) Opaque roller blinds opened
Glass Frame Divider Video Display Desk Paper Average
North 249 69 60 85 123 139 121
South 242 39 41 85 121 111 107
(%) of average meeting the standard 100
Sitting area Opaque roller blinds closed
Blind Frame Divider Video Display Desk Paper Average
North 230 48 48 83 136 163 118
South 208 37 38 83 99 93 93
(%) of average meeting the standard 100
Table 7. Case 3 - Luminance Values of the Surfaces and the Average of Room’s Luminance Values Measured at some sitting areas
Sitting area
Luminance (cd/m2) Venetian blinds opened
Glass Frame Divider Video Display Desk Paper Average
North 2550 872 13 28 15 45 587
South 2410 1015 11 26 11 22 583
East 2040 1564 11 29 12 25 614
West 2100 380 8 25 12 20 424
(%) of average meeting the standard 0
Sitting area Venetian blinds closed
Blind Frame Divider Video Display Desk Paper Average
North 83 - 5 27 6 12 27
South 58 - 5 9 6 8 17
East 68 - 6 28 9 15 25
West 28 - 4 28 6 8 15
spot (Ander, 2003). But, the in the case of high reflective blinds such as the venetian blind, it does not eliminate the upcoming daylight. Inverselly, it will significantly attenuate the amount of light emitted. This result also does not in line with the findings from the study by Dubois (2001). She asserted that the best performance for redirecting and diffusing daylight was the venetian shading since it has better capability to reflect as well as redirect the incoming daylight from low altitude of the sun compared to the other shadings. This difference of finding is very important. The difference occured might be caused by different climate characteristic where the studies were
con-ducted. Dubois’ study was conducted in moderate
climate that has the majority of low sun angles from low altitude of the sun in which the low intensity of horizontal sky luminance can be attenuated and redirected very well using venetian blind. The horizontal slats of the venetian might also become a better device to reflect much more light at the highest sun angle from the high sun altitude in the tropics. However, this will rise problem of very high luminance of the window surface and will at the end be a glare source. This findings forces for further more detail research of the efficacy of horizontal venetian blinds and other interior shadings such as the vertical blinds as devices to control the upcoming daylight that determines the visual quality of office rooms particularly for office building in humid tropics climate.
CONCLUSION
This paper has discussed brightness performance of three office buildings in Indonesia due to some
configurations of window’s components. Results
show that all type of solar-protective glass applied in the case buildings transmitted daylight properly, so
that together with the other room’s surfaces they
contributed to accepted brightness performance in the office rooms. Meanwhile, if these solar protective glass windows were configurated with the venetian blind, very bad rooms’ brightness performance was created. The blind creates over bright light (tended to glary) when it is opened and too low light (tended to gloomy) when it was totally closed.
The study implies that the use of venetian blind for controlling daylight as well as visual quality of office building rooms in humid tropics climate might be unsuitable, so that the using of this kind of shading in this climate should be reconsidered. Further, it is recommended to do more researches on the effect of interior shading to indoor thermal performance so that the use of several types of interior shadings as environmental control device for office buildings in humid tropics region can be optimized.
ACKNOWLEDGMENT
This paper is written as a part of author’s
research report in completing her graduate thesis. The author would like to gratefully acknowledge the Ministry of Research, Technology and Higher Edu-cation of the Republic of Indonesia for providing both the scholarship and research grant 2008.
REFERENCES
Ander, G.D. (2003). Daylighting Performance and
Design, 2nd edition. John Wiley & Sons, New
pean Lighting Conference, May 11-14,
Amster-dam, pp.82-101.
Bulow-Hube, H. (2000). Office Worker Preferences of Exterior Shading Devices: a Pilot Study.
EuroSun 2000, June 19-22, Copenhagen,
Den-mark.
CIBSE (1994). Code for Interior Lighting. Chartered Institution of Building Services Engineers (CIBSE). London (UK).
CIE Technical Committee 4.2. E. Ne'eman & Ruck, N., eds. (1987). Guide on Daylighting of
Building Interiors, Part 1. Vienna, Austria.
Collins, B. (1975). Windows and People: A Literature Survey, Psychological Reaction with and
without Windows. National Bureau of Standards
Building Science Series 70.
Creswell, J.W. (2008). Research Design: Qualitative,
Quantitative, and Mixed Methods Approaches.
Sage Publications, Inc., California.
Dubois, M.C. (2001). Impact of Shading Device on
Daylighting in Offices. KFS AB. Lund.
Groat, L. & Wang, D. (2002). Architectural Research
Methods. John Wiley & Sons. Inc, New York.
Haase, M. & Amato, A. (2006). Sustainable Façade Design for Zero Energy Buildings in the Tropics. PLEA2006, proceeding seminar on the 23rd Conference on Passive and Low Energy
Architecture. Geneva, Switzerland, 6-8
Septem-ber 2006.
Ibrahim, N. & Zain-Ahmed, A. (2007). Daylight availability in an Office Interior due to various Fenestration Options. Proc. 2nd PALENC Con-ference and 28th AIVC ConCon-ference on Building Low Energy Cooling and Advanced Ventilation
Technologies in the 21st Century, September
Li, D.H.W. & Tsang, E.K.W. (2008). An Analysis Daylighting Performance for Office Buildings in Hongkong. Building and Environment, 43, pp. 1446-1448.
Loe, D.L, Mansfield, K.P & Rowlands, E. (1994). Appearance of the Lit Environment and its Relevence in Lighting Design: Experimental Study. Lighting Research and Technology,
26(3), pp. 119-133.
NUTEK. (1994). Programkraf: belysning pa kantor. Programkrav for god och energieffektiv
belys-ning pa kantor. 1994 – 11. Utgava 2. NUTEK.
Stockholm (Sweden).
Perry, M.J. (1993). Daylighting for Display Screen
Equipment. Report PD 217/93. Building